Hedgehog-induced PD-L1 on tumor-associated macrophages is critical for suppression of tumor-infiltrating CD8+ T cell function
←
→
Page content transcription
If your browser does not render page correctly, please read the page content below
Hedgehog-induced PD-L1 on tumor-associated macrophages is
critical for suppression of tumor-infiltrating CD8+ T cell function
Amy J. Petty, … , Xiaopei Huang, Yiping Yang
JCI Insight. 2021;6(6):e146707. https://doi.org/10.1172/jci.insight.146707.

 Research Article   Immunology

The programmed death-1 (PD-1) and the PD ligand 1 (PD-L1) interaction represents a key immune checkpoint within the
tumor microenvironment (TME), and PD-1 blockade has led to exciting therapeutic advances in clinical oncology.
Although IFN-γ–dependent PD-L1 induction on tumor cells was initially thought to mediate the suppression on effector
cells, recent studies have shown that PD-L1 is also expressed at high level on tumor-associated macrophages (TAMs) in
certain types of tumors. However, the precise role of PD-L1 expression on TAMs in suppressing antitumor immunity
within the TME remains to be defined. Using a myeloid-specific Pdl1-knockout mouse model, here we showed definitive
evidence that PD-L1 expression on TAMs is critical for suppression of intratumor CD8+ T cell function. We further
demonstrated that tumor-derived Sonic hedgehog (Shh) drives PD-L1 expression in TAMs to suppress tumor-infiltrating
CD8+ T cell function, leading to tumor progression. Mechanistically, Shh-dependent upregulation of PD-L1 in TAMs is
mediated by signal transducer and activator of transcription 3, a cascade that has not been previously reported to our
knowledge. Last, single-cell RNA sequencing analysis of human hepatocellular carcinoma revealed that PD-L1 is mainly
expressed on M2 TAMs, supporting the clinical relevance of our findings. Collectively, our data revealed an essential role
for Shh-dependent PD-L1 upregulation in TAMs in suppressing antitumor immunity within the TME, which could lead to
the development […]

Find the latest version:
https://jci.me/146707/pdf
RESEARCH ARTICLE

                                          Hedgehog-induced PD-L1 on tumor-
                                          associated macrophages is critical for
                                          suppression of tumor-infiltrating CD8+
                                          T cell function
                                          Amy J. Petty,1,2,3 Rui Dai,1,2,3 Rosa Lapalombella,3 Robert A. Baiocchi,3 Don M. Benson,3 Zihai Li,4,5
                                          Xiaopei Huang,1,3 and Yiping Yang1,3,5
                                          Department of Medicine and 2Department of Pharmacology and Cancer Biology, Duke University School of Medicine,
                                          1

                                          Durham, North Carolina, USA. 3Division of Hematology, 4Division of Medical Oncology, and 5Pelotonia Institute for
                                          Immuno-Oncology, Comprehensive Cancer Center, The Ohio State University, Columbus, Ohio, USA.

                                                  The programmed death-1 (PD-1) and the PD ligand 1 (PD-L1) interaction represents a key immune
                                                  checkpoint within the tumor microenvironment (TME), and PD-1 blockade has led to exciting
                                                  therapeutic advances in clinical oncology. Although IFN-γ–dependent PD-L1 induction on tumor
                                                  cells was initially thought to mediate the suppression on effector cells, recent studies have
                                                  shown that PD-L1 is also expressed at high level on tumor-associated macrophages (TAMs) in
                                                  certain types of tumors. However, the precise role of PD-L1 expression on TAMs in suppressing
                                                  antitumor immunity within the TME remains to be defined. Using a myeloid-specific Pdl1-knockout
                                                  mouse model, here we showed definitive evidence that PD-L1 expression on TAMs is critical for
                                                  suppression of intratumor CD8+ T cell function. We further demonstrated that tumor-derived
                                                  Sonic hedgehog (Shh) drives PD-L1 expression in TAMs to suppress tumor-infiltrating CD8+ T cell
                                                  function, leading to tumor progression. Mechanistically, Shh-dependent upregulation of PD-L1
                                                  in TAMs is mediated by signal transducer and activator of transcription 3, a cascade that has not
                                                  been previously reported to our knowledge. Last, single-cell RNA sequencing analysis of human
                                                  hepatocellular carcinoma revealed that PD-L1 is mainly expressed on M2 TAMs, supporting the
                                                  clinical relevance of our findings. Collectively, our data revealed an essential role for Shh-dependent
                                                  PD-L1 upregulation in TAMs in suppressing antitumor immunity within the TME, which could lead
                                                  to the development of new immunotherapeutic strategies for treating cancer.

                                          Introduction
                                          The programmed death-1/programmed death ligand 1 (PD-1/PD-L1) axis of interaction is one of the
                                          most important immunosuppressive mechanisms within the tumor microenvironment (TME), and tar-
                                          geting this mechanism has led to exciting therapeutic advances in clinical oncology (1–6). While PD-1
Conflict of interest: The authors have    was mainly found on the intratumoral lymphocyte population, PD-L1 expression has been observed on a
declared that no conflict of interest     diverse group of cells, including tumor cells, myeloid cells, lymphocytes, and stromal cells (7). Although
exists.                                   IFN-γ–dependent PD-L1 induction on tumor cells was initially found and commonly thought to mediate
Copyright: © 2021, Petty et al. This is   the suppression on effector cells (8), recent reports have shown that PD-L1 is also expressed on stromal
an open access article published under    cells, especially tumor-associated macrophages (TAMs, refs. 9–11). Additionally, PD-L1 on TAMs is more
the terms of the Creative Commons         stable and less dependent on IFN-γ (12). Furthermore, PD-L1 expression was more frequently detected
Attribution 4.0 International License.    on immune cells than on malignant cells in hepatocellular carcinoma (HCC), non–small cell lung cancer,
Submitted: December 7, 2020               urothelial carcinoma, and esophageal squamous cell carcinoma (13–15). However, it has been difficult
Accepted: February 17, 2021               to query the precise role of PD-L1 on each of the cell populations within the TME due to the lack of a
Published: March 22, 2021                 conditional ready Pdl1fl/fl mouse model that allows for lineage-specific deletion of Pdl1. Here we showed
                                          that we have successfully generated, to the best of our knowledge, the first Pdl1fl/fl model in pure C57BL/6
Reference information: JCI Insight.
2021;6(6):e146707.                        background. After breeding to LysM-cre mice expressing Cre recombinase in myeloid cells (16), these mice
https://doi.org/10.1172/jci.              showed a complete deletion of Pdl1 in myeloid lineage cells. This allowed us to directly study the role of
insight.146707.                           TAM-derived PD-L1 in subverting adaptive immune responses within the TME.

                                                                                                                                                              1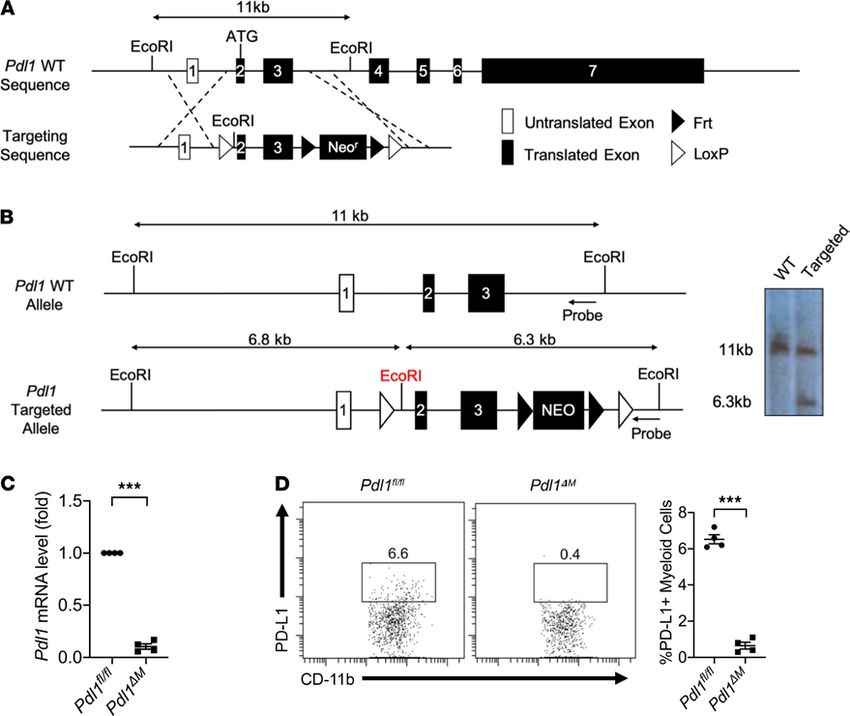
RESEARCH ARTICLE
The Hedgehog (Hh) signaling pathway plays an important role in tumorigenesis in many types of
human cancer (17). Binding of Sonic hedgehog (Shh), Desert hedgehog (Dhh), or Indian hedgehog (Ihh)
to the transmembrane protein Patched-1 on target cells leads to the release of Smoothened (Smo) and acti-
vation of downstream signaling events mediated by the Gli family of transcription factors (18). We have
recently demonstrated an important role for Hh signaling pathway in promoting M2 polarization of TAMs,
leading to a reduction in CD8+ T cell recruitment to the TME (19). The immunosuppressive M2 phenotype
of TAMs is also closely correlated with PD-L1 expression in several cancer types (20–23). However, what
regulates the PD-L1 upregulation on M2 TAMs remains to be determined.
In this study, we first showed that tumor stroma-derived PD-L1 is important for suppression of intra-
tumor CD8+ T cells and that the majority of PD-L1–expressing cells in the hepatoma stroma were TAMs.
Using a newly generated myeloid-specific Pdl1-knockout model, we demonstrated that deletion of Pdl1 in
TAMs rescued intratumor CD8+ T cell function and suppressed tumor growth, providing proof for the
critical role TAM-derived PD-L1 plays in suppressing intratumor CD8+ T cell function. We further found
that Hh signaling regulates PD-L1 expression in TAMs and that tumor-derived Shh drives PD-L1 expres-
sion in TAMs to suppress tumor-infiltrating CD8+ T cell effector function, resulting in accelerated tumor
progression. Last, we identified that signal transducer and activator of transcription 3 (Stat3) mediates the
downstream effects of Hh in TAMs to regulate PD-L1 expression. Single-cell RNA (scRNA) sequencing
analysis of human HCC revealed that PD-L1 is mainly on M2 TAMs, supporting the clinical relevance
of our findings. Collectively, our data revealed an essential role for Shh-dependent PD-L1 upregulation in
TAMs in suppressing antitumor immunity within the TME, which could lead to the development of new
immunotherapeutic strategies for treating cancer.
Results
Tumor stroma-derived PD-L1 is critical for suppression of intratumor CD8+ T cells. To first investigate whether
non–tumor-derived PD-L1 plays a role in suppressing intratumor CD8+ T cell function and tumor growth
in HCC, we generated mouse hepatoma Hepa1-6 cells with Pdl1 deletion (referred to as Pdl1-KO) using
CRISPR/Cas9-mediated gene knockout (24). Pdl1-WT Hepa1-6 cells were created using a lentiviral CRIS-
PR/Cas9 vector containing a nontargeting guide RNA (gRNA) sequence. Pdl1-WT and Pdl1-KO Hepa1-6
cells were subcutaneously inoculated in C57BL/6 mice, and a cohort of mice bearing the Pdl1-WT tumor
were further treated with 10 mg/kg anti–PD-L1 antibodies 3 times per week starting at day 14 postinocula-
tion. On day 28 at sacrifice, we observed no significant tumor growth reduction (P = 0.08) in mice bearing
the Pdl1-KO tumor compared to Pdl1-WT bearing mice. However, treatment of Pdl1-WT tumor-bearing
mice with anti–PD-L1 antibodies resulted in significant (P < 0.005) reduction in tumor growth compared
with untreated mice (Figure 1A). Assessment of the tumor-infiltrating CD8+ T cells revealed no signifi-
cant change in CD8+ T cell numbers within the tumor stroma regardless of Pdl1 deletion in tumor cells
or with PD-L1–blocking antibodies (Figure 1B). However, CD8+ T cells in the tumors treated with anti–
PD-L1 antibodies demonstrated a marked increase in effector function measured by IFN-γ and granzyme
B (GzmB) production. When compared with the Pdl1-KO samples, intratumor CD8+ T cells in mice treated
with anti–PD-L1 antibodies produced significantly (P < 0.05) higher levels of IFN-γ and GzmB measured
by fluorescence-activated cell sorting (FACS, Figure 1C). These data suggested that non–tumor-derived
PD-L1 plays an important role in subverting intratumor CD8+ T cell function.
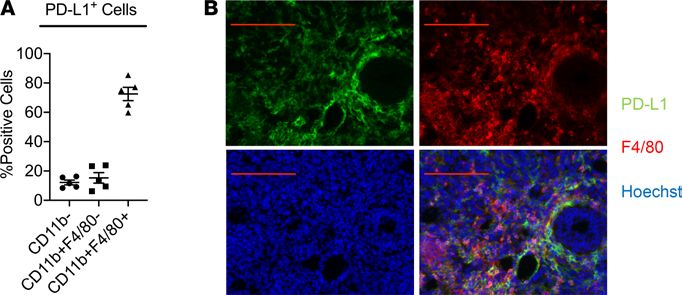
TAMs are the main PD-L1–expressing cells within the TME. We then proceeded to identify the PD-L1+ pop-
ulations within the TME of HCC. We found that 72.3% of PD-L1+ cells were CD11b+F4/80+ TAMs, with
CD11b+F4/80– other myeloid cells and CD11b– nonmyeloid cells making up 15.3% and 12.4%, respectively
(Figure 2A). Immunofluorescence staining of the subcutaneously inoculated Hepa1-6 tumor samples fur-
ther revealed substantial overlap between PD-L1+ cells (shown in green) and F4/80+ TAMs (shown in red,
Figure 2B). These results indicated that TAMs are the main PD-L1–expressing cells with the TME.
Generation and characterization of myeloid-specific Pdl1 conditional knockout mice. To study the precise role
of TAM-derived PD-L1 in suppressing antitumor immunity in vivo, we generated Pdl1 conditional ready
(referred to as Pdl1fl/fl) mice in a pure C57BL/6 background. Briefly, Pdl1fl/fl mice were created by replacing
the first 2 coding exons with a new gene segment with exons 2 and 3 plus a neomycin resistance cassette
(Neor) flanked by LoxP sites via homologous recombination (Figure 3A). Successful integration was con-
firmed by digesting genomic DNA of embryonic stem cells with EcoRI and performing Southern blotting
(Figure 3B). The genotype of the mice was further confirmed by PCR of tail samples (data not shown). We
JCI Insight 2021;6(6):e146707 https://doi.org/10.1172/jci.insight.146707 2RESEARCH ARTICLE
Figure 1. Non–tumor-derived PD-L1 expression is critical for suppression of intratumor CD8+ T cells. (A) Tumor growth of Hepa1-6 Pdl1-WT untreated or
treated with 10 mg/kg anti–PD-L1 antibodies and Hepa1-6 Pdl1-KO cells subcutaneously inoculated in C57BL/6 mice. Tumor volumes on day 28 at sacrifice
are shown. Percentages of intratumor CD8+ T cells out of all live cells (B) and their productions of IFN-γ and GzmB (C) were measured by FACS. Values are
mean ± SEM of a minimum of 3 independent experiments. *P > 0.05. **P < 0.005. ***P < 0.0005. n = 5 biological replicates per group (A–C). Kruskal-Wallis
test (A). One-way ANOVA (B and C). TILs, tumor-infiltrating leukocytes.
then generated the Pdl1 conditional knockout mice allowing for myeloid lineage deletion of Pdl1 by cross-
ing Pdl1fl/fl mice with LysM-cre mice, producing LysM-cre+Pdl1fl/fl (referred to as Pdl1ΔM). Deletion of Pdl1 in
myeloid cells in these mice was first assessed by quantitative real-time PCT (qRT-PCR) using bone mar-
row–derived macrophages (BMDMs) from Pdl1fl/fl and Pdl1ΔM and primers specific for mouse Pdl1 mRNA
(Figure 3C). Knockout status was confirmed with FACS staining of CD11b and PD-L1 on peripheral
blood cells from Pdl1fl/fl and Pdl1ΔM mice (Figure 3D).
TAM-derived PD-L1 is critical for suppressing intratumor CD8+ T cell function. We then proceeded to investi-
gate whether TAM-derived PD-L1 expression affected tumor growth and intratumor CD8+ T cell function
in vivo. Hepa1-6 tumor cells were inoculated in Pdl1fl/fl and Pdl1ΔM, and tumor growths were monitored over
time. We found that Pdl1ΔM mice had a significant (P < 0.005) reduction in tumor growth, compared with
Pdl1fl/fl tumor-bearing mice (Figure 4A). This was accompanied by a significant (P < 0.05) increase in the
levels of IFN-γ and GzmB production by intratumor CD8+ T cells compared with the control (Figure 4B).
However, no significant difference was detected in the percentages of the intratumor CD8+ T cells com-
pared to control (Figure 4C). Collectively, these results suggest that PD-L1 expression on TAMs is critical
for suppressing intratumor CD8+ T cell function.
Hh signaling regulates PD-L1 expression in TAMs. Using a conditional knockout mouse model that
allows for myeloid lineage deletion of Smo, referred to as LysM-cre+Smofl/fl (SmoΔM), we have shown that
deletion of Smo suppressed TAM M2 polarization and tumor growth (19). Here we found that intratumor
CD8+ T cells isolated from SmoΔM tumor-bearing mice produced significantly higher IFN-γ and GzmB
(P < 0.005) when compared with Smofl/fl (Figure 5A), suggesting that Hh-induced M2-polarized TAMs
could suppress intratumor CD8+ T cell function. Further examination of the expressions of PD-L1,
programmed death ligand 2 (PD-L2), CD80, and CD86 on TAMs revealed significantly (P < 0.0005)
decreased expression of PD-L1 on SmoΔM TAMs compared to Smofl/fl TAMs (Figure 5B). No difference
was observed with the expression of PD-L2, CD80, and CD86 on SmoΔM versus Smofl/fl TAMs (data not
shown). To further examine the role of Hh signaling in inducing PD-L1 expression on TAMs in a more
JCI Insight 2021;6(6):e146707 https://doi.org/10.1172/jci.insight.146707 3RESEARCH ARTICLE
Figure 2. The majority of the PD-L1+ cells within the TME are TAMs. (A) Percentages of CD11b–, CD11b+F4/80–, and
CD11b+F4/80+ cells within PD-L1+ population were assessed with FACS. (B) Immunofluorescence staining of PD-L1 (shown
in green) and F4/80 (shown in red) in subcutaneously inoculated Hepa1-6 tumors. Scale bar: 100 μm. Values are mean ±
SEM of a minimum of 3 independent experiments. n = 5 biological replicates per group (A and B).
physiological environment in which the HCC normally arise, we utilized mice deficient for the multidrug
resistance gene 2 (Mdr2–/–) as an autochthonous model of HCC previously described (25, 26). After gen-
erating LysM-cre+SmoF/FMdr2–/– mice (referred to as SmoΔMMdr2–/–), we also found a consistently increased
production of IFN-γ and GzmB in intratumor CD8+ T cells isolated from SmoΔMMdr2–/– tumors (Figure
5C), which was correlated with a reduction of PD-L1 expression on SmoΔMMdr2–/– TAMs (Figure 5D).
Collectively, these results revealed an important role for Hh signaling in promoting PD-L1 expression on
TAMs and suppressing intratumor CD8+ T cell effector function.
Tumor-derived Shh ligand is critical for PD-L1 upregulation on TAMs. To further confirm that Hh signaling
can directly promote PD-L1 expression on macrophages, we treated BMDMs from C57BL/6 mice with 5
ng/mL of Shh ligands for 24 hours and measured expression of PD-L1 via flow cytometry. We observed
that treatment of BMDMs with Shh significantly upregulated PD-L1 expression (P < 0.0005; Figure 6A).
Additionally, in vitro coculturing of CD3/CD28-activated CD8+ T cells with Pdl1fl/fl BMDMs in the pres-
ence of Shh showed significantly suppressed IFN-γ and GzmB productions (P < 0.005) when compared
with untreated samples. However, when Pdl1 was deleted in macrophages, no reduction was observed in
the presence or absence of Shh (Figure 6B), indicating the suppressive effects of Shh-induced M2 macro-
phages on CD8+ T cells are mediated through PD-L1.
Furthermore, we have previously generated Shh-KO Hepa1-6 hepatoma and LLC1 Lewis lung carci-
noma cells using the CRISPR/Cas9 technology to study whether tumor-derived Shh ligands are the major
source of Hh signaling within the TME (19). Upon assessing the expression of PD-L1 on TAMs in Shh-KO
tumor samples, we found that deletion of Shh in tumor cells also resulted in reductions of PD-L1 expres-
sion on TAMs, both in the Hepa1-6 (Figure 6C) and in the LLC1 (P < 0.005; Figure 6E) tumor models.
Last, this was correlated with improved intratumor CD8+ T cell effector cell functions demonstrated by
increased IFN-γ and GzmB productions in the Shh-KO samples measured by FACS (Figure 6, D and F).
This further supported a critical role for tumor-derived Shh in TAM PD-L1 expression and suppression of
intratumor CD8+ effector cell functions.
Hh-induced PD-L1 upregulation in TAMs is mediated by Stat3. We next sought to understand the mecha-
nisms by which Shh induces PD-L1 expression in TAMs. Previous studies have demonstrated that several
transcription factors are associated with PD-L1 upregulation in various cell types, including c-Jun (gene
symbol: Jun), c-Myc (gene symbol: Myc), Stat1, Stat3, and NF-κB (gene symbol: Nfkb1; ref. 27). Thus,
we surveyed the expression levels of these transcription factors in BMDMs treated with Shh and found
that Stat3 mRNA expression was significantly elevated when compared with untreated control (P < 0.05;
Figure 7A). We also found that Stat3 mRNA levels were significantly reduced in SmoΔM TAMs, compared
with Smofl/fl TAMs (Figure 7B), suggesting that Stat3 could be mediating the downstream effects of Shh
in TAMs. Through in silico promoter analysis, we found a consensus Gli-binding sequence (GCCCCG-
CCCC) at the –1076 to –1067 position upstream of the transcription start site of Stat3 (28). Using the
chromatin immunoprecipitation (ChIP) method, we found increased Gli1 occupancy at that site when
BMDMs were treated with Shh. Such binding was reduced to baseline when BMDMs were treated with 5
JCI Insight 2021;6(6):e146707 https://doi.org/10.1172/jci.insight.146707 4RESEARCH ARTICLE
Figure 3. Generation and characterization of Pdl1fl/fl and LysM-cre+Pdl1fl/fl mice. (A) Targeting strategy of generating Pdl1fl/fl mice. Top line shows WT mouse
allele with exons indicated by filled boxes and 5′ untranslated exons indicated by open boxes. Exon 2 contains the translational start site. Second line shows
the targeting construct including 11 kb murine genomic arms of homology, a LoxP site (hatched triangle) inserted 5′ of exon 2, a Neor cassette, and a 3′ LoxP
site. (B) Targeted embryonic stem cells were identified by Southern blot analysis of EcoRI-digested genomic DNA using the indicated 3′ external probe. (C)
Expression of Pdl1 in Pdl1fl/fl and LysM-cre+Pdl1fl/fl (Pdl1ΔM) BMDMs measured by qRT-PCR. LysM-cre+Pdl1fl/fl was generated by breeding Pdl1fl/fl with LysM-cre+/+
mice. (D) PD-L1 expression on Pdl1fl/fl and Pdl1ΔM peripheral blood cells was quantified by FACS to confirm Pdl1 deletion in CD11b+ myeloid cells. Values are mean
± SEM of a minimum of 2 independent experiments. ***P < 0.0005. n = 5 biological replicates per group (C and D). Two-tailed Student’s t test (C and D).
μM GANT61, a small molecule inhibitor of Gli transcription factors (29), in addition to Shh (Figure 7C).
This confirmed that Gli1 transcriptionally regulates Stat3 in macrophages and suggested that Stat3 could be
mediating the downstream effects of Shh in TAMs to regulate PD-L1 expression.
To further address this question, we generated 3 additional mouse models: (a) LysM-cre+SmoC (referred
to as SmoCM) mice, which allows for constitutive activation of Hh signaling in LysM-cre–expressing cells
(30); (b) LysM-cre+Stat3fl/fl (referred to as Stat3ΔM) mice that deleted Stat3 in myeloid cells (31); and (c)
LysM-cre+SmoCStat3fl/fl (referred to as SmoCMStat3ΔM) that also eliminated Stat3 in the setting of a constitutive-
ly active Hh pathway. After inoculation of Shh-secreting Hepa1-6, we observed accelerated tumor growth
in SmoCM mice compared with SmoΔM (P < 0.05). Stat3ΔM tumor-bearing mice showed significantly reduced
tumor growth compared with the SmoCM mice (P < 0.05). However, SmoCMStat3ΔM mice did not grow larger
tumors compared to Stat3ΔM (P = 0.3; Figure 7D). When comparing PD-L1 expressions on TAMs in these
tumor samples to the Smofl/fl controls, we found that SmoCM had the highest PD-L1 expression (P < 0.05) and
Stat3ΔM and SmoCMStat3ΔM had the lowest expressions (P < 0.005) of PD-L1 with no significant difference
between the 2 groups (Figure 7E). Inversely correlated with the PD-L1 expressions, IFN-γ and GzmB levels
were observed to be the lowest in the SmoCM group (P < 0.05) and highest in the Stat3ΔM and SmoCMStat3ΔM
groups (P < 0.05) when compared with the Smofl/fl samples (Figure 7F). Collectively, these results provide
evidence supporting that Hh-dependent upregulation of PD-L1 is mediated by Stat3 in TAMs in vivo.
JCI Insight 2021;6(6):e146707 https://doi.org/10.1172/jci.insight.146707 5RESEARCH ARTICLE
Figure 4. Deletion of Pdl1 in TAMs rescues intratumor CD8+ T cell function. (A) Tumor growth of Hepa1-6 cells subcuta-
neously inoculated in Pdl1fl/fl and Pdl1ΔM mice. Tumor volumes on day 18 are shown. (B) Deletion of Pdl1 in myeloid cells
rescued IFN-γ and GzmB productions by intratumor CD8+ T cells. (C) Percentages of intratumor CD8+ T cells quantified
by FACS. Values are mean ± SEM of 2 independent experiments. *P < 0.05. **P < 0.005. n = 4 biological replicates per
group (A–C). Two-tailed Student’s t test (A–C).
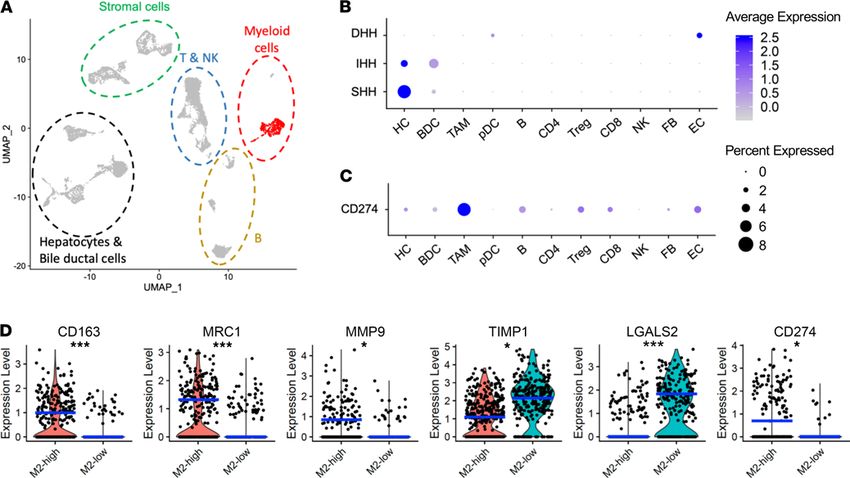
Human HCC scRNA sequencing revealed expression of PD-L1 in M2 TAMs. Last, we analyzed scRNA sequenc-
ing results of 19 human HCC and intrahepatic cholangiocarcinoma (IHCC) samples downloaded through
the National Center for Biotechnology Information’s Gene Expression Omnibus (GEO) to further query
the expression profiles of Hh pathway components and PD-L1 (32). The pipeline of scRNA sequencing
analysis has been described previously (33, 34). Briefly, we obtained scRNA transcriptomes of 9493 cells after
quality control steps and conducted normalization and principal component analysis (PCA) on the 3000
most variable genes. We then performed uniform manifold approximation and projection (UMAP) dimen-
sion reduction analysis, which revealed 24 unique clusters of cells annotated based on known cell lineage–
specific markers — including 6 clusters of hepatocytes (HC), 2 clusters of bile ductal cells (BDC), 2 clusters of
TAMs, 1 cluster of plasmacytoid dendritic cells (pDC), 3 clusters of B cells, 1 cluster of CD4+ cells, 1 cluster
of Foxp3+ T regulatory (Treg) cells, 2 clusters of CD8+ T cells, 1 cluster of natural killer (NK) cells, 2 clusters
of fibroblasts (FB), and 3 clusters of endothelial cells (EC; Figure 8A). Analyzing expressions of SHH, IHH,
and DHH across all clusters revealed that HCs are the main source of SHH (Figure 8B). More importantly,
PD-L1 (gene symbol: CD274) was mainly expressed in TAMs (Figure 8C), similar to what we have observed
in our mouse models. Further analysis of the TAM population revealed 2 distinctive groups — M2-high
and M2-low (Figure 8D). The M2-high group was characterized by higher expressions of CD163 (scavenger
receptor), MRC1 (CD206, mannose receptor), and MMP9, which are 3 genes associated with the TAM M2
phenotype (35). The M2-low group was defined by higher expressions of TIMP1 and LGALS2, which are
associated with antiangiogenic and proinflammatory functions of macrophages in humans (36, 37). PD-L1
expression was mainly found in the M2-high group, further suggesting that M2-polarized TAMs can contrib-
ute to intratumor immunosuppression through PD-L1 in human HCC and IHCC.
Discussion
In this study, we provided proof that TAM-derived PD-L1 expression is critical for suppressing intratumor
CD8+ T cell function in vivo. We further demonstrated that Hh signaling regulates PD-L1 expression in
TAMs and that tumor-derived Shh drives PD-L1 expression in TAMs to suppress tumor-infiltrating CD8+ T
cell effector function. Mechanistically, intracellular Hh signaling activated Stat3 to regulate PD-L1 expres-
sion in TAMs. Last, analysis of scRNA sequencing results of human HCC samples supported that PD-L1 is
mainly expressed on TAMs within the TME and that PD-L1 expression on TAMs is strongly correlated with
JCI Insight 2021;6(6):e146707 https://doi.org/10.1172/jci.insight.146707 6RESEARCH ARTICLE
Figure 5. Loss of Smo in myeloid cells interferes with PD-L1 expression in TAMs and promotes intratumor CD8+ T cell effector functions in vivo. (A)
SmoΔM intratumor CD8+ T cells produced higher levels of IFN-γ and GzmB than Smofl/fl TAMs as measured by flow cytometry. (B) Active Hh signaling in
TAMs resulted in upregulation of PD-L1 expression in subcutaneously inoculated Hepa1-6 tumors. (C) Expressions of IFN-γ and GzmB produced by intra-
tumor CD8+ T cells were elevated in SmoΔM compared with Smofl/fl in an autochthonous Mdr2–/– HCC model (F). (D) Active Hh signaling in TAMs resulted
in upregulation of PD-L1 expression in the Mdr2–/– HCC model. Values are mean ± SEM of a minimum of 3 independent experiments. **P < 0.005. ***P <
0.0005. n = 5 biological replicates per group (A–D). Two-tailed Student’s t test (A–D).
the M2-TAM phenotype. Thus, our findings identified an important and potentially novel role for paracrine
Hh signaling in promoting TAM PD-L1 expression mediated by Stat3, resulting in intratumor CD8+ T cell
dysfunction and increased immunosuppression within the TME.
Although IFN-γ–dependent PD-L1 upregulation on tumor cells was thought to mediate the suppres-
sion on intratumor CD8+ T cells in certain tumors (8), recent studies have suggested PD-L1 expression
was more frequently detected on immune cells than on malignant cells in HCC, non–small cell lung can-
cer, urothelial carcinoma, and esophageal squamous cell carcinoma (13–15). However, the precise role of
PD-L1 expression on TAMs in suppressing antitumor immunity required further investigation. Here using
conditional Pdl1-knockout mice, we found that TAM-derived PD-L1 upregulation is critical for suppressing
intratumor CD8+ T cell function, leading to tumor progression in vivo. In addition, tumor-derived PD-L1
expression was found to be low and noncontributory to intratumor CD8+ T cell suppression. This is consis-
tent with a recent report in HCC that tumor environmental factors induce PD-L1 expression on monocytes/
macrophages in the peritumor stroma, and high percentages of these PD-L1+ monocytes/macrophages are
correlated with disease progression and poor survival in patients (9). These previous studies prompted us to
create a conditional ready Pdl1 mouse model that allows us to knock out Pdl1 in myeloid cells. Using this
model, we were able to provide the first definitive proof to our knowledge that PD-L1 expression on TAMs
plays a more critical role in suppressing CD8+ T cell effector function than tumor-derived PD-L1. This model
will also be useful in elucidating the functions of PD-L1 in different cell populations and in various disease
processes. It also has important mechanistic and clinical implications as PD-L1 expression pattern may be
used to stratify patients for response to PD-1/PD-L1 treatments.
What then regulates the expression of PD-L1 in TAMs? A recent report highlighted that TAMs accumu-
late in PD-L1hi human HCC tumors and only few of these PD-L1hi samples displayed IFN-γhi signatures (38),
suggesting that there are IFN-γ-independent mechanisms regulating PD-L1 expression in TAMs. Here we
revealed that the Hh signaling pathway in TAMs is active and important for upregulation of PD-L1 expres-
sion, which has not been reported in previous literature to our knowledge. We also demonstrated that the Shh,
JCI Insight 2021;6(6):e146707 https://doi.org/10.1172/jci.insight.146707 7RESEARCH ARTICLE
Figure 6. Tumor-derived Shh ligand upregulates PD-L1 expression on TAMs to suppress intratumor CD8+ T cell functions in vivo. (A) Direct treatment
of BMDMs with Shh upregulated PD-L1 expression in vitro. (B) Activated CD8+ T cells cocultured with Pdl1fl/fl BMDMs at a 10:1 ratio in the presence of Shh
showed suppressed IFN-γ and GzmB production measured by FACS. PD-L1 expressions on TAMs were suppressed in Shh-knockout (Shh-KO) Hepa1-6 (C)
and LLC1 (E) tumors inoculated in C57BL/6 mice. Expressions of IFN-γ and GzmB produced by intratumor CD8+ T cells were decreased in Shh-WT Hepa1-6
(D) and LLC1 (F) tumors when compared with Shh-KO tumors inoculated in C57BL/6 mice. Values are mean ± SEM of a minimum of 3 independent experi-
ments. **P < 0.005. ***P < 0.0005. n = 5 biological replicates per group (A–F). Two-tailed Student’s t test (A, C–F). Two-way ANOVA (B).
produced by tumor cells, is responsible for driving the immunosuppressive phenotype of TAMs characterized
by high PD-L1 expression to facilitate its own immune evasion, suggesting the importance of communication
between tumor cells and TAMs to promote tumor growth. Together, our study not only revealed the impor-
tance of paracrine Hh signaling in modulating the TME to facilitate cancer progression but also identified
Shh as a potentially new upstream signaling cascade that regulates PD-L1 expression in TAMs.
How does Shh signaling pathway regulate the expression of PD-L1? Here we provide what we believe
is the first evidence to support that Shh pathway transcription factor Gli1 regulates Stat3 expression tran-
scriptionally. Consequently, Stat3 drives the downstream effects of Hh signaling in TAM PD-L1 upregu-
lation, eventually resulting in the functional suppression of CD8+ TILs. Stat3 is a key transcription factor
that mediates macrophage M2 polarization (39). Murine studies using a myeloid-specific Stat3-knockout
model demonstrated the antiinflammatory function of Stat3, characterized by impaired bactericidal activ-
ity and increased IL-10 production (40). In tumor studies with HCC, lung carcinoma, and melanoma,
it was also shown that inhibition of Stat3 in macrophages abrogated their M2 polarization and protu-
morigenic effects (41, 42). Furthermore, there is additional evidence indicating Stat3 can regulate the
expression of PD-L1 in various cell types (43, 44). Our finding is also consistent with a previous report
that PD-L1/2 overexpression was dependent on activation of Stat3 in TAMs in human lymphoma (45).
Collectively, our data revealed a potentially novel role for the Shh-Gli1-Stat3 signaling cascade in promot-
ing TAM-derived PD-L1 upregulation and intratumor immunosuppression. However, it remains to be
explored whether there is crosstalk between the IFN-γ and Shh pathways through Stat3 or other intracel-
lular mediators in driving PD-L1 expression in TAMs.
Our findings are clinically relevant because we have also shown in our analysis of scRNA sequencing
results that human HCC cells produce SHH and that PDL1 (CD274) expression is mainly found in TAMs.
A query of other human cancers using The Cancer Genome Atlas PanCancer studies revealed that, in
addition to HCC, colorectal carcinoma, renal cell carcinoma, pancreatic adenocarcinoma, gastric cancer,
JCI Insight 2021;6(6):e146707 https://doi.org/10.1172/jci.insight.146707 8RESEARCH ARTICLE
Figure 7. Hh-induced PD-L1 upregulation is mediated by Stat3. (A) Jun, Myc, Stat1, Stat3, and Nfkb1 mRNA levels in control and Shh-treated BMDMs were
measured by qRT-PCR. Expressions were normalized to β-actin (Actb) and compared with control. (B) Stat3 mRNA levels in Smofl/fl and SmoΔM TAMs were
measured by qRT-PCR. Expressions were normalized to reference gene Actb and compared to Smofl/fl. (C) Gli1 transcription factor was bound to the Stat3
promoter region in BMDMs treated by Shh as demonstrated by ChIP. Gli1 activity was inhibited using 5 μM GANT61. (D) Tumor volumes of Hepa1-6 hepatoma
cells subcutaneously inoculated in Smofl/fl, SmoCM, Stat3ΔM, and SmoCMStat3ΔM mice on day 20 at sacrifice. (E) Expressions of PD-L1 on TAMs were upregulat-
ed in SmoCM and decreased in Stat3ΔM and SmoCMStat3ΔM mice. (F) Productions of IFN-γ and GzmB by intratumor CD8+ T cells were suppressed in SmoCM and
higher in Stat3ΔM and SmoCMStat3ΔM mice. Values are mean ± SEM of a minimum of 3 independent experiments. *P < 0.05. **P < 0.005. ***P < 0.0005. n = 5
biological replicates per group (A and B, D–F). n = 3 technical replicates per group (C). Two-tailed Student’s t test (A and B). One-way ANOVA (D–F).
and cholangiocarcinoma were the highest SHH-expressing cancer types (46). This suggests an exciting ther-
apeutic potential of Hh inhibitors in treating a broad range of human cancers. Indeed, pharmacologic
inhibition of Hh signaling with small molecule inhibitors also showed effectiveness in reducing M2 polar-
ization and impressive synergism with immune checkpoint inhibitors in models of HCC and lung cancer in
our previous investigation (19). Further investigations are needed to translate this combinational strategy in
clinical trials in treating patients with Shh-expressing cancers.
In conclusion, we have identified a critical role for Shh in promoting PD-L1 upregulation on TAMs
and that TAM-derived PD-L1 in the TME of HCC is a major and important source for PD-L1/PD-1
axis–mediated suppression on intratumor CD8+ T cells. We further demonstrated that Shh-activated TAMs
signal through intracellular Stat3, which results in PD-L1 upregulation. Our findings are novel and could
potentially provide therapeutic insights in the development of novel chemotherapeutic and/or immuno-
therapeutic strategies for the treatment of HCC and other Shh-expressing human cancers.
Methods
Animals. Animals used in our studies were described previously (19). In addition, B6.129S1-Stat3tm1Xyfu/J
(Stat3fl/fl) was purchased from The Jackson Laboratory. Prior to arriving, Stat3fl/fl mice were backcrossed to
C57BL/6 mice in-house for at least 9 generations at The Jackson Laboratory. Backcrossed Stat3fl/fl mice were
crossed with LysM-cre mice to generate LysM-cre+Stat3fl/fl mice (referred to as Stat3ΔM in this paper) in pure
C57BL/6 background. Control mice were LysM-cre-Stat3fl/fl (referred to as Stat3fl/fl). LysM-cre+SmoCStat3fl/fl
(referred to as SmoCMStat3ΔM) mice were generated by crossing LysM-cre+Stat3fl/fl with Smo-M2C.
Generation of Pdl1fl/fl mice. A bacterial artificial chromosome clone containing the murine Pdl1 gene was
obtained from a mouse C57BL/6J library (Children’s Hospital Oakland Research Institute), and a targeting
vector was designed to flank exons 2 and 3 of the Pdl1 gene with LoxP sites in introns 1 and 3 as follows.
JCI Insight 2021;6(6):e146707 https://doi.org/10.1172/jci.insight.146707 9RESEARCH ARTICLE
Figure 8. Human HCC scRNA sequencing revealed expression of PD-L1 by M2 TAMs. (A) UMAP of 19 human HCC and IHCC scRNA sequencing results.
TAMs are highlighted in red within the myeloid cell population. (B) Hepatocytes (HC) highly express SHH as shown on dot plot. (C) TAMs are the dominant
contributor to CD274 (PD-L1) expression in human HCC and IHCC. (D) PCA of the TAM population revealed correlation between CD274 expression and M2
polarization status of TAMs as shown in violin plots. Blue line represents the median of each population. *P < 0.05. ***P < 0.0005. Two-tailed Student’s t
test (D). LGALS2, galectin-2; MMP9, matrix metallopeptidase 9; TIMP1, tissue inhibitor of metalloproteinases 1.
A Neor cassette flanked by 2 Frt sites was inserted downstream of exons 2 and 3. A 7.5 kb 5′ homology
region, a 1.3 kb 3′ homology region, and a 2.2 kb targeting region containing exons 2 and 3 were subcloned
into the PGKneoF2L2DTA vector (a gift from Philippe Soriano, Icahn School of Medicine at Mount Sinai,
New York, New York, USA; Addgene plasmid 13445; ref. 47). The construct was confirmed by Sanger
sequencing and then introduced into C57BL/6N-PRX-B6N embryonic stem (ES) cells (Primogenix). The
neomycin-resistant ES clones were screened for homologous recombinants using PCR primers flanking the
5′ and 3′ recombination sites. Positive clones were subsequently confirmed by Southern blot analysis after
restriction digest of genomic DNA with EcoRI and hybridization with a 32P-radioisotope–labeled probe
against a 772 bp sequence in the intron 3 region of the Pdl1 gene. ES cells from a confirmed clone were
eventually injected into blastocysts derived from C57BL/6 mice, and these blastocysts were transferred to
pseudopregnant C57BL/6 females. Chimeric offspring were identified by genotyping using PCR primers
flanking the 5′ and 3′ recombination sites. Mice heterozygous for the floxed Pdl1 allele were mated with
C57BL/6 mice for 1 additional generation to ensure germline transmission. Offspring from the additional
backcrossing were mated with mice expressing Cre under the control of the LysM promoter (LysM-cre) to
generate LysM-cre+Pdl1fl/fl (referred to as Pdl1ΔM).
Cell lines and reagents. Unless otherwise stated, all cell culture media were obtained from Corning.
Hepa1-6 (CRL-1830), LLC1 (CRL-1642), and 293T were obtained from the ATCC. Generation and con-
firmation of Hepa1-6 Shh-KO and LLC1 Shh-KO cell lines were described previously (19). Cell lines were
cultured in DMEM supplemented with 10% FBS, 100 IU/mL penicillin, and 100 IU/mL streptomycin.
TAMs and leukocytes collected from tumor samples were cultured in complete RPMI 1640 medium sup-
plemented with 10% FBS, 1 mM sodium pyruvate, 0.1 mM nonessential amino acids, 50 μM 2-ME, 2 mM
l-glutamine, 100 IU/mL penicillin, and 100 IU/mL streptomycin. Recombinant mouse Shh ligand for in
vitro treatment of macrophages was purchased from R&D Systems.
Generation of Pdl1-knockout cell lines using CRISPR/Cas9 technology. Synthesized guide RNA (gRNA)
oligonucleotides (Integrated DNA Technologies) were annealed and subcloned into lentiviral expression
JCI Insight 2021;6(6):e146707 https://doi.org/10.1172/jci.insight.146707 10RESEARCH ARTICLE
vector LentiCRISPR-v2 (a gift from Feng Zhang, MIT McGovern Institute, Cambridge, Massachusetts,
USA; Addgene plasmid 52961) for gRNA expression (48). Lentivirus was produced by triple transfection
of 293T cells with the gRNA expression LentiCRISPR-v2 vector and the packaging plasmids pCMV-
VSV-G (a gift from Robert Weinberg, MIT, Cambridge, Massachusetts, USA; Addgene plasmid 8454) and
pCMV-dR8.2 dvpr (a gift from Robert Weinberg; Addgene plasmid 8455) at a 1:1:2 ratio (49). Transfec-
tion was performed using Lipofectamine 3000 (Thermo Fisher Scientific) as recommended by the manu-
facturer. The viral supernatant was collected 48 hours following transfection and filtered through a 0.45
μm filter. Mouse hepatoma Hepa1-6 cells were transduced with lentivirus in the presence of 8 μg/mL
Polybrene (MilliporeSigma) for 6 hours. Five days after transduction, transduced cells were single-cell
diluted and grown in the presence of 0.8 mg/mL G418 (Thermo Fisher Scientific). Knockout status of
expanded single-cell clones was screened with qRT-PCR and confirmed by FACS staining for surface
PD-L1. Forward gRNA sequences for CRISPR/Cas9 knockout are as follows: Pdl1 gRNA1: 5′-CACCG-
GACCGTGGACACTACAATG-3′; Pdl1 gRNA2: 5′-CACCGGATGATCAGCTCCGCTGTG-3′; non-
targeting control: 5′-AAGTCTATGCGGGGCTCGTA-3′.
Tumor models. Hepa1-6 hepatoma or LLC1 lung carcinoma cells were injected subcutaneously into
each mouse in the right hind limb region in 100 μL HBSS with a 27-gauge needle syringe. For treatments,
beginning 14 days after injection of tumor cells, mice were injected intraperitoneally with 200 μL (200 μg/
mouse) anti–PD-L1 antibody (Bio X Cell) thrice weekly until humane endpoints were reached. Both male
and female mice were used. Mice were 6 to 8 weeks of age. There was no systematic means of randomiza-
tion of mice. Three-digit codes identified the mice, and the experiment was carried out blindly throughout.
To estimate the volume of the growing tumor mass, diameters of both the length (a) and the width (b) of
the mass were measured every 3–4 days, after which the tumor volume (V) was calculated according to the
formula V = ab2/2, as described previously (50). When experimental endpoints were met or when the longer
axis of each tumor was more than 20 mm in diameter, all the mice were euthanized according to the NIH
guidelines. Tumors were resected and transferred to 2 mL RPMI 1640 medium on ice. Tumor size (mm) was
measured with a ruler. The tumors from all experiments were then processed for FACS analysis or sorting on
the same day or frozen in O.C.T. Compound (VWR) for cryosectioning.
Preparation of single-cell suspensions from tumors. The isolation of TAMs and leukocytes was previously
described (19). Briefly, single-cell suspensions were obtained from tumor samples. Leukocytes were further
separated from contaminating tumor cells by centrifugation over a 40%–75% Ficoll-Paque (Life Technol-
ogies, Thermo Fisher Scientific) gradient at 600g for 30 minutes at room temperature. For sorting TAMs,
Ficoll-enriched leukocytes were stained with anti-F4/80, anti-CD11b, anti-Ly6G (1A8, BioLegend), and
anti-Ly6C (HK1.4, BioLegend) antibodies and purified by FACS for F4/80+CD11b+Ly6G–Ly6C– cells.
For sorting CD8+ TILs, Ficoll-enriched leukocytes were stained with anti-CD4 and anti-CD8 antibodies
and purified by FACS sorting for CD8+CD4– cells.
Isolation of BMDMs. To prepare macrophages, mice were sacrificed and disinfected with 70% ethanol. Both
lower extremities were excised, and the long bones — femur and tibia — were separated from muscular layers
and placed in RPMI medium. To extract BMDMs, 10 mL RPMI medium was used to flush out each bone
using a 25-gauge needle, and cells were gently dissociated by pipetting. A 70 μm nylon BD Falcon cell strainer
was placed atop a 50 mL BD Falcon tube, and the suspension was filtered into the 50 mL tube. The resultant
suspension was centrifuged at 300g for 5 minutes. The supernatant was then aspirated. ACK lysis buffer (5
mL) was then added, and the contents were incubated for 2 minutes at room temperature. To quench the lysis
reaction, 10 mL RPMI was added. The content was then centrifuged at 300g, and the cells were washed 2 addi-
tional times with 1× HBSS. The cells were plated at 1 × 10⁶ cells per well in a sterile 6-well tissue culture plate
in 2 mL BMDM culture medium plus 10 ng/mL M-CSF to obtain mature BMDMs. On day 2, supernatants
were aspirated and replenished with fresh culture medium with M-CSF. On day 5, 2 mL fresh culture medium
with M-CSF was added. Purity of the BMDMs (>95% F4/80+ cells) was confirmed by flow cytometry.
In vitro coculturing of BMDMs and CD8+ T cells. CD8+ T cells were purified from C57BL/6 mouse spleens
and cocultured with mature Pdl1fl/fl and Pdl1ΔM BMDMs with or without 5 ng/mL Shh ligands in the pres-
ence of 2 μg/mL CD3e and CD28 antibodies (BD Pharmingen clones 145-2C11 and 37.51, respectively) at
different ratios and different time points (6, 12, 24, and 48 hours). Data shown here were obtained from the
optimal conditions of 10:1 T cell/BMDM ratio and 24-hour coculture period.
Antibodies and flow cytometry analysis. Anti-F4/80-PE (BM8), CD4-PE (GK1.5), CD8a-PE-Cy5 (53-
6.7), PDL1-APC (10F.9G2), IFNγ-APC (XMG1.2), APC Rat IgG2bκ isotype (RTK4530), and APC Rat
JCI Insight 2021;6(6):e146707 https://doi.org/10.1172/jci.insight.146707 11RESEARCH ARTICLE
IgG1κ isotype (RTK2071) antibodies were purchased from BioLegend. CD11b-PE-Cy5 (M1/70), GzmB-
FITC (NGZB), and FITC Rat IgG2aκ isotype (eBR2a) were purchased from eBioscience, Thermo Fish-
er Scientific. Titration was used to determine the optimal concentration of each antibody prior to each
experiment. Cell suspensions were stained with relevant antibodies at 4°C for 15 minutes in PBS with 2%
heat-inactivated FBS and 0.1% sodium azide, washed twice, and analyzed with a FACSCanto flow cytom-
eter (BD Biosciences) using FlowJo Software (Tree Star).
Intracellular cytokine staining. CD8+ T cells were restimulated with 2 μg/mL CD3e and CD28 antibodies
for 6 hours in the presence of 5 μg/mL brefeldin A (Invitrogen, Thermo Fisher Scientific). After staining
with cell surface markers, the cells were fixed and permeabilized with Cytoperm/Cytofix kit (BD Biosci-
ences) for 20 minutes and incubated with anti-IFNγ-APC and anti-GzmB-FITC antibodies for 45 minutes.
The cells were washed twice with perm buffer and analyzed with FACSCanto flow cytometer.
Quantitative real-time PCR. Procedures for qRT-PCR were previously described (19). Briefly, total
RNA was isolated from sorted cells using TRIzol reagent (Invitrogen, Thermo Fisher Scientific). Reverse
transcription was performed with the Superscript First-Strand Synthesis System (Promega). The cDNA
samples were diluted 1:10 in water and analyzed in duplicate using SYBR Green Real-Time PCR Mas-
ter Mixes (Bio-Rad). SYBR green PCR conditions were 1 cycle of 50°C for 2 minutes, 1 cycle of 95°C
for 10 minutes, and 40 cycles of 95°C for 15 seconds, 60°C for 60 seconds by a model CFX96 Touch
Real-Time PCR Detection System (Bio-Rad). Relative gene expression levels of each respective gene were
calculated using the threshold cycle (2-ΔΔCT) method and normalized to Actb (51). Primer sequences for
the following mouse genes are listed: Pdl1 forward: 5′-GCATTATATTCACAGCCTGC-3′; Pdl1 reverse:
5′-CCCTTCAAAAGCTGGTCCTT-3′; Jun forward: 5′-ACGACCTTCTACGACGATGC-3′; Jun reverse:
5′-CCAGGTTCAAGGTCATGCTC-3′; Myc forward: 5′-TACCCTCTCAACGACAGCAG-3′; Myc reverse:
5′-TCTTGACATTCTCCTCGGTG-3′; Stat1 forward: 5′-GATCTCTAACGTCTGTCAGCTG-3′; Stat1
reverse: 5′-GAGGTCCAGGAT TCCTTCGATC-3′; Stat3 forward: 5′-GGATCGCTGAGGTACAACCC-3′;
Stat3 reverse: 5′-GTCAGGGGTCTCGACTGTCT-3′; Nfkb1 forward: 5′-GAAATTCCTGATCCAGA-
CAAAAAC-3′; Nfkb1 reverse: 5′-ATCACTTCAATGGCCTCTGTGTAG-3′; Actb forward: 5′-GGTCCA-
CACCCGCCACCAG-3′; Actb reverse: 5′-CACATGCCGGAGCCGTTGTC-3′.
Chromatin immunoprecipitation. ChIP assays were performed as previously described (19). Briefly, 1
× 107 cells were untreated, treated with 5 ng/mL Shh, or treated with 5 ng/mL Shh + 5 μM GANT61
for 24 hours prior to cross-linking for 10 minutes with 1% formaldehyde. Antibody recognizing Gli1
was purchased from Novus Biologicals. Normal rabbit IgG (Cell Signaling Technology) was used as
negative control. Stat3 promoter quantitative PCR was performed with the specific primers flanking
the Gli1-binding site (sense: 5′-TGCACGTTTTTCTGCACAAGG-3′; antisense: 5′-AGTTCAAGTTC-
CAGCATCCCA-3′). PCR products were analyzed with agarose gel electrophoresis.
Histology and imaging. Cryostat sections (10 μm) were dried, fixed in cold acetone, and incubated
for 30 minutes in blocking buffer (10% goat or rabbit serum in PBS). Slides were then incubated with
anti-F4/80–Alexa Fluor 647 (BM8; BioLegend) and anti–PD-L1–Alexa Fluor 488 (MIH5; eBioscience,
Thermo Fisher Scientific) in 2% serum in PBS at room temperature in humidity chamber for 30 min-
utes. After washing 3 times with 2% serum diluted in PBS each for 5 minutes, nuclei were stained with
100 ng/mL Hoechst in PBS and incubated for 15 minutes at room temperature in the dark. Slides were
washed 2 times with PBS, mounted with Fluoromount (Southern Biotech), and imaged on a Nikon C2
confocal microscope. Then 405 nm, 488 nm, and 647 nm lasers were used to excite Hoechst-labeled,
Alexa Fluor 488–labeled, and Alexa Fluor 647–labeled antigens, respectively. Sequential acquisitions
of the multicolor images were used to avoid crossexcitation, and images were overlaid with the Nikon
NIS-Element Confocal Microscope Imaging Software.
Single-cell RNA sequencing data analysis. The 10x Genomics data set of 19 patient samples of HCC and
IHCC were downloaded from GEO (GEO accession GSE125449; ref. 32). Samples were analyzed using
Seurat package (version 3.1.1) in R (version 3.6.1) to perform data filtering, normalization, PCA, and
UMAP. The standard pipeline of scRNA sequencing analysis was previously reported and slightly modi-
fied to fit our analysis (33). Briefly, quality control metrics were used to select cells with mitochondrial gene
percentage less than 10% and at least 200 genes detected. The total number of transcripts in each single cell
was normalized followed by log transformation. The 3000 most variable genes were further subjected to
data scaling and centering. Those variable genes were then used for PCA. The first 30 PCs were applied for
UMAP analysis. Data were visualized using ggplot2 (version 3.2.1) in R.
JCI Insight 2021;6(6):e146707 https://doi.org/10.1172/jci.insight.146707 12RESEARCH ARTICLE
Statistics. Results are expressed as mean ± SEM. Comparison between groups was performed by Kru-
skal-Wallis, Wilcoxon-Mann-Whitney, 1- and 2-way ANOVA, and 2-tailed Student’s t test. All statistical
analyses were performed with JMP Version 12 software (SAS Software). P values of less than 0.05 were
considered significant.
Study approval. All animal experiments were performed in agreement with the protocols approved by
the Institutional Animal Care and Use Committee of Duke University, Durham, North Carolina, USA,
and The Ohio State University, Columbus, Ohio, USA.
Author contributions
AJP designed and performed the experiments, analyzed the data, and wrote the manuscript. RD assisted
with performing the experiments and contributed essential ideas and discussion. RL, DMB, RAB, ZL, and
XH participated in designing various parts of the study and in discussion and interpretation of the results.
YY assisted with designing the experiments, supervised the work, and wrote the manuscript.
Acknowledgments
This work was supported by NIH grants CA136934, CA186973, and CA193167 (to YY). AJP is supported
by an NIH predoctoral fellowship CA213799. The authors thank the Transgenic and Knockout Mouse
core facility at the Duke Cancer Institute for their assistance and expertise in generating the conditional
knockout mouse model. The generation of this mouse model is partially supported by the Duke School of
Medicine core facility voucher grant (voucher 1162).
Address correspondence to: Yiping Yang, The Ohio State University, 508 BRT, 460 W. 12th Avenue, Colum-
bus, Ohio 43210, USA. Phone: 614.685.0638; Email: yiping.yang2@osumc.edu.
1. Dong H, et al. Tumor-associated B7-H1 promotes T-cell apoptosis: a potential mechanism of immune evasion. Nat Med. 2002;8(8):793–800.
2. Iwai Y, et al. Involvement of PD-L1 on tumor cells in the escape from host immune system and tumor immunotherapy by PD-L1
blockade. Proc Natl Acad Sci U S A. 2002;99(19):12293–12297.
3. Topalian SL, et al. Safety, activity, and immune correlates of anti-PD-1 antibody in cancer. N Engl J Med. 2012;366(26):2443–2454.
4. Brahmer JR, et al. Safety and activity of anti–PD-L1 antibody in patients with advanced cancer. N Engl J Med. 2012;366(26):2455–2465.
5. Borghaei H, et al. Nivolumab versus docetaxel in advanced nonsquamous non-small-cell lung cancer. N Engl J Med. 2015;373(17):1627–1639.
6. Garon EB, et al. Pembrolizumab for the treatment of non-small-cell lung cancer. N Engl J Med. 2015;372(21):2018–2028.
7. Keir ME, et al. PD-1 and its ligands in tolerance and immunity. Annu Rev Immunol. 2008;26:677–704.
8. Topalian SL, et al. Immune checkpoint blockade: a common denominator approach to cancer therapy. Cancer Cell. 2015;27(4):450–461.
9. Kuang DM, et al. Activated monocytes in peritumoral stroma of hepatocellular carcinoma foster immune privilege and disease
progression through PD-L1. J Exp Med. 2009;206(6):1327–1337.
10. Lin H, et al. Host expression of PD-L1 determines efficacy of PD-L1 pathway blockade-mediated tumor regression. J Clin Invest.
2018;128(2):805–815.
11. Tang H, et al. PD-L1 on host cells is essential for PD-L1 blockade-mediated tumor regression. J Clin Invest. 2018;128(2):580–588.
12. Noguchi T, et al. Temporally distinct PD-L1 expression by tumor and host cells contributes to immune escape. Cancer Immunol Res.
2017;5(2):106–117.
13. Lu LC, et al. Increased expression of programmed death-ligand 1 in infiltrating immune cells in hepatocellular carcinoma tissues
after sorafenib treatment. Liver Cancer. 2019;8(2):110–120.
14. Bellmunt J, et al. Association of PD-L1 expression on tumor-infiltrating mononuclear cells and overall survival in patients with
urothelial carcinoma. Ann Oncol. 2015;26(4):812–817.
15. Hatogai K, et al. Comprehensive immunohistochemical analysis of tumor microenvironment immune status in esophageal
squamous cell carcinoma. Oncotarget. 2016;7(30):47252–47264.
16. Clausen BE, et al. Conditional gene targeting in macrophages and granulocytes using LysMcre mice. Transgenic Res. 1999;8(4):265–277.
17. Amakye D, et al. Unraveling the therapeutic potential of the Hedgehog pathway in cancer. Nat Med. 2013;19(11):1410–1422.
18. Briscoe J, Therond PP. The mechanisms of Hedgehog signalling and its roles in development and disease. Nat Rev Mol Cell Biol.
2013;14(7):416–429.
19. Petty AJ, et al. Hedgehog signaling promotes tumor-associated macrophage polarization to suppress intratumoral CD8+ T cell
recruitment. J Clin Invest. 2019;129(12):5151–5162.
20. Gabrusiewicz K, et al. Glioblastoma stem cell-derived exosomes induce M2 macrophages and PD-L1 expression on human
monocytes. Oncoimmunology. 2018;7(4):e1412909.
21. Madonna G, et al. PD-L1 expression with immune-infiltrate evaluation and outcome prediction in melanoma patients treated
with ipilimumab. Oncoimmunology. 2018;7(12):e1405206.
22. Sumitomo R, et al. PD-L1 expression on tumor-infiltrating immune cells is highly associated with M2 TAM and aggressive
malignant potential in patients with resected non-small cell lung cancer. Lung Cancer. 2019;136:136–144.
23. Harada K, et al. Tumor-associated macrophage infiltration is highly associated with PD-L1 expression in gastric adenocarcinoma.
Gastric Cancer. 2018;21(1):31–40.
24. Cong L, et al. Multiplex genome engineering using CRISPR/Cas systems. Science. 2013;339(6121):819–823.
JCI Insight 2021;6(6):e146707 https://doi.org/10.1172/jci.insight.146707 13RESEARCH ARTICLE
25. Mauad TH, et al. Mice with homozygous disruption of the mdr2 P-glycoprotein gene. A novel animal model for studies
of nonsuppurative inflammatory cholangitis and hepatocarcinogenesis. Am J Pathol. 1994;145(5):1237–1245.
26. Katzenellenbogen M, et al. Molecular mechanisms of liver carcinogenesis in the mdr2-knockout mice. Mol Cancer Res.
2007;5(11):1159–1170.
27. Zerdes I, et al. Genetic, transcriptional and post-translational regulation of the programmed death protein ligand 1 in cancer:
biology and clinical correlations. Oncogene. 2018;37(34):4639–4661.
28. Hooper JE, Scott MP. Communicating with Hedgehogs. Nat Rev Mol Cell Biol. 2005;6(4):306–317.
29. Lauth M, et al. Inhibition of GLI-mediated transcription and tumor cell growth by small-molecule antagonists. Proc Natl Acad
Sci U S A. 2007;104(20):8455–8460.
30. Jeong J, et al. Hedgehog signaling in the neural crest cells regulates the patterning and growth of facial primordia. Genes Dev.
2004;18(8):937–951.
31. Moh A, et al. Role of STAT3 in liver regeneration: survival, DNA synthesis, inflammatory reaction and liver mass recovery.
Lab Invest. 2007;87(10):1018–1028.
32. Ma L, et al. Tumor cell biodiversity drives microenvironmental reprogramming in liver cancer. Cancer Cell. 2019;36(4):418–430.
33. Butler A, et al. Integrating single-cell transcriptomic data across different conditions, technologies, and species. Nat Biotechnol.
2018;36(5):411–420.
34. Stuart T, et al. Comprehensive integration of single-cell data. Cell. 2019;177(7):1888–1902.
35. Noy R, Pollard JW. Tumor-associated macrophages: from mechanisms to therapy. Immunity. 2014;41(1):49–61.
36. Zajac E, et al. Angiogenic capacity of M1- and M2-polarized macrophages is determined by the levels of TIMP-1 complexed
with their secreted proMMP-9. Blood. 2013;122(25):4054–4067.
37. Yildirim C, et al. Galectin-2 induces a proinflammatory, anti-arteriogenic phenotype in monocytes and macrophages. PLoS One.
2015;10(4):e0124347.
38. Wei Y, et al. The local immune landscape determines tumor PD-L1 heterogeneity and sensitivity to therapy. J Clin Invest.
2019;129(8):3347–3360.
39. Sica A, Mantovani A. Macrophage plasticity and polarization: in vivo veritas. J Clin Invest. 2012;122(3):787–795.
40. Bode JG, et al. The macrophage response towards LPS and its control through the p38(MAPK)-STAT3 axis. Cell Signal.
2012;24(6):1185–1194.
41. Yin Z, et al. IL-6/STAT3 pathway intermediates M1/M2 macrophage polarization during the development of hepatocellular
carcinoma. J Cell Biochem. 2018;119(11):9419–9432.
42. Giurisato E, et al. Myeloid ERK5 deficiency suppresses tumor growth by blocking protumor macrophage polarization via STAT3
inhibition. Proc Natl Acad Sci U S A. 2018;115(12):E2801–E2810.
43. Song TL, et al. Oncogenic activation of the STAT3 pathway drives PD-L1 expression in natural killer/T-cell lymphoma. Blood.
2018;132(11):1146–1158.
44. Garcia-Diaz A, et al. Interferon receptor signaling pathways regulating PD-L1 and PD-L2 expression. Cell Rep. 2019;29(11):3766.
45. Horlad H, et al. An IL-27/Stat3 axis induces expression of programmed cell death 1 ligands (PD-L1/2) on infiltrating macrophages
in lymphoma. Cancer Sci. 2016;107(11):1696–1704.
46. Cerami E, et al. The cBio cancer genomics portal: an open platform for exploring multidimensional cancer genomics data.
Cancer Discov. 2012;2(5):401–404.
47. Hoch RV, Soriano P. Context-specific requirements for Fgfr1 signaling through Frs2 and Frs3 during mouse development. Development.
2006;133(4):663–673.
48. Sanjana NE, et al. Improved vectors and genome-wide libraries for CRISPR screening. Nat Methods. 2014;11(8):783–784.
49. Stewart SA, et al. Lentivirus-delivered stable gene silencing by RNAi in primary cells. RNA. 2003;9(4):493–501.
50. Faustino-Rocha A, et al. Estimation of rat mammary tumor volume using caliper and ultrasonography measurements. Lab Anim (NY).
2013;42(6):217–224.
51. Livak KJ, Schmittgen TD. Analysis of relative gene expression data using real-time quantitative PCR and the 2(-Delta Delta
C(T)) Method. Methods. 2001;25(4):402–408.
JCI Insight 2021;6(6):e146707 https://doi.org/10.1172/jci.insight.146707 14You can also read