Retail Carbon Footprints: Measuring Impacts from Real Estate and Technology - MIT
←
→
Page content transcription
If your browser does not render page correctly, please read the page content below

Retail Carbon
Footprints:
Measuring
Impacts from
Real Estate and
Technology
2

CARBON FOOTPRINTS AND RETAIL BEHAVIORS
OF CONSUMERS

21st century consumers face unprecedented
choice when purchasing goods and services. A
                                                   “Our goal is to
growing body of research has been investigating    understand the carbon
what impact consumer choices have on carbon
use, GhG emissions, and climate change. The
                                                   footprints of consumer
research has a shared concensus, consumer          retail behavior. As the
decisions are carbon emitting. However, some
consumer decisions, choices by logistics and
                                                   purchase and delivery
supply chain providers, transportation and even    of goods has expanded
technological solutions contribute to more GhG
emissions than less.
                                                   to include numerous
                                                   channels, we want to
As a real estate group, our goal was to focus on
how real estate, urban planning and technology
                                                   measure the role of real
impacts the total GhG emissions that a retail      estate, transportation,
consumer initiates when they make a purchase.
We present in our research where all decision
                                                   and technology. The
makers can make a contribution to minimize         objective is to help
the carbon footprint from their business and
retail behaviors.
                                                   those involved in the
                                                   supply, delivery, and
                                                   reception of goods
                                                   to minimize carbon
                                                   footprints.”

                                                   DR. ANDREA CHEGUT
                                                   MIT REAL ESTATE INNOVATION LAB

                                                                                    3
WHICH RETAIL STRATEGY PROVIDES THE LOWEST
GHG EMISSIONS OUTPUT?

Over the last quarter of a century, no asset class
in real estate has seen more transformation
than the retail sector, due to advances in
technology, innovations in the supply chain and
ever-advancing changes in consumer behavior.
Where once consumers flocked to suburban
shopping malls and the brick-and-mortar stores
of city streets, ecommerce - combined with
next-day delivery capability - has completely
altered how we purchase all forms of goods.
Coinciding with this transformation, climate
change across the globe has now reached
a point where it is unquestionably impacting
our environment, economy and resiliency as a
society. The question we must now ask is which
of these forms of consumer behavior leads to
lower carbon emissions, and is better for the
world in which we live. This analytical study
aims to investigate and measure consumers’
Greenhouse Gas (GhG) emissions while
engaging in either ecommerce purchasing or
the more traditional purchasing from brick-and-
mortar stores.

Identification Strategy
Our study began by reviewing previous research
conducted in this area and focused on the major
factors that have had the most impact on carbon
emissions, such as transportation. However,
as the retail ecosystem has expanded, it has
become clear that there are numerous other
factors that are having a major impact on GhG
emission levels. These include the real estate
footprint of buildings, logistical systems, the
production of packaging and boxes, and new
technologies.

                                                     4
PRECEDENT STUDIES

The question of which system has a greater impact on GhG emissions has led to research on how
these different types of retail behaviors are impacting GhG emissions, and numerous articles and
publications have been generated in recent years. Previous research takes into account various
assumptions about consumer behavior, the logistics ecosystem and consumer transport. Notably,
these studies suggest that carbon emissions are generally lower for consumer retail strategies
that engage in ecommerce. Our goal within this study is to dig further into these findings, expand
on previous assumptions and introduce a number of increasingly significant factors.

       Author           Country        Year                 Title                             Findings
                          and        Published
                       Institution
       Weideli           United        2012      Environmental analysis of us     ‘pure players’ of ecommerce have
                         states,                       online shopping             fewer emissions on average that
                         France                                                      hybrid models with in-person
                                                                                         shopping trips by car
                        MIT, EPFL
    Blanco, Sheffi       United        2017            Green Logistics           Presents a systematic methodology
                         States,                                                for measuring carbon footprint impact.
                           MIT
        Blanco           United        2017      Estimating the CO2 intensity   Suggests employing public transport
                         States,                     of intermodal freight        infrastructure for logistics parcel
                                                         transportation                        delivery.
                           MIT
    Pineda Blanco        United        2018      Changes in Online Shopping       Determines that a specific sector
                         States,                  Behavior During the Last         of the population is more drawn
                                                          Decade                 towards online shopping. Presents
                        UC Davis                                                   relationships between shopper
                                                                                           characteristics.
       Prologis          United        2018       The Modern Supply Chain:        Framework for determining the
                         States,                  A New Model for Defining      development criteria of new last-mile
                                                    Logistics Real Estate                  properties.
                         Prologis
                        Research
       He et. al.       PR China,      2019        Product carbon footprint       Presents a comprehensive study
                                                  across sustainable supply         of the constituent parts of the
                        Shanghai                            chain                supply chain and how to make a full
                        University                                                           assessment.
  Shahmohammadi,         United        2020       Comparative Greenhouse        Analyzes data from multiple countries
   Van Loon, et. al.     States,                  Gas Footprinting of Online     to determine that e-commerce is not
                                                 versus Traditional Shopping    always the least carbon-intensive form
                         ES&T                    for Fast-Moving Consumer                      of retail.
                        Magazine                     Goods: A Stochastic
                                                          Approach
Table 1. Precedent Studies.

                                                                                                                         5
“The question is not whether
ecommerce or brick-and-mortar retail
is better or worse for GHG emissions.
It is more about what decisions
consumers, retailers, ecommerce
and logistics stakeholders can make
to minimize GHG emissions. There is
something that everyone in the supply
chain can do to help mitigate climate
change.”
                  JAMES SCOTT
                  MIT REAL ESTATE INNOVATION LAB

                                                   6
RESEARCH APPROACH

                What are the Carbon Footprints of Consumer
                Retail Strategies

     Does the carbon         How can various             Are there             What proportion
     footprint vary over     interventions               conditional           of carbon
     e-commerce,             reduce carbon               strategies where      footprint comes
     brick-and-mortar,       footprints?                 ecommerce and         from real estate,
     and hybrid retail                                   brick-and-mortar      transportation,
     strategies?                                         result in different   logistics and
                                                         emissions?            consumers?

As outlined, this study aims to measure the          •     Are there conditional strategies where
carbon footprint of consumer behaviors in                  ecommerce and brick-and-mortar result in
ecommerce by assembling the relevant                       different emissions?
variables and then simulating scenarios where        •     What proportion of our carbon footprint
a range of parameters can be modified. To                  comes from real estate, transportation,
aid in this research, a Monte Carlo simulation             logistics and consumers?
was executed using 10,000 trials to produce
measurable results which were then plotted for For the purpose of establishing a measurable
analysis to illustrate which strategy produced framework, and to help look at the big picture
                                               of the supply chain while getting a better
the lowest GHG emissions. In total, we did close
                                               understanding of the carbon footprint of each
to 48 different simulations for a total of 480,000
                                               fulfilled order, we also developed a system map
trials. Furthermore, it gave us the opportunity to
construct opinions on which solutions have the taking into account the logistics, consumer, real
greatest chance to succeed in this context.    estate, packaging and transportation elements
                                               of the process. Finally, it should also be noted
In order to help focus our research we also that we focused primarily on the aspects of the
constructed four essential questions which we final part of the supply chain, or the last-mile
aimed to answer in the course of our analysis: portion of the overall process, as this is the
                                               most distinct and where the true differences
• Does the carbon footprint vary over          between traditional purchasing and ecommerce
   ecommerce, brick-and-mortar and hybrid      purchasing happen.
   retail strategies?
• How can various interventions reduce
   carbon footprints?

                                                                                                      7
BREAKING DOWN FURTHER RETAIL CARBON
FOOTPRINT
          Port
                                                                               Traditional Retail Returns

  Start

Consolidation                               Distribution              Retail
  Facility                                    Center                  Store

                                                                                        Customer Address

                                                                                         End                Start
                   Regional                 Last-Touch
                  Distribution                Facility

                 (Non-Coastal)
                                              Returns
                                              Facility          End              Ecommerce Returns

   Ecommerce           Traditional Retail   Both Channels

Fig 1. Retail Supply Chain Model: Brick-and-Mortar and Ecommerce.

Retail Supply Chain Model: Sources of Emissions

The port facility serves as a placeholder title             property called a Regional Distribution Center.
for the origin of the product. The product then
begins its trip through the supply chain by         In the traditional retail channel, once items have
traveling to the Consolidation Center, which is the left the Consolidation Facility, they arrive at a
first layer of property, common to all channels.    Distribution Center and are then shipped to the
                                                    Retail Store, where individual shoppers head to
The path then forks for both channels. In the in order to pick up the product and bring home,
ecommerce channel, the next step for the traveling in a vehicle of their own choosing.
parcel becomes the Last-Mile facility, where
the product is handled for the final time before Beginning at the customer address in all retail
getting shipped to the end customer address. In channels, the returns are sent back to an alternate
the non-coastal state markets (these are, as the distribution center or retail store, depending on
name implies, states without direct access to the channel. Reverse logistics GhG emissions
either the Pacific or Atlantic oceans), the product are conceptualized.
passes through one additional preceding

                                                                                                                    8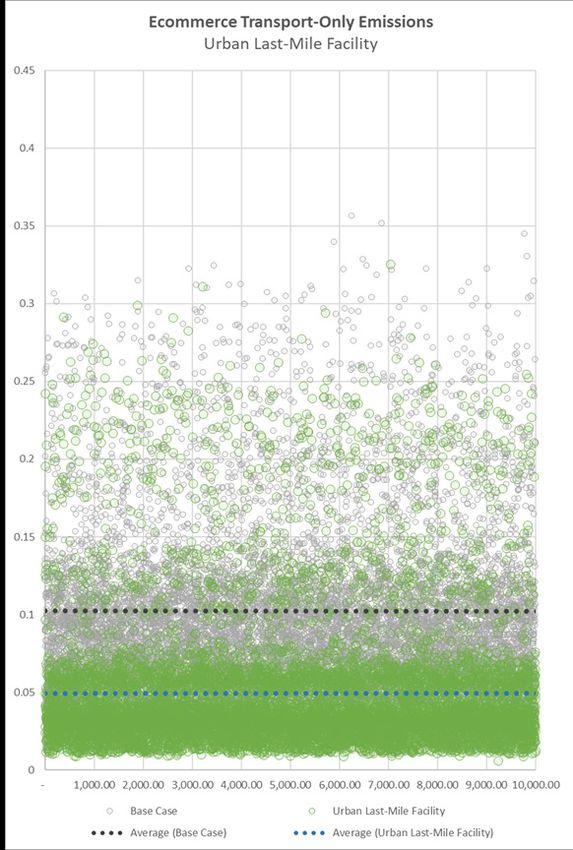
ASSESSING CARBON FOOTPRINTS

                                        Logistics Leg

                                        Consumer and
                                          Product

                                                                                                                       LAST MILE
      Real Estate                      Transportation                     Packaging

                                         Aggregation

                                                                Note: our unit
                                   Carbon Footprint per         of interest for
                                                                                                               Delivery
                                      Order Fulfilled           understanding
                                                                carbon footprints

Fig 2. Model of Carbon Footprints per order.

While this analysis found similar conclusions           trips per annum1, and these individual trips are
to previous studies, the research showcases             unable to consolidate enough to compete with
how important the role of real estate and, more         the reduction of carbon emissions that the
importantly, its location is in helping mitigate        e-commerce system brings. It is also important
consumers’ GhG emissions. We illustrate                 to remember there is another layer of complexity
that when consumers increase the number                 when factoring in that consumers can make
of their purchases - whether by isolating               specific choices that impact their own GhG
household shopping trips into one large trip            emission footprint.
to gather as many goods as possible in one
pickup, or by consolidating many purchases
into the e-commerce logistics ecosystem -
there is a principal of scale that consumers
are tapping into. However, consumer behavior
does not generally work this way. The average
U.S. consumer makes at least 300 shopping
                                                        1. Statista. (n.d.). Consumers’ weekly grocery shopping trips in the
                                                           United States from 2006 to 2019. Retrieved January 2021, from
                                                           https://www.statista.com/statistics/251728/weekly-number-of-us-
                                                           grocery-shopping-trips-per-household/

                                                                                                                                   9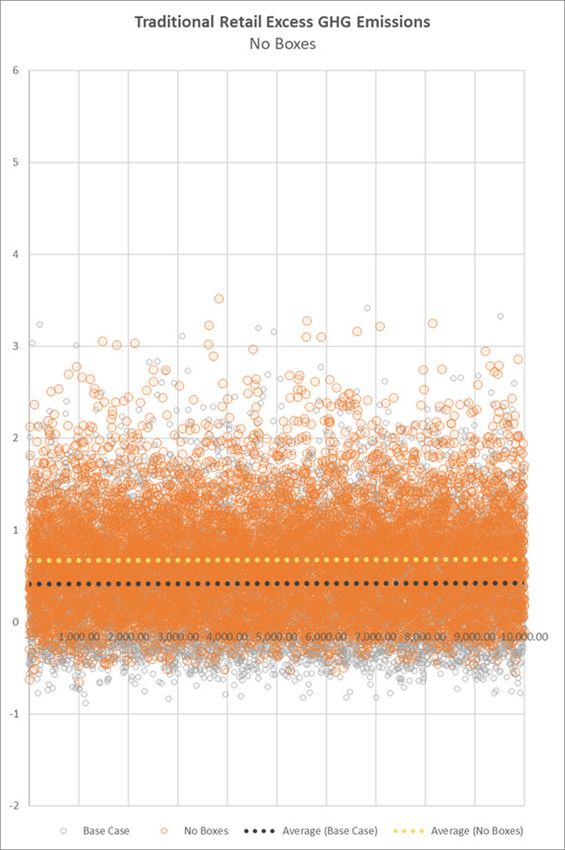
“In traditional brick-and-mortar,
ecommerce, and combined retail
strategies, boxes account for some
of the largest carbon pollutants in the
ecosystem.”
                           DIEGO FERNÁNDEZ BRISEÑO
                    MIT REAL ESTATE INNOVATION LAB

                                                     10
SIMPLE MODEL Ecommerce Average Emissions by
Sources
2%
KgCO2e / Item
15%
25%
13%
45%
Traditional Retail Average Emissions
by Sources
1%
7%
4%
18%
Trials
Fig 3. GHG Emissions by Brick-and-Mortar vs. Ecommerce.
70%
Base Case Scenario
The primary findings are shown on the base
case simulation results, which will be used as
a benchmark to compare the different interven-
tions’ impact. By using our standard method of
subtracting ecommerce values from traditional Return Rates Logistics Leg
retail ones, the marginal results range from a Excedent
maximum of 3.400 kgCO2e/product to a mini- Transport-Level Packaging-Level
mum of 0.880 kgCO2e/product. These are the Emissions Emissions
extremes. However, the mean sits closer to Property-Level
0.440, which is where a large concentration of Emissions
the trials are.
Fig 4. GHG emissions Breakdown by Sources.
11KgCO2e / Item KgCO2e / Item
Fig 5. Breakdown of Carbon Footprints by Ecommerce and Brick-and-Mortar Retail.
The figures above illustrate the leading factors of GhG emissions for both ecommerce and brick-
and-mortar retail. For ecommerce, property-level emissions are the greatest contributor to overall
emissions, while transport-level emissions contribute the most significantly in traditional retail.
12INTERVENTIONS IN THE SIMULATION:
WAYS TO DECREASE THE CARBON FOOTPRINT
“Location, “Nudge the
“Change the Tech” “Shift the Scale”
Location, Location” Behavior”
Optimize real estate Technological What becomes the Investing in
location selection change will have largest efficiency is technology that
and urban planning an impact for both changing the scale disrupts the
permitting to limit consumers and of goods that can be existing modes off
GHG emissions firms as they switch delivered or brought delivery will help
for supply chain out their technology. at one time. the system remove
operations. carbon emissions
substantially.
Technology can help reduce the carbon Packages and Returns contribute to GhG
footprint emissions
In the coming years, we will see a number of new Furthermore, we’ve established that some
technologies being developed and deployed to of the greatest investments we can make in
help lower GhG emissions. Among these are limiting our GhG emissions are in respect to
electric fleets, drones and autonomous vehicles. how packages are boxed or returned to stores.
In both traditional e-commerce and combined
However, these technological advances will not
retail strategies, boxes account for some of the
be a solution until frictions in the ecosystem are
largest carbon pollutants in the ecosystem.
fundamentally addressed. For example, drones Removing layers of packaging, changing
may help with rural delivery carbon emissions, boxing dimensions to be more efficient, or
but in the meantime existing carrier services even removing boxes altogether can reduce
such as the U.S. Post Office already provide an carbon emissions by up to 36% percent.
invaluable service of delivery packages every Moreover, free returns have led consumers to
day. In contrast, clean energy solutions, job feel more comfortable adopting ecommerce
growth, decreased GhG emissions and cost- as a viable retail option, which then leads to an
increase in GhG emissions. Further investment
efficient electricity sources for electric and
in alternative materials, as well as advanced
autonomous vehicles are a far more important
technologies like Reality Capture and Image
investment. Recognition – possibly leading to a reduction in
returns - can lead to decreased trips and more
intelligent packaging.
13INTERVENTIONS IN THE SIMULATION: DETAILS
Intervention: “Delivery fleet electification.”
Description: All supply trucks are electrified. Passenger cars are the only vehicles left without electrifying.
Intervention: “Everybody electrifies.”
Description: All vehicles are electric, passenger and supply.
Intervention: “I own a Prius.”
Description: All passenger vehicles are hybrid (tailpipe GHG is less than 256).
Intervention: “I own a Tesla.”
Description: All passenger vehicles are electric (GHG is equal to mileage * jurisdiction electricity GHG intensity).
Intervention: “Bundle Packages.”
Description: Average product per shipped box is 2.0.
Intervention: “Let’s go shopping.”
Description: Average basket size for the traditional retail consumer is 10.0 products on average per shopping trip
(base case uses 2.60 on average).
Intervention: “Locker use.”
Description: Last-delivery vehicle does not deliver to individual addresses, but rather to a centralized location
(reduces the distance of the last portion of the drop trip for ecommerce).
Intervention: “Region 1 Hyperurban.”
Description: Uses only urban metro jurisdictions such as NYC Metro, LA Metro, Chicago Metro, South Florida
Metro, etc.
Intervention: “Region 2 Coastal.”
Description: Uses only state-level jurisdictions which have a direct access to an ocean. Examples include
Florida, Texas, Oregon and Maine.
Intervention: “Region 3 Noncoastal.”
Description: Uses only state-level jurisdictions which do not have direct access to an ocean. Such as Ohio,
Wyoming, Michigan, Nevada, etc.
Intervention: “LastTouchTM Facility.”
Description: Utilizes Q-zero (minimum distance) for the second distance quartile of the properties trip to an
address. In other words, last-mile facilities are shifted to have the same average distance as traditional retail
stores.
Intervention: “No boxes.”
Description: Reduces 80% of cardboard boxes for ecommerce and replaces them with the GHG emissions of
paper bags.
Intervention: “Out for a hyperurban walk.”
Description: Uses only urban metro jurisdictions and reduces all emissions for the passenger vehicle, as this
element is replaced by a zero-emissions transport mode. Such as walking or biking.
Intervention: “Restrict Returns.”
Description: Reduces 50% of ecommerce excess-GHG attributed to returns. This intervention reduces
ecommerce returns to approximately 15% overall. Traditional retail has an average of 7.5%.
14AVERAGE AND OUTLIER TRIAL OUTCOMES FROM
SIMULATIONS
In the “Urban Last-Mile Facility” scenario, the location improvement accounts for a
50% decrease in all emissions coming from the transportation source. This strategy,
combined with making vehicles more efficient, can bring the urban shopper further
from the point of indifference between choosing ecommerce or driving to the nearest
store, helping cement the advantages of the former.
In an extreme case, the savings from “Urban Last-Mile Facility” could be so important
as to even render shopping trips using public transport equivalent to ecommerce.
In the “I Own An Electric” scenario, on average, increasing the efficiency of the personal
shopper vehicle effectively enables the brick and mortar shopper to engage in personal
trips over ordering online because the emissions lower by such a substantial amount
that it makes the shopper indifferent to both strategies, from a carbon emission point
of view.
Moreover, in an extreme case where the shopper belongs to a jurisdiction with a
low fossil fuel component in electricity, it could even result in surplus emissions for
ecommerce, when comparing. This effectively unburdens the shopper from any
inefficiencies in the system.
In an “Everybody Electrifies” average scenario, ecommerce will not be able to compete
with brick and mortar if the shopper electrifies, unless a more efficient alternative
delivery vehicle contender appears. Or, unless the composition of electricity country-
wide is cleaner.
In the case that the carbon-conscious shopper does not wish to purchase an EV, they
should know that they can always increase the amount of products purchased in a
single click. In the “Bundles Packages” scenario, on average, a shopper can make
significant reductions that can result in 30% less total emissions when ordering two or
more products that fit inside the same box.
However, it also turns out that bundling items in brick-and-mortar shopping has a
much more impactful effect than bundling in ecommerce. As emissions get reduced
by 50% in total when purchasing 10 or more products in a single car trip.
According to the “No Boxes” scenario, a retailer who is willing to eliminate a significant
portion of the boxes will see 36% of the total ecommerce emissions reduced. This is
an easy target to achieve by ecommerce retailers that can substantially tilt the balance
in their favor.
15In the “Restrict Returns” scenario, a shopper can become more informed about the
sizing and qualities of the product they are ordering and restrain from returning items.
By doing so, they improve the overall efficiency of the system and the carbon footprint.
In an extreme scenario, where an online retailer uses augmented reality capture to
reduce almost all returns while maintaining the same volume of orders, the shopper
will achieve similar revenue margins to those of brick and mortar with a much more
carbon-clean operation.
Lastly, the “Out For A Walk” scenario has the lowest footprint for traditional retail, less
than ecommerce in 100% of the cases. As transportation carries such a consequential
weight for the brick and mortar channel, this means that any effort to aminorate this
part will yield great results.
Only in the extreme event that fulfilment can also be done from within the same urban
area, and using efficient EVs for delivery, will ecommerce pose competition for brick
and mortar, in carbon terms.
As a comparison between strategies;
• Reducing 80% of the packaging in ecommerce will save only half of emissions
than a brick and mortar shopper who elects to buy 10 products or more.
• Reducing 80% of the boxes also carries similar savings in percentage than
electrifying the personal car, however in absolute terms the electric personal car
saves almost twice the emissions than the reduced boxing.
• Consolidating orders in ecommerce helps reduce half of the emissions that would
otherwise be reduced by using a personal electric vehicle.
• Similarly, a trip done by foot saves twice the amount of emissions than an EV car
trip.
16INTERVENTIONS IN THE SIMULATION:
SHIFTING THE CARBON FOOTPRINT
“Location, Location, Location” “Change the Tech”
KgCO2e / Item KgCO2e / Item
Trials Trials
This graph indicates that the average emissions The graph above shows a scenario where the pas-
from the ecommerce activity see littler change senger vehicle, used by the traditional consumer,
when incorporating this scheme. This is due to is electric. In this market, manufacturers – such as
added inefficiencies in the process and to in- Tesla – demonstrate efficient passenger EVs that
conveniences, which could translate to consum- pose a substantial reduction of GhG emissions in
ers being required to use a passenger vehicle to the most intensive leg of the traditional shopper
gather their items. It also represents greater use channel: transportation.
of square footage and installing facilities capable
of handling packages.
Key Recommendation: Key Recommendation:
Logistics and supply chains can choose better lo- Switching to EVs will make a tremendous impact
cations to distribute packages from. on lowering GHGs, but this does not suggest con-
sumers should increase their trips to stores.
17INTERVENTIONS IN THE SIMULATION:
SHIFTING THE CARBON FOOTPRINT
“Shift the Scale” “Nudge the Behavior”
KgCO2e / Item KgCO2e / Item
Trials Trials
An innovation that greatly reduces the emissions Perhaps the clearest case of emissions reduction
in traditional shopping is ordering in larger quanti- in our study is that of the traditional retail hopper
ties. In the base case, the average basket size is in large urban centers who elects not to use a car
2.60 product per purchase in a traditional retail and instead walks or bikes to the nearest store.
store. If this number is increased to 10 products This is the case for most Americans living in large
per purchase, the negative impact of traditional cities. This scenario reflects savings of up to 69%
shopping is minimized by almost four-fold. This over ecommerce.
results in the average traditional retail case in
our simulation to become more environmental-
ly-friendly than ecommerce.
Key Recommendation: Key Recommendation:
Consolidate shopping trips by buying items in bulk Walk to the store, if you can. Urban or enhanced
when doing brick-and-mortar shopping. mixed use development that centralizes con-
sumption is best for health and the environment.
18INTERVENTION SAVINGS SUMMARY
in Table 2, we summarize the outcomes of 12 interventions, across four different geography types
to result in just under half a million trials. This big data helps us to glean where there is sensitivity
within consumer behavior outright, and where changes by stakeholders can be made to help
minimize carbon foot prints. Our results point to important changes that real estate can make
to improve site selection to minimize transportation distances. Consumers can conciously bun-
dle their goods, walk to pick them up or increasingly switch to EVs. Urban planners can actively
choose to consider carbon footprints in their zoning decisions. Finally, everyone can work to min-
imize returns and card board box consumption. These two factors create a significant rebound in
the amount of carbon emissions that each package contributes.
A B C D E F G
Avg.
Change in
Ecommerce Trad. Retail Avg. Emissions Change in Emissions
Emissions
has more has more for Ecommerce Emissions over for Traditional
Name over Base
emissions emissions (kgCO2e / Base Case Retail
Case (Brick-
in (Trials): in (Trials): Item): (Ecommerce): (kgCO2e /
and-Mortar):
Item):
Base Case 25% 75% 0.749 - 1.181 -
Urban Last-
21% 79% 0.676 -10% 1.165 0%
Mile Facility
Locker Use 23% 77% 0.725 -3% 1.182 0%
I Own An
63% 37% 0.747 0% 0.726 -38%
Electric
Delivery Fleet
22% 78% 0.714 -5% 1.175 0%
Electrification
Everybody
60% 40% 0.713 -5% 0.721 -39%
Electrifies
I own a
54% 46% 0.747 0% 0.730 -38%
Hybrid
Bundle
13% 87% 0.528 -30% 1.160 -2%
Packages
Let’s go
88% 12% 0.748 0% 0.565 -52%
Shopping
No Boxes 10% 90% 0.479 -36% 1.177 0%
Restrict
20% 80% 0.653 -13% 1.177 0%
Returns
Out For A
100% 0% 0.747 0% 0.366 -69%
Walk
Table 2. Intervention Savings Summary.
19OVERALL FINDINGS
In the past three decades, one of the asset classes that has seen the most transformation is
undoubtedly the retail sector. Advances in technology, innovations in the supply chain, and consumer
behavior changes have led property owners and operators to remain in constant evolution to cater
to the new needs and trends of their patrons.
The latest and most prominent of these changes over the last few years is the consolidation of
ecommerce as a solid contender for the preferred choice of the American consumer. Wooing
customers away from the brick and mortar stores and delighting them with new options, such
as same-day-delivery, has greatly contributed to this. Impulsed by worldwide events such as
the Covid-19 pandemic, ecommerce will continue to evolve and become more ubiquitous in the
American shopper’s life.
The environmental impact of ecommerce has just started to be explored and quantified by
researchers. A necessary question is whether these changes can signify a reduction in the
greenhouse gas emissions that threaten to alter the climate and life of our planet. Our research
shows that sometimes the behavioral changes that consumers elect to adopt, even if these are
simple, can translate into significant savings.
Our research also illustrated how necessary it is to reconsider the basic components of the supply
chain and how to solve the issues within. The inefficiencies outlined in our study point towards
specific elements and clues to which changes within the real estate sector can be adopted to
minimize this impact, such as better locations, more efficient facilities, or being closer to the end
customer.
Future Research
Further research will also provide a valuation framework for logistics real estate developers and
operators who wish to develop and redevelop properties in areas that will bring increased value
to their tenants. The findings of the Monte Carlo simulation can be used to assess the value of
particular locations as key drivers to reducing carbon emissions. This environmental impact, when
paired together with savings in costs and better customer service, will represent a rent premium
that developers can capitalize on.
It will also be pertinent to analyze the relevancy of ESG investment funds and the role companies
will have to face as governments worldwide introduce new policies and legislation. We hope our
study is also of use for teams seeking to explore net-zero solutions.
20“In the end, real estate and urban
planning can work together to
make a principal contribution to
carbon emissions- site selection.
Unlike any other form of real estate,
retail and ecommerce can make
the greatest impact on climate as
the location and transportation
interaction can fundamentally
alter the total emissions for
consumers. It should be included in
every debate, for every site going
forward. ”
DR. ANDREA CHEGUT
MIT REAL ESTATE INNOVATION LAB
21APPENDIX I: ASSUMPTIONS
Below is an explanation of each of the assump- future, as these new consumers become more ac-
tions incorporated into the carbon footprint quainted with this activity, we predict return rates will
simulation model used. fall thereafter.
Source: McKinsey & Company
General Assumptions
GHG of electricity Transportation Assumptions
KgCO2e / kWh Vehicle Mileage - Internal Combustion
The carbon footprint of electricity is calculated per KgCO2e / mile
the basis of kWh used. Every jurisdiction has a differ- The EPA determines the environmental impact per
ent mix percentage of generation sources (gas, coal, mile of each vehicle in the U.S. market through a stan-
nuclear, wind, etc.), and this mix determines the over- dardized testing program. For our study, a threshold
all environmental impact of the jurisdiction. For this was used to select only internal combustion cars (not
study, data for each individual U.S. state was used. hybrid) that range from 0.256 to .900 KgCO2e per
This GHG figure impacts all activities related to elec- mile for the base case simulation. Later in the study,
tricity for the selected jurisdiction. an intervention that consists of replacing the pas-
Source: U.S. Energy Information Administration (EIA) senger vehicle with a hybrid one is introduced.
Jurisdiction chosen Source: Environmental Protection Agency (EPA), fu-
Population percentage eleconomy.gov
Our simulation selects a different U.S. state based on
the population percentage from the whole. This way, Vehicle Mileage - Electric
in every trial, larger populations have a higher chance kWh/ mile
of being selected. For some jurisdictions with large Research was done on the currently available and
metro areas, such as California and Florida, the pop- future electric vehicles (EVs) in the U.S. car market to
ulation figure for these is separated from the state- determine an average mileage. EVs’ mileage is cal-
wide occurrence percentage. culated as the range in miles of a full battery charge,
Source: U.S. Census Bureau under regular driving conditions, multiplied by the
electricity intensity of the selected jurisdiction.
Basket Size Source: EV manufacturers, consumer magazines
Items purchased
For traditional retail, an average basket size was es- Vehicle parcel capacity
timated from U.S. consumer data. The basket size Packages fulfilled
varies by product type, so an average was estimated An estimate was calculated using the cubic space
using the ecommerce product types in a particular inside each vehicle type divided by the typical pack-
year. age volume. In our study, there are three different
delivery vehicle types: a large trailer truck, a smaller
Return rates semi-truck, and a delivery van used for the last-mile
Percentage of total orders portion of the trip.
A McKinsey report indicates that ecommerce during
the COVID-19 pandemic grew by 100% when com- Trip Distances
pared to the same period in the previous year. This Miles
new inflow of ecommerce consumers means that Locational data from industrial distribution buildings
return rates should see an increase in 2020 when were combined with data from the geographical,
we assume a correlation with inexperience. In the population-weighted center for U.S. counties where
22these properties are located. Each of the linear dis- the most stringent we found. This source considers a
tances to the center of the population was then in- total embodied carbon figure for cardboard, inclusive
terpolated and adjusted for the traffic grid shape and of the manufacturing process.
congestion. The data was distributed and assigned Source: United States Environmental Protection
to each jurisdiction based on a selected quartile. In Agency, Stockholm Environment Institute
our study, the distance quartiles are fundamental
to understanding the variation in miles in every trial, Ecommerce sales by type of product
and how the outcome changes depending on which Percentage of orders
combination of quartiles is used. Different studies and publications indicate the per-
Source: Prologis, Inc. centage of each product category that is purchased
through commerce. These percentage figures vary
by year. Our study encompasses the product mix
Real Estate Assumptions since 2016 and then predicts what the mix will look
Order throughput per property like up to 2025.
Orders fulfilled Source: ProLogis, Inc.
Fulfillment figures were used to determine the num-
ber of orders that pass through a fulfillment property
daily under normal operating circumstances. This
figure was then weighted using the population per-
centage in every jurisdiction to estimate the number
of properties necessary to serve the entire popula-
tion. Based on this, we arrived at an average number
of orders per property and per jurisdiction.
Energy consumption per building type
kWh / year / SF
A benchmark was used to estimate an average year-
ly energy consumption per square foot (SF) of gross
building area (GBA). This figure is then divided into
the order throughout the property in question, and
the result is the corresponding emissions attribut-
able to every single package.
Source: GRESB
Packaging Assumptions
GHGs of packaging
KgCO2e / Kg
We aggregated greenhouse emissions of the card-
board, paper, and plastic components of typical
packaging material, and then multiplied by the aver-
age packaging weight per order. In the case of tradi-
tional retail, only the paper and plastic components
were used, as a cardboard box is not typically re-
quired. Our source of choice for this information was
23APPENDIX II: SOURCES
Coresight Research. (2020). Market Overview E-Commerce. (D. Weinswig, com: https://bollingermotors.com/deliver-e-vans/
Ed.) Coresight Research. Forbes. (n.d.). Retrieved September 2020, from Forbes.com: https://www.
Accenture Logistics Platform. (2020). How Could Last Mile Delivery Evolve To forbes.com/sites/alanohnsman/2019/09/19/amazons-multibillion-dol-
Sustainably Meet Customer Expectations? lar-bet-on-electric-delivery-vans-is-game-changer-for-startup-rivian/#-
Lux Research. (2020). Automating the Last Mile. (C. R. Josh Kern, Ed.) 2455fea0d013
Motavalli, J. (2020, August 27). Soon, the Kitty Litter Will Come by Electric Chanje Energy. (n.d.). Retrieved September 2020, from Chanje.com: https://
Truck. The New York Times. chanje.com/vehicles/
Passport. (2020). From Sustainability to Purpose: Digitalisation Shapes The EPA FUEL ECONOMY. (1985-2020). (United States Environmental Protection
Future Of Business With Purpose. Agency (EPA), United States Department of Energy) Retrieved 2020
September, from Fuel Economy Web: https://www.fueleconomy.gov/
GRESB Real Estate. (2019). 2019 Results Sustainable Real Assets. feg/ws/
Connolly, E. M. (2011, June). Where Did All of the Totes Go? A Study in Supply United States Environmental Protection Agency (EPA). (2011). Greenhouse
Chain Design. Master’s Thesis. Massachusetts Institute of Technology. Gas Emissions from a Typical Passenger Vehicle. Office of Transporta-
Dablanc, L., & Rakotonarivo, D. (2010). The impacts of logistics sprawl: How tion and Air Quality.
does the location of parcel transport terminals affect the energy efficien- Moro, A., & Lonza, L. (2017). Electricity carbon intensity in European Member
cy of goods’ movements in Paris and what can we do about it? Elsevier States: Impacts on GHG emissions of electric vehicles. Elsevier.
Ltd.
Eurostat. (2019). Energy, transport and environment statistics: 2019 edition.
Ng, J. (2010, June). Environmental, Operational and Financial Sustainability of European Union (EU).
Packaging Methods in Delivery Businesses. Massachusetts Institute of
Technology. United States Environmental Protection Agency (EPA). (2018). eGRID Summa-
ry Tables 2018. EPA.
Craig, A. J., Blanco, E. E., & Sheffi, Y. (2013). Estimating the CO2 intensity of
intermodal freight transportation. Elsevier Ltd. [Industrial Property Owners]. (2020). Database for property locations. [Indus-
trial Property Owners].
Craig, A. J. (2012). Measuring Supply Chain Carbon Efficiency: A Carbon Label
Framework. Massachusetts Institute of Technology. United States Census Bureau. (n.d.). Retrieved October 2020, from Population
center by county: census.gov
Weideli, D. (2013). Environmental Analysis of Online Shopping in the United
States. MIT Center for Transportation and Logistic; École Polytechnique United States Energy Information Administration. (n.d.). Retrieved October
Fédérale de Lausanne. 2020, Electricity intensity by state: https://www.eia.gov/electricity/data/
state/
Velázquez-Martínez, J. C., Fransoo, J. C., Blanco, E. E., & Mora-Vargas, J. (n.d.).
The impact of carbon footprinting aggregation on realizing emission re- Edwards, J. B., & McKinnon, A. C. (2009). Shopping trip or home delivery:
duction targets. Massachusetts Institute of Technology. which has the smaller carbon footprint? United Kingdom: CILT Supply
Chain.
Blanco, E. E., & Sheffi, Y. (2017). Green Logistics.
Pineda Blanco, L. (2018). Changes in Online Shopping Behavior During the
Merchan, D., & Blanco, E. E. (2015). The Near Future of Megacity Logistics Last Decade. University of California Davis.
Overview of Best-Practices, Innovative Strategies and Technology
Trends for Last-Mile Delivery. MIT Megacity Logistics Lab. Weideli, D. (2013). Environmental Analysis of US Online Shopping. MIT Center
for Transportation and Logistics.
Blanco, E. E., & Fransoo, J. C. (2013). Reaching 50 million nanostores: Retail
distribution in emerging megacities. Beta Working Paper Series. Prologis, Inc. (2019). The Modern Supply Chain: A New Model for Defining Lo-
gistics Real Estate. Prologis Research.
United States Environmental Protection Agency (EPA). (2017). U.S. Green-
house Gas Emissions and Sinks 1990-2017. EPA. Prologis, Inc. (2019). Logistics Real Estate and E-commerce Create Sustain-
ability Advantages. Prologis Research.
Thuiswinkel. (2019). Goed Verpakt - Handleiding Duurzaam Verpakken (Well
Packed - Sustainable packaging manual for the e-commerce sector). World Economic Forum. (2020). The Future of the Last-Mile Ecosystem. World
The Netherlands: Thuiswinkel. Economic Forum.
He, B., Liu, Y., Zeng, L., Wang, S., Zhang, D., & Yu, Q. (2019). Product carbon Barrett, J., Vallack, H., Jones, A., & Haq, G. (2002). A Material Flow Analysis and
footprint across sustainable supply chains. Elsevier. Ecological Footprint of York. Stockholm Environment Institute.
Shahmohammadi, S., Steinmann, Z. J., Tambjerg, L., van Loon, P., Henry King, Haag, M., & Wu, W. (2019, October). 1.5 Million Packages a Day: The Internet
J., & Huijbregts, M. A. (2020). Comparative Greenhouse Gas Footprint- Brings Chaos to N.Y. Streets. The New York Times.
ing of Online versus Traditional Shopping for Fast-Moving Consumer Rheude, J. (2020, August). (R. S. Fulfillment, Producer) Retrieved 2020, from
Goods: A Stochastic Approach. Environmental Science and Technology. ECommerce Returns During the Pandemic: https://redstagfulfillment.
American Chemical Society. com/ecommerce-returns-during-pandemic/
Amazon.com. (2019). Amazon Frustration-Free Packaging Program Certifica- Amazon.com. (n.d.). Retrieved from Why Amazon warehouses are called ful-
tion Guidelines. filment centres: https://www.aboutamazon.co.uk/amazon-fulfilment/
Prologis, Inc. (2019). Creating Value Beyond Real Estate: 2019 Prologis ESG our-fulfilment-centres/why-amazon-warehouses-are-called-fulfil-
Impact Report. Prologis Research. ment-centers#:~:text=Amazon%20operates%20more%20than%20
175,across%20North%20America%20and%20Europe.
Blanco, E. E. (n.d.). Urban Freight and Port Cities. Cambridge, MA, United
States: MIT Center for Transportation and Logistics. McKinsey & Company. (2020). McKinsey Quarterly: The quickening. Retrieved
from https://www.mckinsey.com/business-functions/strategy-and-cor-
Whatcar.com. (n.d.). Retrieved September 2020, from https://www.whatcar. porate-finance/our-insights/five-fifty-the-quickening
com/news/what-car-real-range-which-electric-car-can-go-farthest-in-
the-real-world/n18162 CB Insights. (2020). State Of Retail Tech H2’20 Report: Investment & Sector
Trends To Watch.
Bollinger Motors. (n.d.). Retrieved September 2020, from Bollingermotors.
24AUTHORS
Diego Fernández Briseño
is a Research Analyst at the
MIT Real Estate Innovation
Lab and holds an MS in Real
Estate Development. His work
studies how climate technology
will impact the financing and
development of real estate.
Dr. Andrea Chegut
Is the Director of the MIT
Real Estate Innovation Lab.
She holds a PhD in financial
economics and studies
how technology, design,
and innovation impact the
economic outcomes of the built
environment.
Erin Glennon
is the Lab Manager of the MIT
Real Estate Innovation Lab. She
holds an MFA and works with
lab members to develop and
publish research.
James Scott
is the Lead Researcher at the
MIT Real Estate Innovation
Lab. He holds an MS in real
estate development and stud-
ies how technology impacts
the commercial progress
and development of the built
We are grateful for the financial support of the MIT Real
environment.
Estate Innovation Lab partners: ProLogis, JLL, and EY.
Without their continued support we would be unable to
explore and sustain new research. Findings within this Juncheng Yang
research are independent of third parties interests. All is a Research Associate at the
errors, emissions or opinions are that of the authors. MIT REI Lab with training in
architecture, urban design and
economics. He holds an MS
© MIT Real Estate Innovation Lab 2020 in urbanism and studies how
design impacts real estate
Any use of this material without
permission is strictly forbidden. pricing.
For more information contact us at
reilabcontact@mit.edu.You can also read