Dim-to-Warm LED Lighting: Stress Testing Results for Select Products - U.S. Department of Energy-Solid-State Lighting Technology Area
←
→
Page content transcription
If your browser does not render page correctly, please read the page content below
Dim-to-Warm LED Lighting: Stress
Testing Results for Select Products
U.S. Department of Energy—Solid-State Lighting
Technology Area

January 2020
(This page intentionally left blank)
RTI Project Number
 0215939.001.001

 Dim-to-Warm LED Lighting:
 Stress Testing Results for
 Select Dim-to-Warm Products
 January 2020

 Prepared for

 U.S. Department of Energy

 Through contract with
 KeyLogic Systems, Inc.
 3168 Collins Ferry Road
 Morgantown, WV 26505

 Prepared by

 Kelley Rountree, Lynn Davis, Michelle McCombs,
 Roger Pope, Jean Kim, and Karmann Mills
 RTI International
 3040 E. Cornwallis Road
 Research Triangle Park, NC 27709

 Monica Hansen
 LED Lighting Advisors
 3047 Marilyn Way
 Santa Barbara, CA 93105

RTI International is a registered trademark and tradename of Research Triangle Institute.

 iii
Dim-to-Warm LED Lighting: Stress Testing Results for Select Products

Acknowledgments
This material is based upon work supported by the U.S. Department of Energy, Office of Energy Efficiency
and Renewable Energy (EERE), under Award Number DE-FE0025912.

This work benefited greatly from input and discussions from members of the LED Systems Reliability
Consortium: Morgan Pattison of SSLS, Inc, Jim Gaines of Signify, Steve Paolini of Telelumen, Wouter Soer
of Lumileds, and Mark Duffy of Current by GE.

Disclaimer
This report was prepared as an account of work sponsored by an agency of the United States Government.
Neither the United States Government nor any agency thereof, nor any of their employees, makes any
warranty, express or implied, or assumes any legal liability or responsibility for the accuracy, completeness, or
usefulness of any information, apparatus, product, or process disclosed, or represents that its use would not
infringe privately owned rights. Reference herein to any specific commercial product, process, or service by
trade name, trademark, manufacturer, or otherwise does not necessarily constitute or imply its endorsement,
recommendation, or favoring by the United States Government or any agency thereof. The views and opinions
of authors expressed herein do not necessarily state or reflect those of the United States Government or any
agency thereof.

 iv
Dim-to-Warm LED Lighting: Stress Testing Results for Select Products

Nomenclature or List of Acronyms
45OL operational life test conducted at 45°C

6590 life test conducted at 65°C and 90% relative humidity

α decay rate constant in TM-28-14 model

Δuʹ change in the u’ coordinate of chromaticity

Δuʹvʹ chromaticity shift or the total change in chromaticity coordinates

Δvʹ change in the v’ coordinate of chromaticity

λc centroid wavelength

A amperes or amps

ac alternating current

ANSI American National Standards Institute

AST accelerated stress test

CCT correlated color temperature

CIE International Commission on Illumination

COB chip-on-board

CRI color rendering index

CSM chromaticity shift mode

CSP chip-scale package

D2W dim-to-warm

dc direct current

DUT device under test

hrs hours

Hz Hertz or cycles per second

IEEE Institute of Electrical and Electronics Engineers

IES Illuminating Engineering Society

IC integrated circuit

K Kelvin

L70 time required for the luminous flux to decay to 70% of the initial value

LED light-emitting diode

 v
Dim-to-Warm LED Lighting: Stress Testing Results for Select Products

LFM luminous flux maintenance

lm lumen

LSRC LED Systems Reliability Consortium

MP-LED mid-power LED

NEMA National Electronics Manufacturing Association

NIST National Institute of Standards and Technology

NGLIA Next Generation Lighting Industry Alliance

nm nanometer

Pst short-term flicker indicator

PCB printed circuit board

Rf fidelity index in IES TM-30-18

Rg gamut index in IES TM-30-18

RTOL room temperature operational life

SPD spectral power distribution

SSL solid-state lighting

SVM stroboscopic visibility measure

t time

T95 time required to reach 95% of equilibrium temperature

TLA temporal light artifact

u' chromaticity coordinate in the CIE 1976 color space

V volt

v' chromaticity coordinate in the CIE 1976 color space

W watt

WTL white-tunable lighting

W/nm watts per nanometer

 vi
Dim-to-Warm LED Lighting: Stress Testing Results for Select Products

Executive Summary
Solid-state lighting (SSL) products that use light-emitting diodes (LEDs) offer numerous advantages over
conventional lighting products including energy savings, longer lifetimes, and greater spectral flexibility of the
output light from the device. Dim-to-warm (D2W) products are an emerging SSL technology for use in
residential and entertainment applications. D2W products are a type of multi-source LED product and a
subclass of white-tunable lighting (WTL) that mimic the behavior of incandescent lamps as they are dimmed;
D2W products provide a warmer lighting spectrum (i.e., the correlated color temperature [CCT] shifts to a
lower value) as the user dims the device. Since the CCT of LEDs does not change drastically with dimming,
new electrical architectures and circuits are needed to provide this “warm-dimming” capability in LED
products. The effect of these architectures and dimming on the reliability of the D2W lamps and luminaires is
not well understood. Therefore, this report, which is the second report about D2W LED lighting products, uses
accelerated stress tests (AST) to study and understand the mechanisms of optical change of the D2W products.
The earlier report (Initial Benchmarks) [1] on D2W products provided initial characterization of the lamps and
LED modules studied in this current report. The earlier report also provided performance benchmarks relative
to an incandescent lamp for the lamps studied in this current report.

The selected D2W products investigated in this report used different electrical architectures to control power to
their LED primaries, and the electrical architectures could be broadly categorized into two groups
(Architecture 1 and Architecture 2). At low power and deep dimming, both architectures only supplied enough
power to operate the lower CCT LED primary and at moderate dimming levels, the lower CCT LED primary
and at least one or more higher CCT LED primaries emit light. The electrical architectures differed at high
power (e.g., no dimming), where the lower CCT LED primary turned off in Architecture 1 but the lower CCT
LED primary (and all other LED primaries) remained on for Architecture 2. The specific devices under test
(DUTs) examined in this report include four lamps (referred to as Lamp A – Lamp D) and three integrated
LED solutions or LED modules (referred to as Module E – Module G). Lamps A, B, and D used Architecture
1 while Lamp C and Modules E – F used Architecture 2 to provide the warm-dimming behavior. In general,
the DUTs examined provided spectral tuning in a warm CCT range (1,800 K – 3,000 K); Module G provided
spectral tuning in a cooler CCT range (2,700 K – 4,000 K).

The four lamps were either A-style (Lamps A and B) or candelabra-style (Lamps C and D). The A-style lamps
were 60-watt equivalent and the candelabras were 40-watt equivalent. Both styles were intended for indoor or
outdoor use to promote the familiar warm-dimming characteristics of incandescent lamps. The LED primaries
for each D2W product investigated in this report were unique to each other by way of packaging (plastic mid-
power LEDs [MP-LEDs] or ceramic MP-LEDs), LED array format (chip-on-board [COB] or chip-scale
package [CSP]), LED type, phosphor material, and size. Lamps A, B, and D used plastic MP-LEDs while
Lamp C used ceramic MP-LEDs. Lamps A, C, and D had traditional LED lamp design, meaning that their
LED packages were mounted to a central printed circuit board (PCB) on a heat sink and the lamp relied on
plastic lenses and reflectors for uniform light dispersion. Lamp B used a filament-style LED arrangement with
a clear, glass globe, adding to its visual likeness of an incandescent lamp. The LED modules examined in this
study were composed of LED arrays in the COB (Module E) or CSP (Modules F and G) format.

This report summarizes the overall findings from up to 11,000 hrs of AST on the D2W lamp DUTs and up to
7,000 hrs of AST on the LED module DUTs. The AST procedures used in this study included room
temperature operational life (RTOL) test, 45ºC operational life (45OL) test, and a wet high-temperature
operational life test performed at 65ºC and 90% relative humidity (6590). During the ASTs described herein,
separate populations of each lamp DUT were subjected to power cycling through a four-step process of max
power (no dimming, 100% power level), low power (dimming the power level to 10% or 25%), medium power
(dimming the power level to 50%), and no power (off) during RTOL, 45OL, and 6590 testing. The dwell time
at each power level for the lamp DUTs was determined by the thermal characteristics of each lamp. During the
ASTs for the LED modules, separate populations of each LED module DUT were subjected to power cycling

 vii
Dim-to-Warm LED Lighting: Stress Testing Results for Select Products

through a 4-hr loop: 1 hr at max current, 1 hr at low current, 1 hr at moderate current, and 1 hr off during
RTOL, 45OL, and 6590 testing.

This report provides details regarding the causes of chromaticity and radiant flux changes and the impacts that
these changes have on the ability of the DUTs to maintain their designed warm-dimming behavior. This report
provides key findings on the relative impact of the form factor (i.e., lamp style, COB, CSP); LEDs, including
LED chip, phosphors, and packages; secondary device optics if applicable (e.g., lenses, reflectors); and
electrical architecture on the long-term reliability of the D2W products. The impacts of the new electrical
architectures and system components on product reliability may be different than other multi-source LED or
WTL products, and therefore new challenges to reliability engineering must be identified and characterized to
understand the performance of these new lighting technologies.

The key findings from this report and the earlier report [1] include the following:

 • The reliability of the LEDs for each DUT greatly impacted the long-term chromaticity and radiant flux
 behavior for the D2W products. It was found in this report that the stability of the LED chip was
 generally good, but the stabilities of the phosphors were less reliable. In particular, the lower CCT LED
 primaries, which had higher red phosphor concentrations, were subject to larger chromaticity shifts in the
 green direction (CSM-2, where CSM stands for chromaticity shift mode).

 • The secondary optics of the lamps in this study were found to have major impact on the chromaticity
 maintenance. In particular, the enclosure of LED primaries in a glass globe under positive pressure
 (Lamp B DUTs) showed great chromaticity stability (Δu'v' < 0.002 at all ASTs) relative to the traditional
 plastic globes, likely caused by less moisture and air ingress (two major contributors to phosphor
 oxidation). Additionally, the lenses for Lamps A and C became discolored during AST which led to
 terminal chromaticity shifts in the yellow-green direction (though parametric failure did not occur).

 • The form factor of the D2W products had significant impact on the reliability of the DUTs examined in
 this report. At the more aggressive test conditions (i.e., 6590), the candelabra-style Lamps C and D
 performed the worst, with projected lifetimes to luminous flux maintenance (LFM) values below 0.70 as
 low as 8,174 hrs (Lamp C) and abrupt failure occurring for all Lamp D DUTs. The DUTs with A-style
 lamp and COB or CSP LED module form factors generally exceeded the maximum allowed lifetime
 projections by the TM-28-14 method. The lower performance of the candelabra-style lamps is thought to
 be a consequence of the more stringent space limitations in these DUTs.

 • Aging of the driver electronics for the lamp DUTs examined in this study did not induce large changes in
 power consumption, LFM, or temporal light artifacts (TLA), and no correlation between driver
 architecture and device performance was found. However, the driver electronics did impact the overall
 reliability of the lamps, with four lamp DUTs failing abruptly due to electrical failure and two lamp
 DUTs failing parametrically (a Lamp B DUT exhibited a LFM value below 0.70 while a Lamp C DUT
 underwent chromaticity maintenance failure) due to improper regulation of current to the LED primaries
 by the electrical driver. The parametric failures caused by logic failures are unique to D2W products, and
 greater emphasis on understanding the reliability of the logic circuits should be emphasized in future
 studies.

 • The LED modules examined herein were also susceptible to logic failure modes, and intermittent or
 complete failure of these logic circuits produced chromaticity shifts in excess of Δu'v' = 0.018 (one
 Module E DUT, one Module F DUT, and two Module G DUTs). Three of these DUTs were operated at
 low stress test conditions (RTOL or 45OL) and the failures appeared to be caused by manufacturing
 flaws (e.g., solder migration) or premature component failure as opposed to wear-out mechanisms.

These tests show that the D2W products examined in this report can provide a suitable energy-savings
alternative to traditional incandescent lamps. The selected D2W products maintained the general robustness

 viii
Dim-to-Warm LED Lighting: Stress Testing Results for Select Products

expected of SSL products: the first abrupt failure did not occur until 3,500 hrs of operation in the 6590
environment and only three parametric failures occurred before 3,500 hrs (there were 63 total DUTs). In
addition, minimal changes to power consumption and TLA were observed. However, in addition to the failure
mechanisms observed for other WTL products (e.g., secondary device optics changes), these tests revealed
failure mechanisms unique to D2W products. Particularly, parametric failures (i.e., chromaticity shift [Δu'v' ≥
0.007], LFM < 0.70) were produced by improper current regulation to one or more LED primaries (due to
control integrated circuit or logic failure modes) and degradation of red phosphors. As both current control and
deep red phosphors are needed to mimic the deep dimming behavior of an incandescent lamp, this information
is useful to future research aimed at reducing the impact of these failure modes on D2W device reliability.

 ix
Dim-to-Warm LED Lighting: Stress Testing Results for Select Products

Table of Contents
Executive Summary ......................................................................................................................................... vii
 Introduction..................................................................................................................................................1
 Experimental and Analytic Methods .......................................................................................................4
 Samples .........................................................................................................................................4
 2.1.1 Lamp A – Lamp D ..............................................................................................................4
 2.1.2 LED Modules ......................................................................................................................6
 Stress Testing Methods.................................................................................................................6
 2.2.1 Lamp Power Cycling...........................................................................................................7
 2.2.2 LED Module Power Cycling................................................................................................8
 Measurement Methods.................................................................................................................9
 2.3.1 Luminous Flux ....................................................................................................................9
 2.3.2 Flicker and Temporal Light Artifacts .................................................................................9
 2.3.3 Electrical Properties...........................................................................................................9
 Results and Discussion ........................................................................................................................... 10
 Lamp A – Lamp D ....................................................................................................................... 10
 3.1.1 Luminous Flux Maintenance .......................................................................................... 11
 3.1.2 Chromaticity .................................................................................................................... 15
 3.1.3 Failure Analysis of Lamp A – Lamp D ............................................................................ 19
 3.1.4 Electrical Analysis of Lamp A – Lamp D ........................................................................ 22
 3.1.5 TLA Metrics...................................................................................................................... 22
 COB and CSP LED Modules ....................................................................................................... 25
 3.2.1 Luminous Flux Maintenance of LED Modules............................................................... 26
 3.2.2 Chromaticity Shifts of LED Modules .............................................................................. 28
 3.2.3 Electrical Analysis of LED Modules ................................................................................ 30
 Conclusions ............................................................................................................................................... 33
Appendix A ...................................................................................................................................................... A-1
Appendix B ...................................................................................................................................................... B-1

 x
Dim-to-Warm LED Lighting: Stress Testing Results for Select Products

List of Figures
Figure 1-1. Schematic showing the common architectures for WTL products and their
 subset D2W products. ................................................................................................................................1
Figure 2-1. The D2W lamps examined during this study: (A) Lamp A, (B), Lamp B, (C), Lamp
 C, and (D) Lamp D.......................................................................................................................................4
Figure 2-2. The chromaticity points (u’ and v') of Lamps A – D are plotted on the 1976 CIE
 diagram. The behavior approximates the black body curve as the lamps are dimmed
 from a starting point of approximately 2700 K to between 1800 – 2200 K, depending
 on the product model. The relevant American National Standards Institute (ANSI) color
 bins as defined by ANSI C78.377A are provided as a guide................................................................5
Figure 2-3. The D2W Integrated LED solutions examined in this study: (A) Module E, (B)
 Module F, and (C) Module G. .....................................................................................................................6
Figure 2-4. Test configuration for the Module E DUTs examined in this study. .......................................7
Figure 2-5. Thermal profile of a Lamp D DUT showing (A) start times (vertical dashed blue
 lines), T95% (red X’s), time at T95% (vertical dashed red lines), and dwell time necessary to
 reach T95% (horizontal double-sided black arrows with time labels), and (B) Tstart, Tstable,
 and T95% for the transition from 25% to 50% dimming. .......................................................................8
Figure 3-1. Initial SPDs of the control DUTs for Lamp A – Lamp D at (A) low power and (B)
 maximum power. ..................................................................................................................................... 10
Figure 3-2. Average LFM for the populations of A-style lamps: (A) Lamp A at dimming to
 10% power, (B) Lamp A at 100% power (i.e., no dimming), (C) Lamp B at dimming to
 25% power, and (D) Lamp B at 100% power (i.e., no dimming). ..................................................... 11
Figure 3-3. Average LFM for the populations of candelabra-style lamps: (A) Lamp C at
 dimming to 25% power, (B) Lamp C at 100% power (i.e., no dimming), (C) Lamp D at
 dimming to 25% power, and (D) Lamp D at 100% power (i.e., no dimming). ............................... 12
Figure 3-4. Luminous flux maintenance at low power for the Lamp A DUTs operated at RTOL
 show two test populations based on purchase date. DUT 456 and DUT 457 were
 purchased at the same time, and DUT 472 and DUT 473 were purchased two weeks
 later. ........................................................................................................................................................... 13
Figure 3-5. Chromaticity shifts for the A-style lamps in different ASTs: (A) Lamp A at low
 power, (B) Lamp A at maximum power, (C) Lamp B at low power, and (D) Lamp B at
 maximum power. .................................................................................................................................... 15
Figure 3-6. Chromaticity shifts for the candelabra-style lamps in different ASTs: (A) Lamp C
 at low power, (B) Lamp C at maximum power, (C) Lamp D at low power, and (D) Lamp D
 at maximum power. The Lamp C DUTs were operated in 6590 test conditions for 8,000
 hrs............................................................................................................................................................... 16
Figure 3-7. The centroid wavelengths of the higher CCT LED primary emitters of Lamp A
 steadily shifted during 6590 testing: (A) the centroid wavelength of the blue LED shifted
 to longer wavelengths and (B) phosphor emission steadily shifted to lower wavelengths
 during the first 3,000 hrs........................................................................................................................ 17

 xi
Dim-to-Warm LED Lighting: Stress Testing Results for Select Products

Figure 3-8. Different degradation pathways likely dominated the emission behavior of the
 Lamp C DUTs throughout testing, which led to varying ratios of blue to red emission at
 both (A) low power and (B) max power. ............................................................................................... 18
Figure 3-9. SPD of Lamp C DUT 489 at 7,000 hrs shows increased radiant flux in the blue
 region (450 nm – 500 nm) relative to the starting SPD (0 hrs) and SPD taken at 6,000
 hrs just prior to parametric failure. ....................................................................................................... 20
Figure 3-10. A representative Lamp D DUT aged at 6590 showing (A) minimal PCB
 discoloration, (B) cracking of the exterior plastics encasing the DUT, and (C)
 discoloration of the MP-LED terminals relative to the control DUT.................................................. 21
Figure 3-11. Average (A) power consumption and (B) luminous efficacy for Lamp B DUTs at
 max power................................................................................................................................................. 22
Figure 3-12. TLA measurements for Lamp A. The control DUT (solid lines) and the average
 TLA for DUTs operated in the 6590 conditions after 7,000 hrs (dashed lines) are
 compared in the graph and the resulting flicker percentage, flicker index, flicker
 frequency, SVM, and Pst are shown in the table.................................................................................. 23
Figure 3-13. TLA measurements for Lamp B. The control DUT (solid lines) and the average
 TLA for DUTs operated in the 6590 conditions after 7,000 hrs (dashed lines) are
 compared in the graph and the resulting flicker percentage, flicker index, flicker
 frequency, SVM, and Pst are shown in the table.................................................................................. 24
Figure 3-14. TLA measurements for Lamp C. The control DUT (solid lines) and the average
 TLA for DUTs operated in the 6590 conditions after 7,000 hrs (dashed lines) are
 compared in the graph and the resulting flicker percentage, flicker index, flicker
 frequency, SVM, and Pst are shown in the table.................................................................................. 24
Figure 3-15. TLA measurements for Lamp D. The control DUT (solid lines) and the average
 TLA for DUTs operated in the 6590 conditions after 7,000 hrs (dashed lines) are
 compared in the graph and the resulting flicker percentage, flicker index, flicker
 frequency, SVM, and Pst are shown in the table.................................................................................. 25
Figure 3-16. Initial SPDs of the LED modules at (A) low current and (B) high current. ....................... 26
Figure 3-17. Average LFM for (A) Module E at low current, (B) Module E at high current, (C)
 Module F at low current, (D) Module F at high current, (E) Module G at low current, and
 (F) Module G at high current................................................................................................................... 27
Figure 3-18. Chromaticity diagram for (A) Module E at low current, (B) Module E at high
 current, (C) Module F at low current, (D) Module F at high current, (E) Module G at low
 current, and (F) Module G at high current. ........................................................................................... 29
Figure 3-19. SPD of Module E DUT 487 at 6,000 hrs shows increased radiant flux in the
 blue-green region (450 nm – 550 nm) relative to the starting SPD (0 hrs) and SPD
 taken at 5,000 hrs just prior to parametric failure. Pictures of the DUT show loss of light
 emission from LEDs on the left side of the COB at 6,000 hrs. ......................................................... 31
Figure 3-20. (A) SPDs of DUT 589 post-failure (dashed lines) showed increases in blue
 emissions compared to the SPDs taken at 0 hrs (solid lines) at both low (black) and
 high (red) current settings. (B) The blue box shows an electrical short created between
 two pins of DUT 591’s control IC. .......................................................................................................... 32

 xii
Dim-to-Warm LED Lighting: Stress Testing Results for Select Products

Figure A-1. Characteristics of Lamp A. ....................................................................................................... A-1
Figure A-2. Characteristics of Lamp B. ....................................................................................................... A-2
Figure A-3. Characteristics of Lamp C. ....................................................................................................... A-2
Figure A-4. Characteristics of Lamp D. ....................................................................................................... A-3
Figure B- 1. Characteristics of Module E. ................................................................................................... B-1
Figure B- 2. Characteristics of Module F..................................................................................................... B-2
Figure B- 3. Characteristics of Module G.................................................................................................... B-2

 xiii
Dim-to-Warm LED Lighting: Stress Testing Results for Select Products

List of Tables
Table 2-1. Initial D2W Lamp Performance Characteristics.........................................................................5
Table 2-2. Initial Characteristics of Integrated LED Solutions. ...................................................................6
Table 2-3. Dwell Times at Each Dimming Level for Lamp A – Lamp D and the Total Time It
 Takes to Complete the Four-Step Process. .............................................................................................7
Table 2-4. Current Levels Used During Power Cycling for the Integrated LED Solutions........................9
Table 3-1. Centroid Wavelengths of the Blue LED and Phosphors for Lamp A – Lamp D.................. 10
Table 3-2. Experimentally Derived α Values for Lamp A – Lamp D at Maximum Power.................... 14
Table 3-3. Average Time to Reach L70 at Maximum Power for Lamp A – Lamp D.............................. 14
Table 3-4. Lamp Failure Descriptions.......................................................................................................... 19
Table 3-5. Power Delivered to the Low-CCT (2,200 K) and High-CCT (2,700 K) LED Primaries
 of a Lamp D Device (DUT 501) Post Abrupt Failure Compared to the Control Sample................ 21
Table 3-6. Centroid Wavelengths of the Blue LED and Phosphors for the Integrated LED
 Solutions.................................................................................................................................................... 26
Table 3-7. Experimentally Derived α Values for the LED Modules at High Current.............................. 28
Table 3-8. LED Module Failure Descriptions............................................................................................... 30

 xiv
Dim-to-Warm LED Lighting: Stress Testing Results for Select Products

 Introduction
The adoption of solid-state lighting (SSL) by commercial and residential users has continued to climb in recent
years. The improved energy efficiency and reliability of SSL devices prompted the transition from traditional
light sources to light-emitting diode (LED) sources. In the United States from 2008 to 2015, the number of
residential installations of LED A-style lamps (the common “light bulb”) increased from less than 400,000 to
more than 200 million [2]. As LED technology continues to develop, the cost reduction of SSL products and
versatility of LEDs promote the adoption of LEDs in many new spaces. The ability to vary or tune the light
spectra from an LED device has made the technology attractive to application-specific settings where human,
plant, and animal wellbeing is directly affected and exploration into the benefits of LEDs has been studied in
educational [3], medical [4], and horticulture [5] settings.

While the benefits of using LED over traditional light sources have increased over the past decade, some of the
familiar aesthetics of traditional incandescent lighting were lost. For example, the emitted spectrum of an
incandescent lamp changes to warmer correlated color temperatures (CCT) when it is dimmed, but when LEDs
are dimmed, minimal change occurs to the emitted spectrum, resulting in a relatively stable CCT. This spectral
change to warmer CCTs upon dimming is very attractive in residential, restaurant, theater, and other
entertainment venues. For SSL devices to be fully realized in these spaces, manufacturers developed a new
class of LED lamps designed to mimic the spectral behavior of incandescent lamps upon dimming while
maintaining the energy efficiency of SSL products. These new products are termed “dim-to-warm” (D2W) or
“warm-dimming,” and they are the focus of this report.

D2W lighting products are a subclass of white-tunable lighting (WTL) products and as such, the control
architecture and overall design of D2W products mirror many of the features of WTL products as shown in
Figure 1-1. The novelty of WTL devices is that the user can separately control the color and intensity of light
emitted from the device through a user interface. The emission spectra (and subsequent color) of a WTL
product is tuned between different CCT values by changing the amounts of electrical power supplied to

 Figure 1-1. Schematic showing the common architectures for WTL products and their subset D2W products.

 1
Dim-to-Warm LED Lighting: Stress Testing Results for Select Products

two or more LED primaries. In a traditional WTL product, one LED primary emits a low-CCT light (e.g.,
2,700 K) and the other LED primary emits a high-CCT (e.g., 6,500 K) light. Many WTL devices are used in
specific spaces (e.g., hospitals, offices, nursing homes) where both preset light conditions and the ability for
the user to precisely adjust light color and intensity are useful. As such, many WTL devices use drivers that
have independent channels for each LED primary so that spectral color and dimming level can be controlled
separately.

As a subclass of WTL products, D2W products also tune the emission spectra between different CCT values
by using two or more LED primaries. Since D2W products were designed to mimic incandescent lighting, a
warmer color range is commonly chosen (e.g., 1,800 K – 2,700 K). The user interface for D2W lamps tends to
be simpler than conventional WTL products because the end user predominantly cares that the emitted light
appears “warmer” as the product is dimmed. As such, the dimming signal given by the user must be able to
produce both appropriate CCT and dimming level. To achieve this, a driver with preset current levels and logic
circuitry is commonly used to set the ratio and magnitude of current delivered to the two LED primaries. For
the D2W devices, the current delivered to one LED primary directly affects the current delivered to the other
LED primary.

In conjunction with the Next Generation Lighting Industry Alliance (NGLIA) and as part of the LED Systems
Reliability Consortium (LSRC), RTI International procured a selection of commercially available D2W lamps
and form factors. During the initial benchmarking phase, the lamps were disassembled and evaluated to
understand the basic control architectures of D2W lamps and how these architectures affect dimming
performance. The examined D2W lamps had two basic architectures. For both, only the warmest LED primary
emitted light at deep dimming levels (i.e., when low power was supplied to the device) and at mid dimming
levels (i.e., when an intermediate amount of power was supplied to the device), the higher CCT LED primary
emitted light so that both LED primaries were on. The architectures differed at high power (i.e., no dimming),
where some products turned off the warmest LED primary while other products continued to operate with all
LED primaries emitting light. The performance of the D2W products (CCT dimming range, temporal light
artifacts [TLA], spectral power distribution [SPD], and quality of light) were then compared to a traditional
incandescent lamp [1].

The initial benchmark report was designed to understand where reliability issues may occur in D2W products
and to guide the protocol needed to test these reliability concerns [1]. Like other WTL products, D2W products
are subject to varying levels of reliability issues caused by optical material changes, chromaticity and luminous
flux changes of LED primaries, and driver robustness. The level of these changes is impacted by the operating
environment (e.g., temperature, humidity) and the amount of current delivered to each LED primary. In
addition to these common WTL reliability concerns, the following areas were revealed as potentially specific
reliability concerns for D2W products:

 • Driver robustness: To aesthetically look like an incandescent lamp, D2W drivers must incorporate new
 logic circuits while maintaining a compact footprint to fit into the traditional A-style lighting
 infrastructure. The reliability of the new logic circuits and their effect on the reliability of the rest of the
 device is unknown.

 • LED materials: The CCT range of D2W products is lower than traditional LED sources, and the
 degradation pathways leading to luminous flux loss and chromaticity shift are unknown.

 • Dimmer compatibility: D2W products must be designed to work well with a variety of dimmers. As the
 device ages, it must maintain the same light quality with dimming.

This document is a follow-up report aimed at quantifying and understanding the reliability concerns of D2W
products. This report uses accelerated stress test (AST) studies to collect sufficient data to research failure
mechanisms and degradation of D2W products. This report focuses on the experimental findings and long-term
trends of seven D2W products: four D2W lamp products (referred to as Lamp A – Lamp D) and three

 2
Dim-to-Warm LED Lighting: Stress Testing Results for Select Products

integrated LED solution products or LED modules (referred to as Module E, Module F, and Module G). The
key parameters examined in this report include luminous flux, chromaticity maintenance, TLA (where
applicable), and power of the D2W products. This document relates the trends seen in these key parameters to
device architecture to provide and inform the lighting industry on the reliability and performance of this new
class of D2W products.

 3
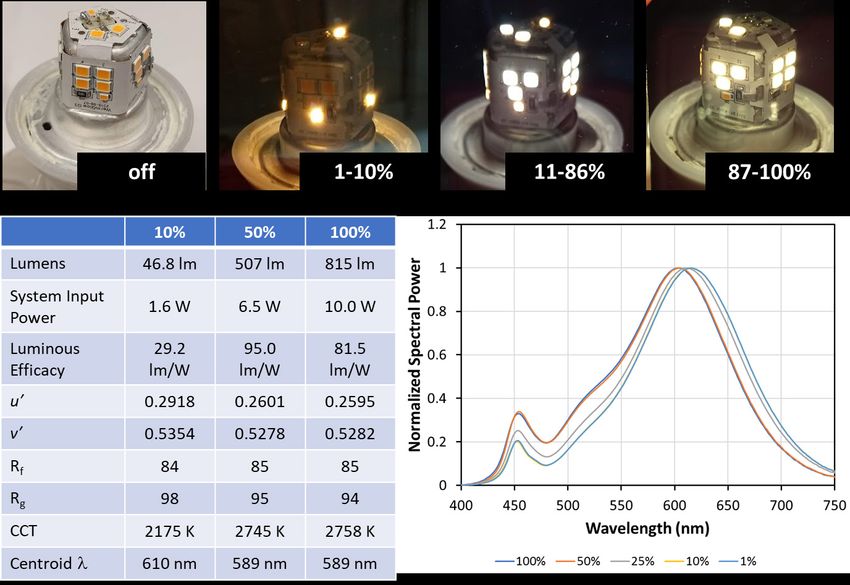
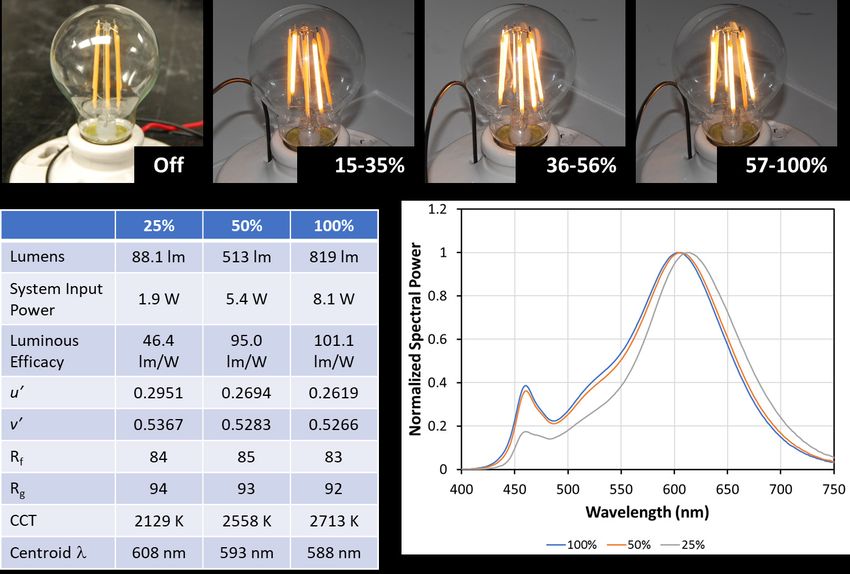
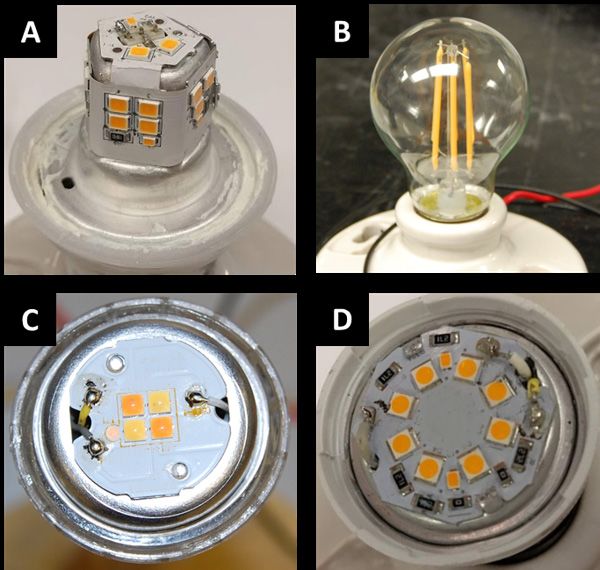
Dim-to-Warm LED Lighting: Stress Testing Results for Select Products

 Experimental and Analytic Methods
This report builds on our previous report about commercial D2W technologies that evaluated the different
architectures in D2W products, assessed the dimming performance of those architectures, and provided initial
characterizations for the products tested in this current report [1]. The experimental and analytic methods for
this report are geared toward explaining the necessary tools to evaluate the experimental AST findings.

 Samples
The commercially available devices under test (DUTs) examined in this study can be broadly categorized into
two groups as described in our previous report [1]: lamps consisting of multiple LED packages of different
CCT values and LED modules consisting of LED arrays in the chip-on-board (COB) or chip-scale package
(CSP) format. Within each of these groups, a variety of subclasses and architectures exist.

2.1.1 Lamp A – Lamp D
Representative D2W lamps were chosen in two different styles: A-lamp and candelabra. The examined Lamp
A – Lamp D and their initial characteristics, particularly their dimming performance compared to a traditional
incandescent lamp, were described fully in our previous report [1] but an outline is provided briefly here in
Table 2-1 and Figure 2-1. In general, the D2W lamps emitted light in the correlated color temperature (CCT)
range of 2,200 K to 2,700 K with a color rendering index (CRI) of at least 80. All lamps used two LED
primaries, 1 but two different approaches were used to achieve D2W performance as outlined in Section 1. The
lamps were tested as received in the temperature and environmental conditions.

 Figure 2-1. The D2W lamps examined during this study: (A) Lamp A, (B), Lamp B, (C), Lamp C, and (D) Lamp D.

1
 An LED primary is a group of LEDs of the same nominal CCT value that are connected together and operated in unison.

 4
Dim-to-Warm LED Lighting: Stress Testing Results for Select Products

 Table 2-1. Initial D2W Lamp Performance Characteristics.
 Light Output Input Power
 Lamp ID Lamp Type (lm) (W) CCT (K) CRI
 A A-lamp 800 9.5 2,200 – 2,700 80
 (standard)
 B A-lamp 800 8.5 2,200 – 2,700 80
 (filament)
 C Candelabra 345 5.0 1,800 – 2,700 90
 D Candelabra 450 5.5 2,200 – 2,700 80

The A-style lamps (Lamps A and B) had many similar key features: both were 60-W equivalent, had nominal
light output of 800 lumens, and used two sets of mid-power LED (MP-LED) primaries to achieve lamp
performance in the warm white CCT range (2,200 K – 2,700 K). However, the arrangement (standard LED
module vs. filament style), number (26 surface-mounted LEDs vs. 138 LEDs arranged in 6 filaments), and size
of the LEDs for Lamp A and Lamp B, respectively, were different as shown in Figure 2-1 and discussed
previously [1]. The candelabras (Lamps C and D) required similar input power to each other but varied
substantially regarding light output, number and type of LEDs (4 LEDs vs. 10 LEDs), and D2W architecture
(when no dimming was applied to the lamps, both LED primaries of Lamp C emitted light [Architecture 2]
while only the higher CCT LED primary emitted light for Lamp D [Architecture 1]). The chromaticity points
of the LED primaries for Lamps A – D are shown in Figure 2-2 for clarity. A full analysis of dimming levels
and their effects on SPD, power, and TLA for Lamps A – D is provided in Appendix A.

 Figure 2-2. The chromaticity points (u’ and v') of Lamps A – D are plotted on the 1976 CIE diagram. The
 behavior approximates the black body curve as the lamps are dimmed from a starting point of
 approximately 2,700 K to between 1,800 – 2,200 K, depending on the product model. The relevant
 American National Standards Institute (ANSI) color bins as defined by ANSI C78.377A are provided as
 a guide.

 5
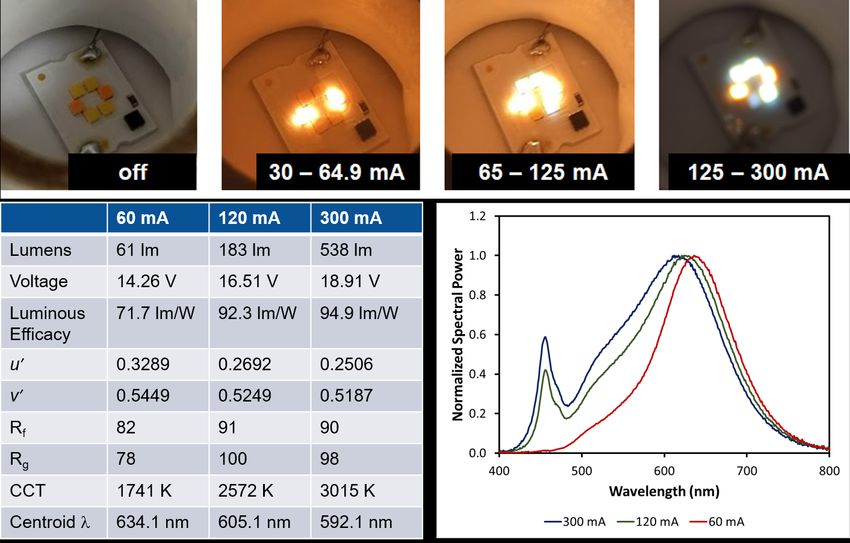
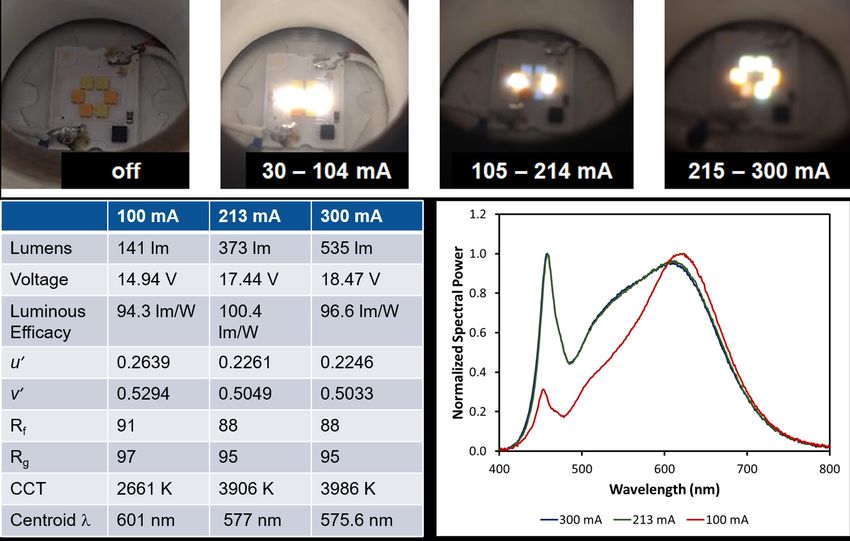
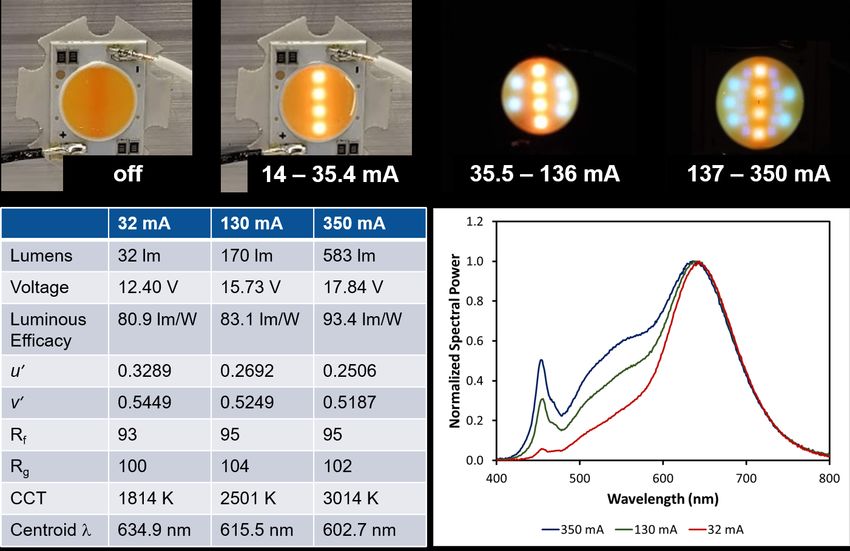
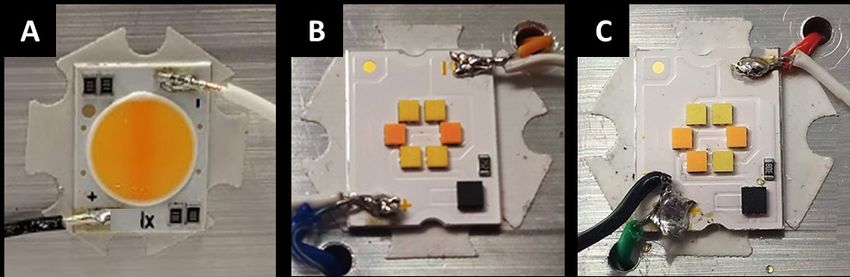
Dim-to-Warm LED Lighting: Stress Testing Results for Select Products

2.1.2 LED Modules
Representative LED modules were chosen with COB and CSP form factors. Three different types of LED
modules were examined in this work (Module E, Module F, and Module G) as shown in Table 2-2 and Figure
2-3. The modules examined in this work have similar light output, input power, and CRI. Module E and
Module F provided D2W performance in a low-CCT range (nominally 1,800 K – 3,000 K), which
encompasses the CCT range of Lamps A – D. Module G provided D2W performance in a higher CCT range
(nominally 2,700 K – 4,000 K) than the rest of the D2W technologies examined in this study, likely in an
effort to provide a D2W analog for halogen lamps. Module E had 21 die mounted on a printed circuit board
(PCB), and the die were covered with a phosphor-containing encapsulant (Figure 2-3A). Two different
phosphor mixtures were patterned in the encapsulant for Module E; a darker orange phosphor strip down the
center of the COB created the lower CCT emission (1,800 K) and a lighter orange phosphor on both sides of
the strip provided the higher CCT emission. Module F and Module G both had six CSPs mounted to a PCB
and the CSPs had two different phosphor formulations to provide higher and lower CCT primaries. The
dimming method was similar for all three LED modules as discussed in our previous report [1]: all LEDs
operated at high current and as the current was lowered, one or more LEDs were shut off until only the warm
LEDs remained on at the lowest current settings. A full analysis of input direct current (dc) and how it relates
to spectral and power changes for the LED modules is provided in Appendix B.

 Table 2-2. Initial Characteristics of Integrated LED Solutions.
 Light Output Input Power
 LED Module ID LED Package (lm) (W) CCT (K) CRI
 Module E COB 565.2 6.2 1,823 – 3,020 95
 Module F CSP 514.7 5.5 1,778 – 3,046 90
 Module G CSP 533.5 5.5 2,672 – 4,009 92

 Figure 2-3. The D2W Integrated LED solutions examined in this study: (A) Module E, (B) Module F, and
 (C) Module G.

 Stress Testing Methods
The samples of each type of lamp or LED module were separated into three populations consisting of three
DUTs. There was one population for each of three conditions: room temperature operational life (RTOL), a
temperature bake at a mildly elevated temperature of 45°C (45OL), and a temperature and humidity soak at
65°C and 90% relative humidity (6590). Either a temperature oven or a temperature-humidity environmental
chamber was used for these tests. Humidity was not explicitly controlled in RTOL or 45OL, and the ambient
humidity was determined by the air handling system of the building. All DUTs were power cycled as described
later in this section.

 6
Dim-to-Warm LED Lighting: Stress Testing Results for Select Products

For this study, the lamps were mounted in porcelain lampholders and operated upright. A single aluminum
heat sink was used to mount three COB (or CSP) DUTs, making a COB (CSP) module, as shown in Figure
2-4. The COBs (CSPs) were wired in series so that the module could be operated by a single dimmable driver
during testing, but they were also wired in a way that allowed them to be individually controlled by relay
switches so that performance could be measured for individual COB/CSP samples. The drivers for the COBs
(CSPs) were kept external to the test chamber and experienced only room temperature environments during
testing.

 Figure 2-4. Test configuration for the Module E DUTs examined in this study.

2.2.1 Lamp Power Cycling
During all operational life tests, a Wink wireless control system consisting of a Wink Hub 2 and Z-Wave
dimmers was used to set power (or dimming) levels for Lamp A – Lamp D. The Z-Wave dimmer is a phase-
cut dimmer and, as explained in Section 2.1.1 and Appendix A, different dimming signal behavior was
observed for the different lamps connected to the dimmer. Therefore, each lamp style (A – D) was controlled
by a separate Z-Wave dimmer during power cycling. In general, setting the Z-Wave dimmer to 10% or 25%
(deep dimming) activated only the lower CCT LED primary for the lamps, while setting the dimmer to 50%
activated both lower and higher CCT primaries, giving an SPD with intermediate CCT. When the Z-Wave
dimmer was set to 100% (no dimming), the higher CCT LED primaries were active and the lower CCT
primaries were not active in some cases (Lamps A, B, and D); all LED primaries were active for Lamp C at
100% dimming. To maximize changes in temperature and CCT, the devices were power cycled through a
repeating four-step dimming cycle of: 1) 100%, 2) 10% or 25%, 3) 50%, and 4) no power as shown in Table
2-3.

 Table 2-3. Dwell Times at Each Dimming Level for Lamp A – Lamp D and the Total Time It Takes to Complete
 the Four-Step Process.
 Maximum Low Power Mid Power No Power Total Length of
 Lamp ID Power (100%) (10% or 25%)a (50%) (off) Dimming Cycle
 A 30 mins 40 mins 32 mins 42 mins 144 mins
 B 28 mins 32 mins 28 mins 32 mins 120 mins
 C 40 mins 40 mins 50 mins 50 mins 180 mins
 D 40 mins 46 mins 32 mins 42 mins 160 mins
a Low power was set to 10% for Lamp A and low power was set to 25% for Lamps B, C, and D.

 7
Dim-to-Warm LED Lighting: Stress Testing Results for Select Products

The dwell time at each of the power settings in Table 2-3 was customized for each lamp style to ensure that
maximum thermal changes were achieved. To customize the dwell time, the thermal profile of the lamps were
monitored with chromel/alumel thermocouples and the lamps were cycled through the four-step process at
ambient room temperature; initial dwell times of 60 minutes were chosen because 60 minutes is normally
sufficient time for LED junction temperatures to equilibrate at room temperature. When the dimming setting
was changed, the lamp would warm up or cool down (depending upon whether it was going from low power to
high power or high power to low power, respectively) and then plateau at a stabilized temperature (Tstable). To
maximize the number of switching cycles in a 24-hour period, the dwell time at each dimming level was set to
the amount of time it took for the temperature to reach 95% (T95%) of its stabilization temperature where T95%
was calculated according to Equation 2-1 and Tstart represents the temperature just prior to switching the
dimming level.

 95% = 0.95 × (Tstable − Tstart ) (Eq. 2-1)

A representative thermal profile of one of the DUTs is provided in Figure 2-5. The T95% temperatures at each
dimming level are represented by red X’s and the start time for each dimming cycle is highlighted with a
vertical blue dashed line (Figure 2-5A). In Figure 2-5B, the temperature points are labeled for the switch from
25% dimming to 50% dimming. After the dwell times were calculated by this method, the dwell time at each
dimming level was equally increased until the total minutes in the four-step process was a factor of the total
minutes in a 24-hr period as shown in Table 2-3.

Figure 2-5. Thermal profile of a Lamp D DUT showing (A) start times (vertical dashed blue lines), T95% (red X’s),
time at T95% (vertical dashed red lines), and dwell time necessary to reach T95% (horizontal double-sided black
 arrows with time labels), and (B) Tstart, Tstable, and T95% for the transition from 25% to 50% dimming.

2.2.2 LED Module Power Cycling
The LED modules (i.e., Module E, Module F, Module G) were also power-cycled with a four-step process:
1) high current, 2) low current, 3) medium current, and 4) no current (off). The behaviors of Module E,
Module F, and Module G differed with input dc as shown in our previous report [1] and Appendix B of this
report. Therefore, the input dc levels for “low,” “medium,” and “high” current settings were customized for
each LED module to maximize changes in temperature and CCT as shown in Table 2-4. For all LED modules,
the four-step power-cycling process repeated every 4 hrs, with each step operating for 1 hr before switching to
the next step. During testing, dc was supplied to the COB (CSP) modules by Philips Xitanium dimmable LED
drivers set on timers to maintain an accurate 4-hr loop.

 8
Dim-to-Warm LED Lighting: Stress Testing Results for Select Products

 Table 2-4. Current Levels Used During Power Cycling for the Integrated LED Solutions.
 Integrated ID High Current (mA) Medium Current (mA) Low Current (mA)
 Module E 350 130 32
 Module F 300 120 60
 Module G 300 213 100

 Measurement Methods
2.3.1 Luminous Flux
The SPD, luminous flux, and chromaticity measurements were obtained in a calibrated 65-inch integrating
sphere with each sample mounted in the center of the sphere (4π geometry). Regular calibrations of the
integrating sphere were performed using a calibrated spectral flux standard that was traceable to standards
from the National Institute of Standards and Technology (NIST). Background corrections were applied prior to
calibration. Self-absorption corrections were made for all samples by using an auxiliary lamp mounted inside
the sphere, which is in accordance with procedures in the joint ANSI and Illumination Engineering Society
(IES) standard ANSI/IES LM-79-19 [6]. Power was supplied to Lamp A – Lamp D using a designated Z-Wave
dimmer, and SPDs were measured at two dimming levels: 100% and low power (10% or 25%). Constant dc
power was supplied to the COB and CSP modules inside the integrating sphere using a Keithley 2400
SourceMeter, and external connections were made to operate only one COB (CSP) in the integrating sphere at
a time. SPDs were measured at two input dc levels: high current and low current.

2.3.2 Flicker and Temporal Light Artifacts
Initial flicker and other TLA were measured for Lamp A – Lamp D using a handheld flicker meter mounted on
a small integrating sphere placed over each DUT lamp. The measurements were made at low, medium, and
max power settings (controlled by the Wink wireless system) using a handheld GigaHertz-Optik S-BTS256
spectral flicker meter. As shown in our previous report [1], the measured TLA metrics provide information on
a lamp’s compatibility with the chosen commercial dimmer (Z-wave dimmer) and do not necessarily reflect its
compatibility with other dimmers. However, information about the degradation of the circuits necessary to
provide D2W performance in the test lamps can be gained by observing the TLA metrics with time. Therefore,
the TLA metrics of Lamp A – Lamp D were monitored as needed throughout testing. TLA metrics were not
obtained for the COB and CSP DUTs.

2.3.3 Electrical Properties
Electrical properties (such as power consumption and power factor) of Lamp A – Lamp D were measured
during photometric testing by using an electrical usage monitor on the ac mains. All measured electrical
properties for Lamp A – Lamp D included power losses from the Z-Wave dimmer unless otherwise noted. For
the COBs and CSPs, voltage measurements were obtained from the Keithley 2400 SourceMeter as it supplied
input dc during photometric testing.

 9
Dim-to-Warm LED Lighting: Stress Testing Results for Select Products

 Results and Discussion
 Lamp A – Lamp D
As originally reported, Lamp A – Lamp D were purchased in the summer of 2018 from local big-box retail
stores. The initial SPDs from the lamps at low and maximum power (as defined in Table 2-3) are shown in
Figure 3-1. The centroid wavelengths (λc) of the blue LED pump (λc, blue LED) and phosphor emissions (λc,
phosphor) at both low and maximum power were calculated from the SPDs and are shown in Table 3-1. Aside
from relative intensities, the lamp products have similar SPDs, with notable differences for the centroid
wavelength of the blue LED pump for Lamp B and phosphor centroid wavelengths of Lamp C.

This section of the report discusses how the lamps age within the various ASTs and how the aging affects lamp
SPDs and electrical performance. Section 3.1.1 discusses changes to luminous flux maintenance (LFM),
Section 3.1.2 discusses chromaticity changes, Section 3.1.3 characterizes failure modes for the lamps, Section
3.1.4 evaluates changes to electrical power, and Section 3.1.5 assesses TLA metrics of the aged lamps. The
data and results presented in this report are the average of populations of lamps at each respective AST
condition. As mentioned in Section 2.1, the test population size for all lamps and LED modules started at three.
Over the course of testing, seven lamp failures were observed. The test population (and data averaging)
excluded failed lamps (abrupt or parametric failures) from the failure time onward. 2 Parametric failures were
only excluded for the power level at which the failure occurred and in subsequent measurements. In this report,
parametric failures are defined as samples that exhibited an LFM value below 0.70 or exhibited a chromaticity
shift in excess of ∆u'v' ≥ 0.007.

 Figure 3-1. Initial SPDs of the control DUTs for Lamp A – Lamp D at (A) low power and (B) maximum power.

 Table 3-1. Centroid Wavelengths of the Blue LED and Phosphors for Lamp A – Lamp D.
 Lamp ID λc, blue LED λc, phosphor λc, phosphor
 (max power) (low power) (max power)
 A 454.5 nm 617.9 nm 602.1 nm
 B 459.7 nm 616.4 nm 601.3 nm
 C 454.5 nm 625.9 nm 608.6 nm
 D 454.4 nm 618.0 nm 603.2 nm

2
 Only sharp decreases in LFM or sharp changes to chromaticity were excluded from data averaging.

 10
Dim-to-Warm LED Lighting: Stress Testing Results for Select Products

3.1.1 Luminous Flux Maintenance
Samples of each lamp type completed either 11,000 hrs of RTOL, 9,000 hrs of 45OL, or 7,000 hrs of 6590,
and the LFM value of the lamps are shown in Figure 3-2 and Figure 3-3. The A-style lamps (Lamp A and
Lamp B) had generally high LFM values (above 0.80) at both low and maximum power at all AST test
protocols (Figure 3-2) while the candelabra-style lamps had lower LFM (below 0.80) at the most aggressive
AST test protocol (i.e., 6590 test conditions, see Figure 3-3).

Figure 3-2. Average LFM for the populations of A-style lamps: (A) Lamp A at dimming to 10% power, (B) Lamp A
 at 100% power (i.e., no dimming), (C) Lamp B at dimming to 25% power, and (D) Lamp B at 100% power (i.e.,
 no dimming).

 11
Dim-to-Warm LED Lighting: Stress Testing Results for Select Products

Figure 3-3. Average LFM for the populations of candelabra-style lamps: (A) Lamp C at dimming to 25% power,
(B) Lamp C at 100% power (i.e., no dimming), (C) Lamp D at dimming to 25% power, and (D) Lamp D at 100%
 power (i.e., no dimming).

For Lamp A, LFM was statistically lower for DUTs operated in 6590 test conditions at both low and maximum
power levels. There was no statistical difference in LFM between DUTs operated at RTOL and 45OL at either
power level. In general, sample-to-sample LFM variation remained low for Lamp A DUTs throughout all
ASTs as represented by the error bars in Figure 3-2A and Figure 3-2B. There was, however, one DUT (DUT
457, a Lamp A DUT) that behaved differently at low power than the other Lamp A DUTs operated at RTOL
(its LFM dropped steadily to 0.88 while the other two DUTs maintained LFM above 1.03). DUT 457 was
purchased about two weeks prior to the rest of the test population. As the gap between DUT 457’s performance
and the rest of the DUTs in RTOL widened, a fourth device was added to the RTOL test matrix. The fourth
device (DUT 456) was purchased at the same time as DUT 457 and displayed similar LFM behavior to DUT
457 for the duration of its test period (5,000 hrs) as shown in Figure 3-4. The difference in performance
between the two test populations could be a manufacturing flaw, a consequence of slight variations in
components used, components manufacturer change, or a deliberate change in design by the lamp
manufacturer. Further investigations of the root cause are not possible at this time without destroying the
samples. No matter the cause, changes in dimming performance could impact end users to an undesirable level,
and the researchers found that small purchase date changes (less than one month) also affected other lamps
(e.g., the TLA metrics of Lamp D, not shown in this report). Effort was made to have homogeneous starting
populations so that comparisons could be made across AST protocols and within AST protocols.

 12
You can also read