Supply of and Demand for Pollination Hives In New Zealand
←
→
Page content transcription
If your browser does not render page correctly, please read the page content below
Supply of and Demand for Pollination Hives In
                 New Zealand

          A briefing paper prepared for the Strategic Pollination Group

Acknowledgements
The authors would like to thank the MAF Sustainable Farming Fund and pollination
industry related sectors for providing the funding for this briefing paper. We also
acknowledge the beekeepers and the industry representatives who responded to the
surveys underpinning this work.

Authors
Dr Mark Goodwin has 25 years of experience in honey bee and pollination research.
Mark leads the HortResearch honey bee research team based in Hamilton which
carries out most of the honey bee research in New Zealand. The team also conducts
research on the effect of pesticides on bees, provides disease diagnostic services for
the New Zealand beekeeping industry and conducts research on the pollination of a
range off crops in New Zealand and other countries.

Sandy Scarrow is a horticultural consultant with Fruition Horticulture (BOP) Ltd a
company she part owns. She was previously with Agriculture New Zealand and MAF
in Whakatane before shifting to Tauranga. She works closely with the kiwifruit and
avocado industries and has involvement with other projects relevant to primary
producers.

Michelle Taylor is an apicultural scientist with HortResearch. Michelle has been
closely involved with the beekeeping industries in both New Zealand and the United
States of America for the past nine years. Currently she is involved with the
programme designed to develop technologies for the control of varroa to ensure that
enough insect pollinators remain in New Zealand’s environment.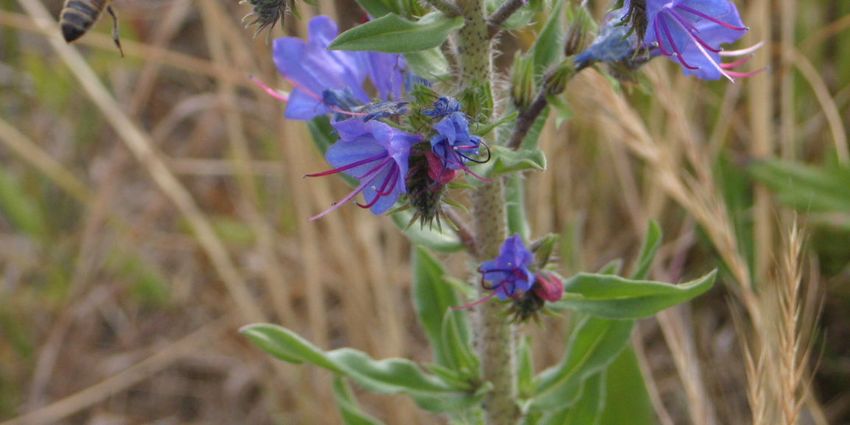
Table of contents
OVERVIEW.................................................................................................................. 1
INTRODUCTION......................................................................................................... 2
CHANGES IN PLANTED AREA ............................................................................. 4
     Hives used in pollination....................................................................................... 4
     Demand for hives between the North and the South Island.................................. 7
     Availability of additional hives ............................................................................. 9
     Trends in beekeeper numbers and hive numbers in the North and South Island 10
     Beekeeper numbers ............................................................................................. 10
     Honey bee hive numbers ..................................................................................... 11
     Managed colonies................................................................................................ 11
     Feral colonies ...................................................................................................... 13
ADDITIONAL THREATS TO HIVE SUPPLIES................................................. 13
  1) Future effects of varroa....................................................................................... 13
  2) Toxic Honey........................................................................................................ 15
  3) Plant alkaloids..................................................................................................... 17
  4) Exotic pests and diseases of honey bees ............................................................. 17
     European foulbrood............................................................................................. 17
     Small hive beetle ................................................................................................. 18
     Tracheal mite....................................................................................................... 19
     Tropilaelaps......................................................................................................... 19
     Africanised bees .................................................................................................. 19
     Cape Honey Bee.................................................................................................. 20
CONCLUSIONS........................................................................................................ 20
APPENDIX 1 .............................................................................................................. 22
APPENDIX 2 .............................................................................................................. 24
APPENDIX 3. ............................................................................................................. 26
APPENDIX 4. ............................................................................................................. 28
OVERVIEW
Pollination of most flowering plants in New Zealand, with the exception of grass
species, occurs either partly or fully by insect activity. Of all insects, honey bees are
the most effective pollinators of commercial crops as their population per colony is
far larger than any other pollinator species. Although introduced bumble bees, native
solitary bees, flies, wasps and other insects contribute to pollination, they cannot be
relied upon as they have insufficient numbers or they are not always present.
Without honey bees most of our horticultural and cropping industries would no longer
be economically viable. The persistence of clover in pasture, especially with the
additional pressure of clover root weevil may also be compromised. Currently, the
peak demand for pollination hives occurs in November when an estimated 88,675
hives are required for pollination. Of this peak, 78% of the hives are required in the
North Island. With the anticipated increase in crop plantings, it is estimated that the
peak number of hives required in November will lift to 103,150 hives in 2010 and
108,675 in 2015. Approximately 80% of these hives are required in the North Island.
Whilst the requirement for honey bee pollination of crops has been increasing, the
number of beekeepers and the number of beehives in New Zealand has steadily been
declining. Since the introduction of varroa to the North Island almost all feral
colonies and at least 20% of the managed colonies in the upper North Island, where
varroa has been the longest, have disappeared. Based on experiences from countries
where varroa has been present for longer than New Zealand, larger declines in hive
numbers are to be expected. This is mainly due to varroa developing resistance to the
control chemicals currently in use. In 2005 the USA imported hives from Australia to
pollinate their almond crops due to the insufficient supply of USA hives. When hive
supplies become insufficient for pollination in New Zealand, live bees cannot be
imported because of the risk of importing honey bee pests and diseases currently not
present in New Zealand.
Additional circumstances that may further erode hive numbers include the
introduction of additional honey bee pests to New Zealand. Observations of their
worldwide spread indicate that it is only a matter of time before they are found in
New Zealand. There are also a number of plant compounds that if found in honey
may have an adverse effect on the honey market.
Perhaps the largest threat to the availability of hives is economics. World honey
prices are currently declining and may decline to such a level that many beekeeping
operations will no longer be profitable. This will have the largest impact on
beekeeping operations whose major source of income is clover based honey
production. However, beekeepers providing pollination services will also be affected
as almost all of them gain some income from honey production. If honey prices were
to reduce to the level in 2000, beekeepers predict that hive numbers will reduce by at
least 25%.
The increasing demand for managed hives for pollination is likely to put considerable
pressure on hive supplies and increase prices. Whether this is sufficient to encourage
beekeepers to increase the number of hives they use for pollination or attract new
beekeepers to the industry is unknown.

                                                                                       1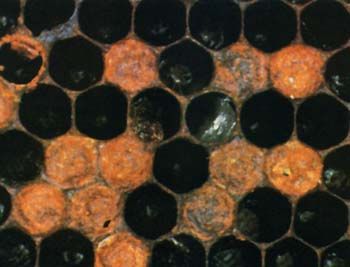
INTRODUCTION
Pollination of most flowering plants in New Zealand, with the exception of grass
species, occurs either partly or fully by insect activity. Of all insects, honey bees
(Apis mellifera) are the most effective pollinators of commercial crops as their
population per colony is far larger than any other pollinator species. Although
introduced bumble bees, native solitary bees, flies, wasps and other insects contribute
to pollination, they cannot be relied upon as they have insufficient numbers or they
are not always present.

Without honey bees most of our horticultural and cropping industries would no longer
be economically viable. The persistence of clover in pasture, especially with the
additional pressure of clover root weevil may also be compromised.

The introduction of varroa (the parasitic bee mite) into New Zealand means that
honey bees can no longer survive without human intervention in areas where varroa is
present. Pollination services provided by the feral honey bee population, hobby
beekeepers and commercial beekeepers are no longer guaranteed.

Because of varroa, only a few feral colonies still exist in the North Island. Varroa has
yet to be found in the South Island but judging from how quickly it has spread across
the world this will happen in the near future. Although there is a pest management
strategy designed to eradicate varroa from the South Island when it arrives this is
likely to only delay its eventual establishment.

The numbers of hives required for pollination depends on a number of factors. These
factors include, but are not limited to:
     o the attractiveness of the flower to bees
     o the need for cross pollination for fruit or seed development
     o the economic conditions for the crop
     o the presence of managing or feral colonies in the surrounding environs.

This briefing paper summarises future trends in pollination hive requirements and
pollination hive availability. The trends are based on a survey of beekeepers and
primary industry projections. In order to gauge the level of demand for pollination
hives over the next 10 years, the industry representatives were asked to confirm the
area of crop in production now, confirm the typical number of hives introduced to
pollinate the crop and what time of year, plus estimate any planned changes in planted
area.

At present some of the surveyed industries such as citrus and strawberry do not
typically introduce hives for pollination. With the reduction of feral bee populations
resulting from varroa, it is not known whether the level of pollination of these crops
will remain sufficient without the purposeful introduction of hives. If the introduction
of managed hives for pollination proves necessary for these crops in the future, the
following estimates of pollination hive demand will be even higher.

A summary of other external factors which may impact on honey bee availability is
also provided (e.g. arrival of new pests or sub species of bees). The aim of this
briefing paper is to provide information that can be used to form the basis of a

                                                                                      2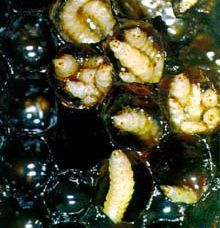
strategy to ensure that pollination of crops, which is essential to the continued
wellbeing of New Zealand’s primary industry economy, is not compromised,

To determine the number of colonies available and the number of colonies required,
two surveys were conducted. The first involved commercial beekeepers and the
second survey involved people representing a range of horticultural and arable crops
that rely on honey bee pollination.

A total of 155 (54%) beekeepers returned completed beekeeper survey forms. These
beekeepers own 202,000 colonies which represent 69% of the New Zealand hive
holdings. The beekeeper survey asked questions on the size and location of the
apiary, the percentage of hives the beekeeper supplied for pollination and potential
changes in their pollination business (appendix 2).

Thirteen representatives from the horticultural and arable cropping sector were asked
to participate in the second survey. Telephone follow up resulted in a 100% survey
response. To determine the split of the crops between the North and South Island
published data1 was coupled with data from industry survey respondents by telephone
and email. The survey to determine the demand for pollination hives concentrated on
the area planted in crops requiring hives for pollination, any expected changes in that
area in 2010 and 2015 and the number and timing of hives introduced for pollination.
A copy of the beekeeper survey and an example of the industry survey is appended
(appendix 3).

1
    FreshFacts 2005, HortResearch ISBN 0-477-10014-7

                                                                                       3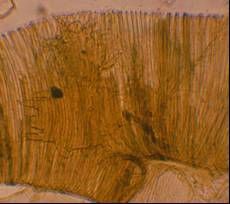
CHANGES IN PLANTED AREA
Table 1 provides an estimate of the area planted in various crops currently and the
best estimates of changes in area in 2010 and 2015. The estimates have been rounded
to the nearest 5 ha.

Table 1 Estimate of area planted in various crops currently, in 2010 and in 2015.
Area Planted (ha)
Crop                           Current   2010 (est)   2015 (est)   Comment
Apples                         12,150    10,000       10,000
Clover (for seed)              10,000    12,000       13,200
Kiwifruit Green                8,680     10,000       10,000
Squash                         8,440     8,440        8,440
Brassicas (for seed and oil)   5,000     6,000        6,000
Avocado                        4,310     6,170        7,400
Kiwifruit Gold                 1,750     2,000        2,500        PVR runs out in 2018
Radish (for seed)              1,500     1,725        1,725
Blackcurrants                  1,310     1,380        1,400
Pears                          910       1,500        2,000
Peaches                        810       890          890          More plantings may occur if the
                                                                   fortunes of the pipfruit industry do
                                                                   not improve.
Carrots (for seed)             750       975          975
Apricots                       635       795          955
Cherries                       550       690          825
Nectarines                     528       580          580          More plantings may occur if the
                                                                   fortunes of the pipfruit industry do
                                                                   not improve
Kiwifruit Green Organic        510       510          510
Blueberries                    430       515          620
Plums                          395       415          435
Raspberries                    300       200          100
Boysenberries                  240       245          245
Blackberries                   115       50           50
Kiwifruit Arguta               25        20           20

It is estimated by industry participants that the area in most crops is going to increase.
The significant increases are in the area planted in avocados, brassicas, clover for seed
green and gold kiwifruit and pears. It is estimated that the area planted in apples will
decline.

Hives used in pollination

Table 2 provides detail on the number of hives that are introduced per hectare for
particular crops. The table attempts to merge best practice with typical industry
practice. Where significant differences between the two exist, comment is provided.

                                                                                                     4
Table 2 Number and timing of pollination hives introduced per hectare.
Crop Month Month Hive Requirements
Comment
Bees In Bees Out (hives per hectare)
Apples Sept Oct 4 It is estimated that only 25%
of growers introduce hives.
This will increase due to
issues with poor pollination in
the 2005 spring thought to be
related to low bee numbers.
Apricots Aug Sept 8
Avocado Sept Nov 10 Though the recommendation
is for 10 hives per hectare it is
unlikely that more than 5
hives per hectare are
introduced
Berry fruit
o Blackberries Oct Oct 6
o Blackcurrants Oct Nov 5
o Blueberries Aug Oct 1
o Boysenberries Oct Oct 6
Brassicas (for oil Oct Jan 3
and seed)
Carrots Dec Jan 5
Clover Dec Jan 3
Kiwifruit Arguta Oct Oct 10
Kiwifruit Gold Oct Oct 6
Kiwifruit Green Nov Dec 8
Kiwifruit Green Nov Dec 8
Organic
Pears Sept Oct 6
Radish Nov Mar 3
Raspberries Nov Nov 6
Squash Dec Feb 2
Summerfruit
o Cherries Sept Oct 10
o Nectarines Aug Oct 5
o Peaches Aug Oct 5
o Plums Aug Oct 8
The peak demand for hives occurs in November when many crops are flowering. It is
estimated that a maximum of 88,675 hives are currently required to pollinate crops in
November (Fig. 1). If growers were to use the full complement of hives
recommended, this peak demand could lift to 117,675 hives. To assist in
presentation, some of the smaller crops with less demand for hives have been
amalgamated into an ‘other’ category and summerfruit crops have been amalgamated
(Fig. 1).
5100000
90000
80000
70000
Estimated Hive Demand
60000
50000
40000
30000
20000
10000
0
August September October November December January February March
Month
Kiwifruit Green Avocado Apples Kiwfruit Gold
Blackcurrants Brassicas Pears Kiwifruit Green Organic
Summerfruit Clover Squash Other
Figure 1. Estimate of Current Demand for Pollination Hives by Month.
With the increase in area expected to be planted (predominantly green kiwifruit and
avocados) and the anticipated increased use for hives in apple pollination, the peak
demand increases to 108,150 hives by November 2010 and 118,675 hives by 2015. If
growers were to introduce the recommended levels of hives into their orchards these
figures would increase to 133,575 and 142,175 respectively (Fig. 2 and 3).
Figure 2. 2010 Projected demand for pollination hives by month.
6Figure 3. 2015 Projected demand for pollination hives by month.
Demand for hives between the North and the South Island
Given the peak month for hive demand is November, it is worthwhile to consider
where these hives are required. Currently, the movement of bees from the North
Island to the South Islands is restricted in an attempt to extend the time period before
varroa infests South Island apiaries. This movement control means that any hives that
are moved from the South Island to the North Island to avert any temporary shortage
of hives in the North Island cannot be returned to the South Island.
An analysis of the demand for hives shows that of the 88,675 hives currently required
in November for pollination, a significant proportion of these are required in the
North Island. Of the key crops2 requiring hives during this month, 78% (66,600) of
them are required in the North Island. This is projected to increase to nearly 80%
(80,600 hives) in 2010 and 2015 (87,500 hives). In Figure 4, further detail is
provided on the current and projected hive demand in the two main islands in the
month of November.
2
Analysis of the locational requirements of some of the crops requiring fewer hives was not done.
7Figure 4. Current and projected hive demand for key crops in the North and
South island for November.
If growers were to introduce hives at the rate recommended, these peak levels for
hives in the North Island in November would increase significantly from 85,100
currently, to 96,875 in 2010 and 102,500 in 2015 (Figure 5).
120,000
Blackcurrants
100,000 Pears
Hive Demand
80,000 Kiwifruit Green Organic
Estimated
Apples
60,000
Brassicas
40,000 Kiwifruit Gold
20,000 Avocado
Kiwifruit Green
-
North
South
North
South
North
South
Is
Is
Is
Is
Is
Is
November November November
Currently 2010 2015
Time Period and Island
Figure 5. Current and projected hive requirements for key crops in the North and
South Island for November, if hives are introduced at recommended rates.
8In the South Island, a peak demand of 28,460 hives are required for current
pollination. The peak occurs in December with the major crops being brassicas,
carrots and clover.
Currently there are only 128,519 hives in the South Island. The South Island
beekeepers that were surveyed represented 85,350 (66%) hives. They considered that
only 51% (65,545) of hives would be strong enough for pollination. The survey
indicates that only 47,000 hives are used for pollination. However, there is an
anomaly with the surveys because there are an additional 14,000 hives in Canterbury
that are owned by beekeepers who have catergorised these hives as honey collectors
and not pollination hives. These same 14,000 colonies are considered by the owners
of clover seed crops to be conducting pollination. These 14,000 colonies are therefore
included in the following calculation.
If 51% of the colonies from the beekeepers that responded are suitable for pollination
this totals 31,110 hives. If this is projected for the South Island then 41,687 hives
would currently be suitable to conduct pollination. Hence the current supply of hives
is sufficient.
In 2015 the number of hives required for pollination increases to 35,800. The
predicted number of hives available for pollination in 2015 is 41,376. This is
sufficient to conduct pollination. However, it is unknown what impact varroa will
have on hive numbers. When varroa is found in the South Island, the number of hives
may decrease by 24% as they did in the North Island. If this occurs and it is coupled
with a decrease in honey price there would be a shortfall of 72,950 hives by 2015. In
appendix 4 the impact of four likely scenarios have been estimated.
The effect of reduced hive numbers on the pollination of clover present in pasture is
not clear. This is mainly because the level of seed set required to maintain clover in
pasture is unknown.
Availability of additional hives
Eighty-five percent of the beekeepers surveyed in the North Island carried out
pollination using an average of 69% of their hives. In the South Island 48% of the
beekeepers surveyed carried out pollination using an average of 53% of their hives.
The percentage of hives used for pollination appears to depend on proximity to crops
requiring pollination. For example, in the North Island the 18 beekeepers that
supplied 90% of their hives for pollination had their hives situated in the Waikato or
Bay of Plenty, close to kiwifruit and avocado crops. Of the 19 beekeepers supplying
less than 60% of their hives for pollination only two were from the Waikato or Bay of
Plenty.
The income from hive rental was the most common reason given for being interested
in supplying more hives for pollination. If areas were short of hives it is probable that
beekeepers would move hives from large distances if the rental prices were attractive
enough. However, it should be noted that not having to move hives large distances
was also a significant factor in not supplying hives.
9The relationship between hive price and willingness of beekeepers to provide hives
for pollination is unclear. The increase in the price of hives used for kiwifruit
pollination ($100 – $160/hive) did not result in an increase in the number of
beekeepers carrying out pollination. Beekeepers did not indicate that they would be
more inclined to carry out pollination if honey prices were significantly lower. If
honey collection became uneconomic beekeepers indicated that they would no longer
keep bees rather than change their income stream to conduct more pollination. In
many cases this was due to the large distances involved in moving hives and the
negative aspects of carrying out pollination including working at night and heavy
lifting.
The lack of an obvious connection between willingness to carry out pollination and
the economics of providing hives is unexpected and should be treated with caution.
Trends in beekeeper numbers and hive numbers in the North and
South Island
The data on managed hive 4500
numbers in New Zealand come South Island
from information collected under 4000 North Island
the Apiaries Act before 2000 and 3500
since then under the Biosecurity
Beekeepers
Act. Every year all beekeepers 3000
are required to report the number
2500
of hives and apiaries that they
own. Although most hives are 2000
recorded some were not,
especially pre 2000 when a levy 1500
on hive numbers was charged. 1000
1988 1990 1992 1994 1996 1998 2000 2002 2004
Beekeeper numbers Year
Since 1990 there has been a Figure 6. The number of beekeepers in the
gradual decrease in beekeeper North and South Islands since 1990.
numbers in New Zealand (Fig.
6). The decrease has accelerated in the North Island since the arrival of varroa. This
is predominantly due to the reduction in number of hobby beekeepers. Beekeepers
owning less than 50 hives make up approximately 95% of the total number of
beekeepers but only own approximately 10% of the hives. The reasons for the decline,
prior to the arrival of varroa, are unclear. It is possibly due to beekeeping becoming
less attractive as a hobby with the trend toward metropolitan lifestyle. The reduction
since varroa is probably the result of many hobby beekeepers not having the skills or
interest in treating varroa and hence their hives dying. Whilst the loss of beekeepers
has probably had little effect on total hive numbers it has reduced the potential
number of skilled beekeepers who could have assisted in maintaining hive numbers.
Most of the 13,000 hives (approx.) owned by hobby beekeepers are situated in city
areas and not usually used for paid pollination.
10Of the beekeepers surveyed that currently provide, or intend to provide pollination
hives, North Island beekeepers could only commit 71% of their hives for pollination
on average and South Island beekeepers only 51%. The difference is probably due to
the colder spring conditions usually experienced in the South Island. This means that
there would only be 98,281 colonies available in the North Island and 41,376 in the
South Island.
Honey bee hive numbers
New Zealand’s honey bee population is made up of both managed and feral colonies.
Because the location of all managed colonies must be reported to the Management
Agency (National Beekepers Association) for the American foulbrood pest
management strategy, the approximate number of colonies present in New Zealand is
known. The number of feral colonies however, is unknown.
Perhaps the largest decline in beehives due to varroa has been in built up areas. This
has been exacerbated by some councils placing increasingly difficult restrictions on
beekeeping in cities. The net result has been many reports from home gardeners on
lack of pollination of vegetables and fruit trees. Although not a major economic issue
it is a quality of life issue for some people. The importance of this has not been
assessed.
Managed colonies
The number of managed colonies in New Zealand reached 340,000 colonies in 1990
but had declined to 320,000 in 2000 (Fig. 7). A low of 293,000 colonies was recorded
in 2005. Between 1995 and 2000 there was an increase in hive numbers most likely
associated with an increase in the price of honey. Since 2000 there has been a steady
decline in hive numbers, presumably because of varroa. This can be seen by
reviewing the spread of varroa in the North Island (Figure 8) and the number of
colonies in the upper and lower North Islands (Figure 9).
360
340
Hive number (X 1000)
320
300
280
260
1984 1986 1988 1990 1992 1994 1996 1998 2000 2002 2004 2006
Year
Figure 7. Number of colonies present in New Zealand.
11Figure 8. Spread of varroa in the North Island.
105
Percent of hives present in 2000
100
Upper North Island
95 Lower North Island
90
85
80
2000 2001 2002 2003 2004 2005
Year
Figure 9. Percentage of hives in the lower and upper North Island present in 2000.
When varroa was found in April 2000 a line was drawn across the centre of the North
Island (Fig. 8) beyond which hives or beekeeping equipment that might carry varroa
were not permitted to move south. The purpose of the line was to slow rather than
stop the southward spread of varroa, largely by restricting the movements of
migratory beekeepers. This line was removed in September 2003, as approximately
100 apiaries south of the line were known to be infested, meaning that it was no
longer cost effective to maintain this arbitrary boundary. With almost all of the
10,000-plus apiaries north of the line infested, having the line in place probably
12delayed the spread of varroa into the lower North Island by about two years. Varroa
can now be found in almost every hive in the North Island.
Since 2000 the number of colonies in the lower North Island has slightly increased.
Conversely, the number of managed colonies in the upper North Island decreased by
16% (21,601) in 2004 and 13% (17,789) in 2005. The losses would have been larger
if more than 10,000 hives had not been moved from the South Island to the upper
North Island.
Feral colonies
Feral colonies usually live in hollow trees, man made structures such as buildings and
bridges, and occasionally in caves. They are usually hard to locate and almost
impossible to count. The only estimate comes from information collected in the
Hamilton city area. During a public appeal, 104 feral colonies were identified. Many
of these were in public areas and none were reported twice suggesting the actual
number was much higher. In another location seven feral colonies were recorded
inhabiting the supports for a bridge. The number of feral colonies (pre varroa) is
probably related to the number of available nesting sites and food availability. There
were possibly, pre varroa between 10,000 and 50,000 feral colonies in each island.
Although not specifically studied in New Zealand varroa has probably reduced the
number of feral colonies by about 99%. Instead of feral colonies surviving for many
years, many are now annual. A swarm leaving a managed colony and establishing a
new colony in a suitable nesting site takes varroa with them. Varroa will then
multiply and kill this feral colony in about one year.
ADDITIONAL THREATS TO HIVE SUPPLIES
There are four major issues that will impact the supply of hives for pollination. These
include varroa, toxic honey, plant alkaloids and the introduction of exotic honey bee
pests and diseases. Although hive supplies can be increased rapidly, through the
splitting of hives in spring, the build up of these new hives can be too slow for their
use in pollination later in the season (November).
1) Future effects of varroa
Further varroa spread
It is expected that the hive numbers in the lower North Island will also decrease over
the next few years as the effects of varroa are fully felt. The pest management
strategy to keep varroa out of the South Island is likely to only delay the introduction
of varroa after which time varroa is likely to reduce colony numbers there as well.
Resistance
Resistance of varroa to control products is a problem worldwide. The pesticides we
have available are not sustainable long-term. There can be as many as 20 generations
of varroa each year and because varroa reproduce sexually they can quickly build up
resistance to chemical control products. In the USA varroa populations that cannot be
killed by any of the varroa control chemicals are present. This is part of the reason
the USA lost between 40-60% of their hives last winter and they had to start
13importing bees from Australia to pollinate their almond crop (Appendix 1). We
expect to start having hive losses due to resistance within the next five years.
Economics
Economics is a major problem for
varroa control. Varroa has 5.0
increased the costs of keeping bees
4.5
by between $30 - $50 per hive
when pesticides, labour and hive 4.0
losses are included. Fortunately, at
Price ($) per kg
the same time as varroa was found 3.5
in New Zealand, international 3.0
honey prices doubled (Fig. 10).
This was coincidence rather than 2.5
cause an effect. China which is an 2.0
important honey exporting country
was caught using an illegal 1.5
1994
1995
1996
1997
1998
1999
2000
2001
2002
2003
2004
2005
2006
antibiotic to control bee diseases.
Residues of the antibiotic were Year
detected in a number of their
Figure 10. Price per kg for clover honey since
markets and Chinese honey was
1994.
banned. This caused a dislocation
in the world honey market which in turn increased honey prices. The price increase
enabled beekeepers to absorb the increased varroa costs. Coupled with the increase in
honey price was the high honey production experienced over the 2003-2005 seasons
(Fig. 11). This produced gross returns for honey per hive not seen previously (Fig.
12).
50
200
180
40
160
Production per hive (kg)
Gross income per hive ($)
140
30
120
100
20
80
60
10 40
20
0 0
1994
1995
1996
1997
1998
1999
2000
2001
2002
2003
2004
2005
2006
1994
1995
1996
1997
1998
1999
2000
2001
2002
2003
2004
2005
2006
Year Year
Figure 11. Honey production per Figure 12. Gross return for honey per
hive. hive (based on clover prices).
The world honey prices are however falling again. Prices in Australia and Canada are
now less than $2.00/kg which is similar to the price paid in New Zealand pre varroa.
New Zealand’s domestic market which absorbs more than half of New Zealand’s
honey production has been protected from imports for more than 50 years because of
the risk of introducing diseases. MAF is however currently in the process of opening
14New Zealand to honey imports. It is expected that honey imports will occur before
July 2006.
The low international prices coupled with increased competition in the domestic
markets are likely to depress honey prices. Should prices return to pre varroa levels
this is likely to have a major impact on hive numbers. With the increased cost
associated with managing varroa many beekeepers who rely on honey would no
longer find beekeeping economic. This is likely to have a larger effect on hive
numbers than the effects due to varroa itself.
Seventy-seven beekeepers in the North Island answered the question concerning what
a reduction in honey prices to $2/kg would do to the number of hives they managed.
Forty-seven beekeepers (61%) did not consider the price of honey would affect the
number of hives they managed. Six percent would increase their hive numbers and
29% would decrease hive numbers. Eighteen percent did not think they would
continue to keep bees. This would result in a net reduction of 31,900 hives in the
surveyed North Island beekeepers which equates to a reduction of 44,000 hives (26%)
from all the managed hives in the North Island.
Seventy-five beekeepers in the South Island replied to the survey on the influence of
honey prices. Fifty beekeepers (66%) did not think honey prices would affect their
hive numbers, 9% thought they would increase hive numbers and 21% thought hive
numbers would decrease. The net prediction was a decrease in hive numbers of 24%
(20,000) in the south island.
The similarity in hive declines in both islands was surprising considering only
beekeepers in the North Island have significant varroa costs. This may reflect the
higher value of Manuka honey produced in the North Island and the higher levels of
pollination.
2) Toxic Honey
Toxic honey is produced by bees feeding on the honey dew that immature stages of the vine
hopper, Scolypopa australis (Fig. 13), produce
when they feed on Tutu (Genus Coriaria) (Fig.
14). The honey is not toxic to bees but can be
very poisonous to humans.
The symptoms of honey poisoning include
vomiting, delirium, giddiness, increased
excitability, stupor, coma, violent convulsions,
memory loss and on occasion death. Some of
the symptoms can persist for more than a week.
Relapses have been reported for up to six
months after a poisoning. A single half a
teaspoon of toxic honey in a cup of tea has on
occasion been enough to cause unconsciousness.
Before 1950, there were 213 notified poisoning
cases with six deaths. One of the cases included
the poisoning of 147 children from a boarding
Figure 13. Scolypopa australis.
15school in England, 1923, who consumed the honey at breakfast. Ten of these were seized
with convulsions and 20 vomited. The honey was traced back to Te Teko in the North Island.
There have been 81 reported cases in the last 50
years, the most recent being in Opotiki in 1991. It
needs to be noted that there are possibly many
more cases that are unreported or misdiagnosed,
especially when poisoning has resulted from low
concentrations of toxins.
From the medical accounts of the poisonings it is
surprising that a greater number of fatalities have
not been reported. All documented deaths have
been reported as the result of eating comb honey,
rather than extracted honey. This is possibly
because the extracted honey is likely to be diluted
by uncontaminated honey. However, toxins in
extracted honey is still a problem and have
resulted in nearly 70% of the poisonings.
In 1948 the Government restricted beekeeping in Figure 14. Sketch of a Tutu
the Eastern Bay of Plenty following 27 poisonings
(Genus Coriaria).
in Pongakawa. In 1974, MAF closed the
Coromandel area to beekeeping following an additional 13 poisonings and ordered all
beekeepers to move their hives out between 14 December and 1 May the following year. In
1977 the restrictions were changed so hives no longer had to be moved but that all surplus
honey had to be removed by 31 December.
The restrictions were very effective at managing the problem. In the 30 years prior to the
restrictions there were 63 poisonings and this has reduced to 16 since the restrictions were put
in place.
Four years ago with the change to the Animal Products Act, the Coromandel restrictions were
removed. Commercial beekeepers are now required to sign a declaration that indicates
whether there is any likelihood that the honey being produced has toxins. MAF has not
provided any details on how beekeepers are supposed to carry out this assessment. There are
also no requirements for hobby beekeepers to sign such a declaration if they are not selling to
an extractor or packer.
The opinion of the New Zealand Food Safety Authority regarding this situation is that
further poisoning will occur and that:
– a media scare story will result
– there’ll be a loss of public confidence in honey
– sales and price will crash
Should this occur it is likely to have a detrimental effect on beekeeping economics
and hive numbers.
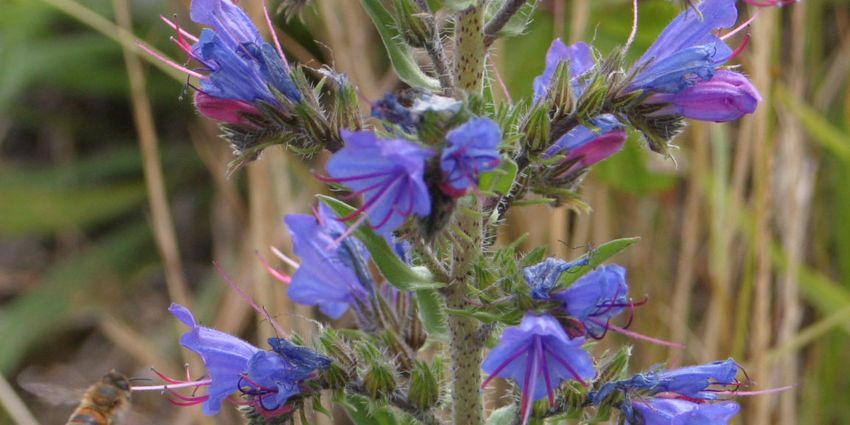
163) Plant alkaloids
A variety of plants produce alkaloids that can be secreted in nectar and found in
honey. Of particular concern is Viper’s bugloss (Echium vulgare) (Fig. 15). This is
becoming an issue, especially in the South Island where Viper’s bugloss nectar
contaminates a large amount of honey produced.
Should restrictions be placed on the production of Viper’s bugloss honey and health
warnings issued (as they have been for a similar plant that grows in Australia) this is
likely to have a negative impact on the economics of beekeeping in the South Island.
Figure 15. A honey bee visiting a Viper’s bugloss flower.
4) Exotic pests and diseases of honey bees
There are a number of honey bee pests and diseases that could further compromise the
ability of the beekeeping industry to provide sufficient hives for pollination. The
most significant of these are described below.
European foulbrood
European foulbrood is a disease of honey
larvae caused by the bacterium
Melissococcus plutonius (Fig. 16). Honey
bee colonies are usually more seriously
affected during the spring and early summer.
European foulbrood is found on all
continents, including Australia, although it
has not been reported from Western
Australia. European foulbrood has not been
reported from New Zealand.
17Honey bee colonies may be destroyed or
Figure 16. Honey bee brood infected
seriously crippled by European foulbrood.
with European foulbrood.
Hence it could be a major problem for
hives used for pollination.
Beekeepers in Australia and elsewhere find it necessary to feed antibiotics to control
European foulbrood, and this would probably also be necessary if the disease were
introduced to New Zealand. The feeding of antibiotics to honey bees has implications
for the American Foulbrood National Pest Management Strategy, which relies on
beekeepers being able to diagnose clinical signs of American foulbrood. Feeding
antibiotics has been reported to suppress American foulbrood disease signs, thus
making it more difficult to detect and control.
Although the presence of European foulbrood would probably not result in
restrictions being placed on the export of bees and bee products from New Zealand,
the feeding of antibiotics to honey bees would have a negative effect on honey
exports, as it is likely that some importing countries would require New Zealand
honey to be tested to ensure it does not contain antibiotic residues.
Therefore, the introduction of European foulbrood is likely to cause significant
negative effects on hives used for commercial pollination, increased costs to
beekeepers through the need to feed antibiotics to their honey bee colonies, and
increased costs to honey exporters. The presence of European foulbrood in New
Zealand is likely to reduce the number of hives available for pollination.
Small hive beetle
The small hive beetle (Aethina tumida) is a pest
of honey bee combs (Fig. 17). It was first
described in South Africa, and it is now
widespread in the USA, Egypt and Australia.
The spread of A. tumida in temperate climates
of North America after its initial introduction to
Florida in the spring of 1998 suggests that is
would have no problems establishing in New
Zealand if it were introduced. However, the
extent to which the NZ climate would suit the
beetle is unclear. Most affected counties in the
US were those with climates similar to the
subtopical and warm temperate zone of South Figure 17. Small hive beetle
Africa, while in colder northern areas of the US larvae damaging honey bee
the beetle is considered unable to survive comb.
outside the hive or reproduce, over winter.
Notwithstanding the considerably colder climate in New Zealand, it is considered that
significant colony losses in New Zealand are possible, and beekeepers might need to
use pesticides to control the beetles. It is likely that there would be considerable
regional variation in the impact of small hive beetle in New Zealand, depending on
temperature and soil type. Because of the limited distribution of the small hive beetle
throughout the world, their presence in New Zealand is likely to result in restrictions
18being imposed on exports of queens and package bees, further eroding the
profitability of beekeeping in New Zealand.
Tracheal mite
Acarapis woodi is a parasitic mite that causes acarapisosis, a disease of the respiratory
system of adult honey bees (Fig. 18). It has been reported as being present in most
areas of the world. The only significant beekeeping countries where it has not been
reported are Australia and New Zealand
It is likely that honey bees in this country would be as susceptible to tracheal mites as
honey bees in north-eastern United States,
where, following their introduction in 1984,
tracheal mites caused the death of over 30% of
colonies in the winter of 1995-1996. Therefore,
severe consequences could be expected for the
New Zealand beekeeping and pollination
industries if tracheal mite were introduced. In
addition to hive losses, the need to use
chemicals to control the mite would pose
additional production costs both in terms of
treatment and the labour involved in
administering it.
Figure 18. Tracheal mites in
Tropilaelaps the trachea of a bee.
Tropilaelaps clareae is a parasitic mite associated with honey bees. If left unchecked,
the mite population can rapidly cause the death of the colony. It has been found in
southeast Asia, Afghanistan, China and Kenya.
The establishment of T. clareae would likely cause severe consequences for the New
Zealand beekeeping and horticultural industries. T. clareae is considered to be a more
serious pest than varroa in southeast Asian countries where both mites exist. The
presence of T. clareae could have a major effect on the export of queens and package
bees from New Zealand, even though the short survival period of the mite on adult
bees probably means that live package bee exports are unlikely to transport T.
clareae.
Africanised bees
Apis mellifera scutellata is a subspecies of honey bee naturally occurring across
eastern and southern Africa from Ethiopia to the Cape. Africanised bees have a
number of behavioural traits that make them difficult to manage, the most important
being their exceptionally high level of defensive behaviour.
Since its introduction to Brazil, the subspecies has spread into much of South
America, all of Central America, Mexico, and into some areas of the southwestern
United States.
19Should Africanised bees become established in New Zealand, the consequences on
beekeeping are likely to be severe. It is likely that the export of queens and package
bees would stop, or at least be seriously affected.
The behaviour of Africanised bees would also affect beekeeping practices. Many
Latin American countries now require bees to be kept 200–300m from roads,
agricultural fields and dwellings. A similar requirement in New Zealand would mean
that much of the country would become unavailable to beekeepers. Major difficulties
would also occur if a high percentage of the colonies used for kiwifruit pollination
were to become Africanised. Restrictions could prohibit the use of Africanised honey
bees for pollination in such situations. It is highly likely that the keeping of bees in
built-up areas would be prohibited.
European strains of honey bee existing as feral colonies in New Zealand would be
displaced by Africanised colonies as a result of preferential mating behavior, a shorter
development time for Africanised queen bees and the increased production of
Africanised swarms.
The behaviour of Africanised bees would also pose a significant potential public
health problem, with increased stinging incidents and increased public resources
devoted to swarm and feral colony destruction.
Should Africanised bees become established in New Zealand the ability of the
beekeeping industry to provide sufficient hives for pollination will be seriously
compromised.
Cape Honey Bee
The Cape honey bee (Apis mellifera capensis) is a subspecies of A. mellifera found in
the Cape region of southern Africa. When colonies of other subspecies of honey bee
are kept within flight range of A. m. capensis, laying workers of the Cape bee are
likely to enter the colonies. The laying workers mimic a series of queen pheromones
and are able to successfully escape reproductive suppression from the resident queen
and adult bees. The social parasitism and usurpation displayed by A. m. capensis
suggests that even at low frequencies in the wild honey bee population, the sub-
species could cause an on-going threat to beekeeping activities with other sub-species
of honey bee. Beekeepers requeening to make up losses might not be able to
overcome those losses. Losses could also impact on the price and availability of hives
used for commercial pollination activities. Establishment of the sub-species would
also likely stop (or at least seriously affect) the export of queens and package bees
from New Zealand.
CONCLUSIONS
An analysis of the demand for hives shows that of the 88,675 hives demanded
currently in November for pollination, a significant proportion of these are required in
the North Island. An analysis of the key crops3 requiring hives during this month
shows that 78% (66,600) of them are required in the North Island currently. This is
projected to increase to nearly 80% (80,600 hives) in 2010 and 2015 (87,500 hives).
3
Analysis of the locational requirements of some of the crops requiring fewer hives was not done.
20With the increase in area expected to be planted (predominantly green kiwifruit and
avocados) the peak demand could increase to 103,150 hives by November 2010 and
108,675 hives by 2015. If growers were to introduce the recommended levels of
hives into their orchards these figures are projected to increase to 133,575 and
142,175 hives respectively.
Of the beekeepers surveyed that currently provide, or intend to provide pollination
hives, North Island beekeepers could only commit 71% of their hives for pollination
on average and South Island beekeepers only 51%. The difference is probably due to
the colder spring conditions usually experienced in the South Island. This means that
in 2015 there would only be 98,281 colonies available in the North Island and 41,376
colonies in the South Island (appendix 4).
The number of hives currently available are sufficient to supply existing requirements
but are not predicted to be sufficient by 2015. If the predicted reductions in hive
number due to varroa and reduced honey prices eventuate, this situation will be more
critical. It is estimated there is likely to be a shortfall of 72,950 hives nationally by
2015. Appendix 4 provides detail on some of the possible scenarios.
According to the survey of beekeepers undertaken in New Zealand, and current
experience from America increasing hive rentals will not eliminate the shortfall in
hive supplies.
21APPENDIX 1
US: Honeybee shortage sours fruit, nut harvest
By Linda A. Johnson, Associated Press
TRENTON, N.J. - With all the sophisticated technology today's farmers use, little honeybees
remain crucial, pollinating billions of dollars of fruit, vegetable and nut crops each year while
collecting food for their hives.
But the number of honeybees and managed beehives is down so much that production of
pollinated plants has fallen by about a third in the last two years from the usual $15 billion
per year. "I've heard people complaining about bee shortages all over the country," said
Kevin Hackett, head of the U.S. Department of Agriculture's research program for bees and
pollination. He said 15 years ago, "there were twice as many hives as there are now."
Today, commercial beekeepers manage 2.5 million U.S. colonies, or artificial wood-and-
screen box hives, with roughly 65,000 bees each. The big drop in the honeybee population
the last several years is mostly due to the parasitic varroa mite destroying more than half of
some beekeepers' hives and wiping out most wild honeybees.
Commercial beekeepers, crunched by huge bee losses and rising costs for fuel and chemicals
to kill varroa mites, have boosted the fees they charge farmers to rent honeybees.
Given the varroa mite epidemic, other environmental pressures and a drop in the number of
beekeepers, government agencies and even the National Honey Board are pouring money
into research to help the honeybees bounce back and grant programs to get more people
into beekeeping. The National Academy of Sciences has even appointed a group to
investigate whether all bees, butterflies, birds and other pollinators in North America are
endangered by habitat loss, insecticide use, invasive species and other influences.
For farmers dependent on pollination, the current shortage means they must pay higher bee
fees that they generally can't recoup or risk a big drop in crop production.
"I think some of the growers are going to rent less hives this year and take a chance" yield
holds up, said Ned Lipman, who raises cranberries on two 50-acre farms in Manchester and
Berkeley townships, in New Jersey's Ocean County.
"There's an acute shortage of bees nationwide," Lipman said.
Honeybees and some wild insects and birds, in extracting nectar and pollen from the flowers
of crops and transferring pollen grains among plants, increase the size and total yield of crops
from apples to zucchini. Until World War II, most U.S. farmers maintained their own
honeybee hives; early settlers brought beehives from Europe along with crop seeds.
Now Lipman hears he'll have to pay $55 for each of the 200 honeybee hives he normally
rents each spring, up from $42 last year. The bee shortage is hitting California farmers
particularly hard, because the fast-growing popularity of almonds grown there has sharply
increased demand for honeybees when the supply is much lower. Almond pollination prices
have risen dramatically, from less than $50 per colony to as much as $150 per colony in just
three years, said Daniel Weaver, president of the American Beekeeping Federation and a
fourth-generation beekeeper with more than 8,000 honeybee colonies in Texas, North
Dakota, Montana and California.
The higher prices beekeepers can command in California, in turn, has led some to shift
beehives there from states farther east, despite the cost and time involved in getting
approval to ship bees across some state lines. Lipman said that's exacerbated the beehive
shortage elsewhere.
22Besides the harm to hives from nature's effects, interest in beekeeping has been falling as
commercial beekeepers and hobbyists alike get older and give it up.
That's one reason New Jersey's Department of Agriculture started a new program giving $300
grants to first-time beekeepers to cover costs of starting up a hive - after completing the
"Bee-ginning Beekeepers" training course offered each spring by Rutgers University's
agricultural school, Cook College.
The grant program aims "to get more people interested in keeping bees, in hopes of some
people getting into it commercially," said Bob Hughes, president of the New Jersey
Beekeepers Association.
Hughes, 72, tends more than 200 hives set up on a couple dozen farms and in gardens on
large properties around the state. Some of his hives are used for the field training on the final
day of the beekeepers course, when students learn how to safely handle bees, remove honey
and maintain the hives
23APPENDIX 2. Pollination survey sent to beekeepers
Name of company (optional)
On which Island do you keep your beehives?
North
South
Which district do you live in?
How many hives does your business have?
250 - 500 500 – 1000 1000 - 1500 1500 - 2000
2000 - 2500 2500 - 3000 3000 - 3500 3500 - 4000
4000 - 4500 4500 - 5000 5000 - 5500 5500 - 6000
6000 + (please specify)
How many years from now do you anticipate that you will manage a beekeeping
business?
In the next 5 years are you intending to change hive numbers?
Increase by
Decrease by
Same number
Do you provide hives for paid pollination? Yes No
Within the next 5 years is your business intending to supply hives for paid
pollination? Yes No
Does your business pollinate kiwifruit or avocado orchards? Yes No
If “Yes” what is the highest percentage of hives you could realistically commit to
pollination (assuming the hives had 6 frames of brood and 12 frames of bees by
November)?
40% 50% 60% 70% 80% 90%
If you do not provide hives for pollination what would need to change for you to do
so (number the reasons in order of priority (1 being highest priority)?
Someone else to feed sugar syrup
Cost that you are paid per hive
Someone else to move hives in and out of the orchards
Live closer to the orchards
Decrease in honey prices
Decrease in fuel prices
Not interested
Other: Please specify
24To be economical for your business, if you only provided hives for pollination for the
entire season (ie no additional beekeeping income), what price would you require?
$ /hive.
To be economical for your business, if you provided hives for pollination and also
collected additional income (honey crop, pollen collection, propolis) throughout the
season, what price would you require $ /hive.
If bulk honey was at $2/kg, as it was in 1999, would this affect the number of
beehives that you manage and by what percentage?
Yes increase %
Yes decrease %
No
If bulk honey was at $2/kg, as it was in 1999, would this increase the percentage of
hives that you would commit to pollination?
Yes increase %
No
25APPENDIX 3. Example of survey sent to pollination industry
representatives
Hi Mike
As you know, Fruition Horticulture is assisting in a project to develop a strategic pollination industry
plan that reconciles forecasts on the supply and demand for bee pollination over the next 10 years.
To assist in this project please could you respond to the following questions. (Click reply and complete
the form, then send.) If you feel someone else in your industry is better placed to respond to some or
all of the survey please feel free to forward this email to them with a c.c. to me, thanks.
Please indicate in the table below where crops are grown and their beehive requirements and add
details on any crops not already listed. (Please correct where information provided is incorrect.)
North Island South Island Hive Requirements
Crop Month Month Month Month Per Hectare
Bees In Bees Out Bees In Bees Out
Apples Sept Oct 5-8
Pears Sept Oct
Current Crop Area (Please correct where our information is out of date.)
Crop Area (ha)
Apples 12,150
Pears 910
Estimated Crop Area in 2010
Crop Area (ha)
Apples
Pears
Estimated Crop Area in 2015
Crop Area (ha)
Apples
Pears
Thank you for your assistance in answering the above questions. You may be assured that all
information provided will only be used for its intended purpose.
Regards
Sandy
Sandy Scarrow
Fruition Horticulture (BOP) Ltd
PO Box 792
Tauranga
Phone 07 928 5350
Fax 07 928 5355
26Mobile 0274 425 436
Home 07 571 1090
27APPENDIX 4. Scenarios
Location and Time Estimated Peak Demand if Estimate Supply Estimated Shortfall
Period Recommended Inputs were (hives) (hives)
Scenario Introduced (hives)
StatusQuo North Island
- November 2006 85,100 98,300 No Gap
- November 2010 96,875 98,300 No Gap
- November 2015 102,500 98,300 4,200
South Island
- December 2006 28,460 41,400 No Gap
- December 2010 34,010 41,400 No Gap
- December 2015 35,800 41,400 No Gap
Varroa arrives in the South Island South Island
(assume a 25% reduction in hive - December 2006 28,460 31,050 No Gap
numbers) - December 2010 34,010 31,050 2,960
- December 2015 35,800 31,050 4,750
Honey Prices Drop to $2/kg North Island
(assume a reduction of 44,000 hives) - November 2006 85,100 54,300 30,800
- November 2010 96,875 54,300 42,575
- November 2015 102,500 54,300 48,200
South Island
(assume a reduction of 20,000 hives) - December 2006 28,460 21,400 7,060
- December 2010 34,010 21,400 12,610
- December 2015 35,800 21,400 14,400
Both Honey Prices Drop and varroa South Island
arrives in the South Island - December 2006 28,460 11,050 17,410
(assumptions as above) - December 2010 34,010 11,050 22,960
- December 2015 35,800 11,050 24,750
National Impact of Honey Prices New Zealand
Dropping to $2/kg and varroa Arriving 2006 113,560 65,350 48,210
in theSouth Island 2010 130,885 65,350 65,535
2015 138,300 65,350 72,950
28You can also read