Choice of 16S ribosomal RNA primers affects the microbiome analysis in chicken ceca
←
→
Page content transcription
If your browser does not render page correctly, please read the page content below
www.nature.com/scientificreports
OPEN Choice of 16S ribosomal RNA
primers affects the microbiome
analysis in chicken ceca
Nadia Darwish1,2, Jonathan Shao2, Lori L. Schreier1 & Monika Proszkowiec‑Weglarz1*
We evaluated the effect of applying different sets of 16S rRNA primers on bacterial composition,
diversity, and predicted function in chicken ceca. Cecal contents from Ross 708 birds at 1, 3, and
5 weeks of age were collected for DNA isolation. Eight different primer pairs targeting different
variable regions of the 16S rRNA gene were employed. DNA sequences were analyzed using open-
source platform QIIME2 and the Greengenes database. PICRUSt2 was used to determine the predicted
function of bacterial communities. Changes in bacterial relative abundance due to 16S primers were
determined by GLMs. The average PCR amplicon size ranged from 315 bp (V3) to 769 bp (V4–V6).
Alpha- and beta-diversity, taxonomic composition, and predicted functions were significantly affected
by the primer choice. Beta diversity analysis based on Unweighted UniFrac distance matrix showed
separation of microbiota with four different clusters of bacterial communities. Based on the alpha-
and beta-diversity and taxonomic composition, variable regions V1–V3(1) and (2), and V3–V4 and
V3–V5 were in most consensus. Our data strongly suggest that selection of particular sets of the 16S
rRNA primers can impact microbiota analysis and interpretation of results in chicken as was shown
previously for humans and other animal species.
Bacteria are the major component of chicken gastrointestinal tract (GIT) microbiota that plays important role
in health, nutrition, host physiology regulation, GIT development, and growth. Microbiota composition and
function can be affected by age, host genotype and sex, diet composition and form, dietary ingredients such
as probiotics, prebiotics, synbiotics, phytobiotics and bacteriophages, stress, antibiotics, and GIT location1–3.
Recently, the number of available data characterizing the avian microbiota has significantly increased4. Pub-
lished papers mostly focused on the impact of d iet5,6, disease7,8, antibiotics5, probiotics7,9,10, prebiotics11,12 and
environmental exposures13 on the chicken microbiota. Analysis of the microbiota is believed to be important to
improve animal nutrition strategies, animal health, and well-being. In chickens, a diverse microbiota is found
throughout the GIT with the most diversity in the cecum which serves as a key organ for fermentation of various
forms of polysaccharides to short-chain fatty a cids14,15.
Historically, microbiota in GIT was detected by biochemical, microbiological, immunological, and molecular
biology techniques16. Because most of the microbiota in GIT is strictly anaerobic, it was difficult to identify and
characterize individual species using classic m ethodology16. With time, more sophisticated molecular biology
methods were developed to characterize microbiota, including PCR, denaturing gradient gel electrophoresis
(DGGE), temperature gradient electrophoresis (TGGE), microarrays, and next-generation sequencing (NGS)17,18.
Recently, the microbial community profiling method based on the 16S ribosomal RNA (rRNA) sequencing
approach (NGS) has become the most popular to determine the taxonomic composition and diversity of chicken
microbiota19. Bacterial 16S rRNA contains 9 hypervariable regions used to calculate evolutionary relation-
ships and similarities between species, that are flanked by highly conserved regions which are generally used
to design polymerase chain reaction (PCR) p rimers20. The 16S rRNA profiling consists of many steps such as:
sample collections and storage, DNA isolation, 16S primer selections, 16S rRNA PCRs, libraries preparations
and indexing, sequencing, raw data analysis (pipeline or software selection), OTU/ASV (Operational Taxonomic
Unit/Amplicon Sequence Variant) picking, database selection, diversity analysis, and statistical analysis. Several
bioinformatics pipelines for raw sequences analysis has been developed and used to provide a taxonomic compo-
sition and population diversity including Mothur21,22 and QIIME23–25. In the case of taxonomic composition, most
analyses are performed using databases such as Greengenes26, the Ribosomal Database Project27, and SILVA28.
1
Agricultural Research Service, NEA, Animal Biosciences and Biotechnology Laboratory, United States Department
of Agriculture, 10300 Baltimore Avenue, B‑200, Rm. 100B, BARC‑East, Beltsville, MD 20705, USA. 2Agricultural
Research Service, Northeast Area, Statistic Group, United States Department of Agriculture, Beltsville, MD 20705,
USA. *email: monika.weglarz@usda.gov
Scientific Reports | (2021) 11:11848 | https://doi.org/10.1038/s41598-021-91387-w 1
Vol.:(0123456789)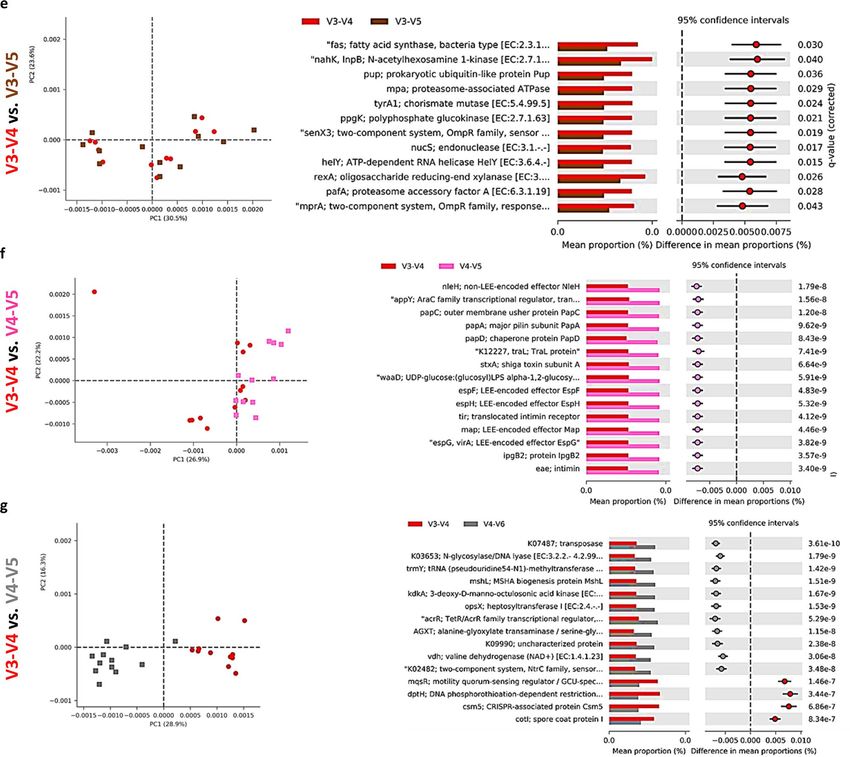
www.nature.com/scientificreports/
Even though 16S profiling is the most popular approach to study microbial diversity, it is characterized by
several limitations including amplicon size, primer sensitivity, amplification errors, and contamination29. It
has been already shown that primer d esign30–32, library p reparation33, DNA isolation m ethods34,35, and PCR
amplification artifacts can introduce unique biases that can affect community structure, richness, and microbial
population analysis36 and lead to over- or under-representation of individual bacteria within communities37.
Moreover, different sequencing platforms and bioinformatics pipelines can affect the average relative abundance
of microbiota and shape the taxonomic community p rofiles31,38. Additionally, the Microbiome Quality Control
project (MBQC) in human microbiome study reported that the DNA isolation method, as well as 16S rRNA
primers used, are the major sources of variation, with sequencing depth and sample storage having a smaller
but detectable influence on the data39.
In chicken microbiota studies, even though the experiments are commonly standardized and based on identi-
cal breeds, the results are often contradictory and the results depend on used animal (breed, age, gender, etc.),
the experimental design (feeding and sampling), and DNA extraction and sequencing methods. Therefore, it is
hard to compare those data and correlate them with each o ther19,40. The development of a standardized protocol
for microbiota profiling in chickens, similar to the one used in human microbiota research, has been proposed
by Borda-Molina and colleagues40 to obtain comparable data sets for poultry microbiota.
Following the above recommendation and taking into account the fact that microbial studies in poultry,
covered, so far, the V1–V3, V3–V4, V4–V5, V4–V6, V1, V3 or V4 region of the 16S rRNA g ene3,41–45, the present
study aimed to explore the influence of applying the different sets of 16S rRNA primers on chicken microbiota
diversity, taxonomic composition and predicted function.
Results
Sequencing. A total of 12 samples obtained from chicken cecal content at three different ages (n = 4 for age)
were used in 16S rRNA high-throughput sequencing using eight different 16S rRNA primer sets. Chicken DNA
amplification with these primer sets resulted in averaged indexed PCR product size ranging from 315 bp (V3) to
769 bp (V4–V6) (data not shown). In all cases, a single PCR band was visible on the electropherogram, but the
intensity of the PCR band was different among primers sets, with the lowest one for V3 and the highest one for
V1–V3(1), V3–V4 and V4–V5, and V3–V5 (data not shown). Sequencing of 12 samples generated 16,050,150
sequences with 15,776 to 939,976 sequences per sample. After removing chimeric sequences, the total pool of
sequences was reduced to 11,113,440 reads with 13,524 to 634,783 sequences per sample.
Microbiota diversity analysis. Significant (P < 0.05) differences in alpha diversity indices in chicken cecal
microbiota were observed when different 16S rRNA primers were used (Fig. 1). In the case of Evenness, the V3
set was characterized by the lowest one in comparison to other primer sets while V3–V4 showed the highest
Evenness in comparison to V4–V5 and V4–V6 (Fig. 1a). In contrast, V3 was characterized by the highest Rich-
ness while V4–V5 by the lowest Richness (Fig. 1b). The number of ASVs was significantly (P < 0.05) lower in
V4 in comparison to V1–V3, V3, and V4–V6 sets (Fig. 1c). Finally, the Shannon index, which represents com-
munity Richness and Evenness, was the least affected by primer set showing only significant differences between
V1-V3 and V4 primer sets (Fig. 1d). Beta diversity analysis (Principal Coordinate Analysis, PCoA) based on
Unweighted UniFrac distances as well as PERMANOVA analysis revealed clear clustering of microbial commu-
nities due to primer choice (Fig. 1e). Five different clusters were formed, with V1–V3(1), V1–V3(2), V3–V5 and
V3–V4, V4–V5, and V3, V4, and V4–V6 separated from each other.
Taxonomic composition. Figure 2 depicts the number and the percentage of detected features for phylum
(Fig. 2a), families (Fig. 2b), and species (Fig. 2c) that were significantly different in relative abundance between
primer pairs. On the phylum level, no differences were observed between V1–V3(1) and V1–V3(2) primer pairs
while V3 primers were characterized by the greatest number of different taxa in comparison to the V1–V3(1)
primer pair (Fig. 2a). At the family level, the lowest differences in sets were observed for V1–V3(1) vs. V1–V3(2)
and V4–V5 vs. V3–V5 primer pairs, while the biggest differences in relative abundance were observed for V1–
V3(2) vs. V3, V3 vs. V3–V4, and V3 vs. V3–V5 primer pair comparison (Fig. 2b). Finally, at the species level, no
significant differences in relative abundance were observed for V3–V4 and V3–V5 primer pair comparison. The
biggest differences in the relative abundance of species were observed between V1–V3(1) and V4, and V1–V3(2)
and V3–V4 primer sets (Fig. 2c). Changes in taxonomic composition on phylum, family, and species level due
to primer set are presented in Figs. 3, 4 and 5. At the phylum level, chicken cecal microbiota was composed pre-
dominantly (except for the V3 primer set) of Firmicutes, Proteobacteria, and Bacteroidetes with a lower relative
abundance of Actinobacteria, TM7, Tenericutes, and Verrucomicrobia (Fig. 3a). Besides changes in microbial
composition due to the age of birds, the selection of 16S primers has a significant effect on microbiota compo-
sition in chicken ceca. The first six phyla with the highest relative abundance that were significantly (P < 0.05)
affected by the primer set are presented in Figs. 3b–g. Primer set V3 was characterized by the highest abundance
of unclassified bacteria and the lowest abundance of other phyla. The highest relative abundance of Actinobac-
teria was obtained with V4 primers (Fig. 3c) while Bacteroidetes relative abundance was the lowest in the case
of V3, V3–V4, and V3–V5 primer sets (Fig. 3d). The Firmicutes relative abundance ranged from 60% (V1–V3)
to 75% (V3–V4, V4–V5, and V3–V5) (Fig. 3e). The highest Proteobacteria level was detected with V1–V3(2)
primer set (Fig. 3f) while the highest Tenericutes level was detected with V4 and V4–V5 primer sets (Fig. 3g). A
similar pattern was observed at the family level (Fig. 4). V3 primer set was characterized by the highest (P < 0.05)
abundance of Unclassified bacteria (UNCL) and the lowest relative abundance of other bacterial families in
chicken ceca (Fig. 4b). The highest abundance families that show significant differences due to primer set selec-
tion are presented in Fig. 4c–g. The selection of V3, V3–V4, and V3–V5 led to the lowest abundance level of the
Scientific Reports | (2021) 11:11848 | https://doi.org/10.1038/s41598-021-91387-w 2
Vol:.(1234567890)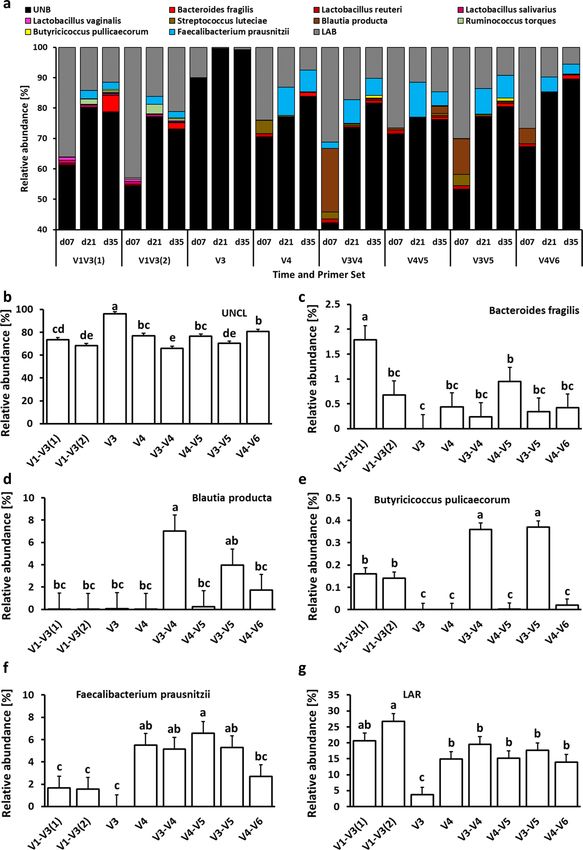
www.nature.com/scientificreports/

                                  Figure 1.  Effect of primer set on alpha (a–d) and beta (e) diversities in cecal microbiota. Alpha diversities
                                  indices: (a) Evenness, (b) Richness, (c) ASV number, and (d) Shannon index. (e) Principal coordinate analysis
                                  (PCoA) based on unweighted pairwise UniFrac distances between primer sets in cecal microbiota. a,b,c,d,e,fq < 0.05
                                  (q represents p value corrected for false discovery rate).

                                  Rickenellaceae family in chicken ceca (Fig. 4c). The highest Clostridiaceae level was presented with V1–V3(1)
                                  primers (Fig. 4d) while a relatively stable level of Lachnospiraceae family was observed regardless of primers
                                  except for V3 and V4 primer set (Fig. 4e). The highest relative abundance of the Ruminococcaceae family was

Scientific Reports |   (2021) 11:11848 |               https://doi.org/10.1038/s41598-021-91387-w                                                 3

                                                                                                                                             Vol.:(0123456789)
www.nature.com/scientificreports/
a
V1-V3(1)
V1-V3(2)
V3-V4
V4-V5
V3-V5
V4-V6
Phylum
V3
V4
V1-V3(1) 0 5 2 2 4 4 2
Number of taxa with significantly
different rela
ve abundance
V1-V3(2) 0 4 3 2 3 3 1
V3 50 40 4 4 4 4 4
between primer
V4 20 30 40 2 1 3 1
V3-V4 20 20 40 20 2 0 2
V4-V5 40 30 40 10 20 3 1
V3-V5 40 30 40 30 0 30 2
V4-V6 20 10 40 10 20 10 20
Percentage of taxa with significantly different rela
ve
abundance between primer
b
V1-V3(1)
V1-V3(2)
V3-V4
V4-V5
V3-V5
V4-V6
Family
V3
V4
V1-V3(1) 1 7 2 7 2 3 3
Number of taxa with significantly
different rela
ve abundance
V1-V3(2) 6.25 9 5 8 3 6 2
V3 43.7 56.3 8 9 8 9 7
between primer
V4 12.5 31.3 50.0 4 4 6 3
V3-V4 43.7 50.0 56.3 25.0 4 2 5
V4-V5 12.5 18.7 50.0 25.0 25.0 1 2
V3-V5 18.7 37.5 56.3 37.5 12.5 6.25 5
V4-V6 18.7 12.5 43.7 18.7 31.3 12.5 31.3
Percentage of taxa with significantly different rela
ve
abundance between primer
c
V1-V3(1)
V1-V3(2)
V3-V4
V4-V5
V3-V5
V4-V6
Species
V3
V4
V1-V3(1) 1 6 8 7 7 7 6
Number of taxa with significantly
different rela
ve abundance
V1-V3(2) 9.1 7 7 8 6 7 6
V3 54.5 63.6 4 5 4 5 2
between primer
V4 72.7 63.6 36.3 3 1 2 1
V3-V4 63.6 72.7 45.4 27.2 3 0 3
V4-V5 63.6 54.5 36.3 9.1 27.2 3 1
V3-V5 63.6 63.6 45.4 18.1 0 27.2 3
V4-V6 54.5 54.5 18.1 9.1 27.2 9.1 27.2
Percentage of taxa with significantly different rela
ve
abundance between primer
Figure 2. Number and percentage of taxa significantly different in relative abundance level between primer
pairs. (a) phylum level, (b) family level and (c) species level. Number of taxa that were characterized by
significant differences in relative abundance were counted between primer pairs. The percentage of the taxa
were calculated for each primer pair comparison: (number of taxa that were significantly (P < 0.05) different in
relative abundance level/total number of taxa for each taxonomical level) × 100.
detected with V3–V4, V4–V5, and V3–V5 primer sets (Fig. 4f). No changes in abundance of Enterobacteriaceae
were detected among 16S primers except for V3 primers (Fig. 4g). Regardless of the primer set, the taxonomic
composition at the species level was characterized by a high abundance level of UNCL (Fig. 5a) ranging from
60% to almost 90% (Fig. 5b). Changes in the abundance level of bacterial species in chicken ceca are presented
in Fig. 5c–g. Similarly to the phylum and family level, taxonomic composition on species level was affected by
primer sets. The highest abundance level of Bacteroides fragillis was only detected with a V1–V3(1) primer set
(Fig. 5c) while the high abundance level of Blautia producta was detected only with V3–V4 (Fig. 5d). In the
case of Butyricocccus pullicaecorum, the highest abundance level was observed for V3–V4 and V3–V5 primer
sets followed by V1–V3 sets (Fig. 5e). Primer sets of V4, V3–V4, V4–V5, and V3–V5 led to the detection of the
Scientific Reports | (2021) 11:11848 | https://doi.org/10.1038/s41598-021-91387-w 4
Vol:.(1234567890)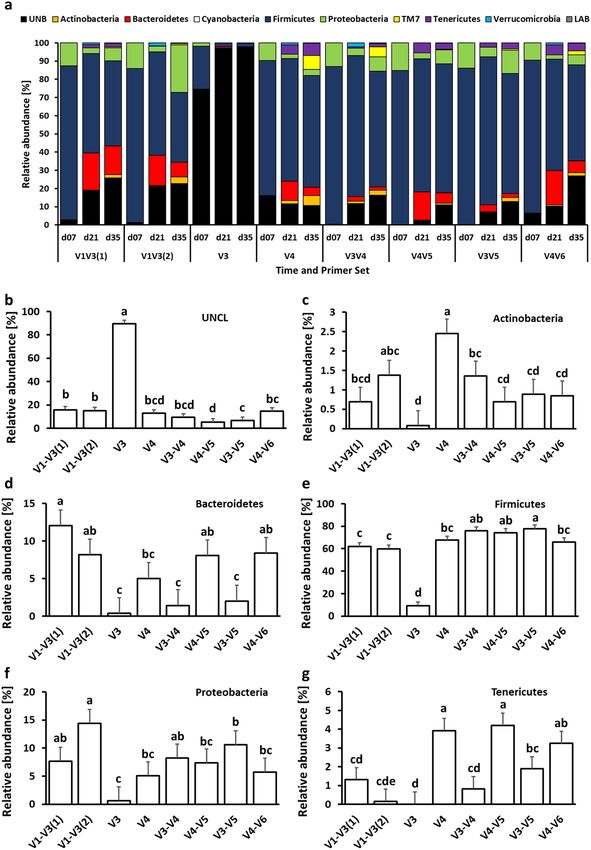
www.nature.com/scientificreports/

                                  Figure 3.  Changes in relative bacterial abundance (%) in chicken cecal content at phylum level. (a) Taxonomic
                                  profile of chicken cecal microbiota. Effect of primer sets on the relative abundance of (b) unclassified bacteria
                                  (UNCL), (c) Actinobacteria, (d) Bacteroidetes, (e) Firmicutes, (f) Proteobacteria, and (g) Tenericutes. Only
                                  significant (P < 0.05) data are shown and only first 6 phyla with the highest abundance are shown. Different
                                  letters denote statistically significant (P < 0.05) differences between primer sets.

Scientific Reports |   (2021) 11:11848 |               https://doi.org/10.1038/s41598-021-91387-w                                                     5

                                                                                                                                             Vol.:(0123456789)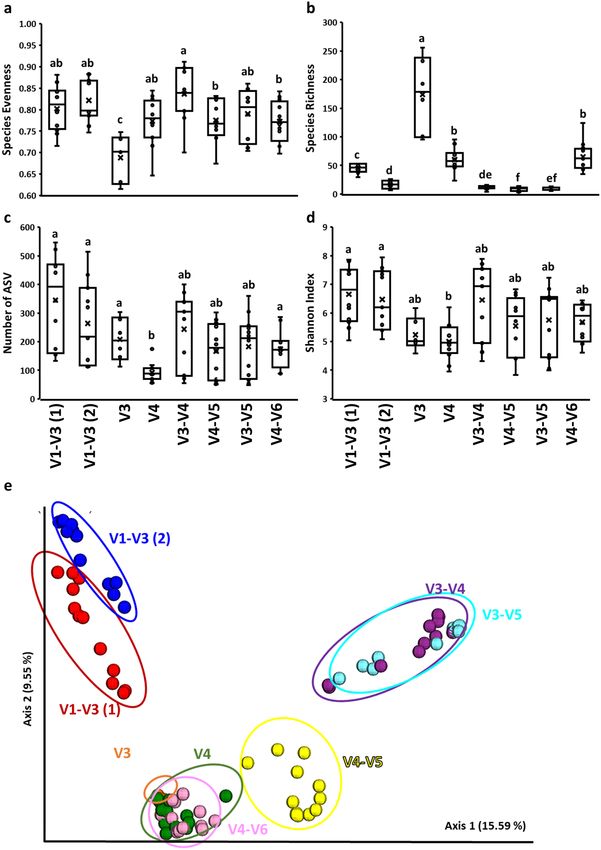
www.nature.com/scientificreports/

                                            Figure 4.  Changes in relative bacterial abundance (%) in chicken cecal content at family level. (a) Taxonomic
                                            profile of chicken cecal microbiota. Effect of primer sets on the relative abundance of (b) unclassified
                                            bacteria (UNCL), (c) Rikenellaceae, (d) Clostridiaceae, (e) Lachnospiraceae, (f) Ruminococcaceae, and (g)
                                            Enterobacteriaceae. Only significant (P < 0.05) data are shown and only first 6 families with the highest
                                            abundance are shown. Different letters denote statistically significant (P < 0.05) differences between primer sets.

          Scientific Reports |   (2021) 11:11848 |               https://doi.org/10.1038/s41598-021-91387-w                                                   6

Vol:.(1234567890)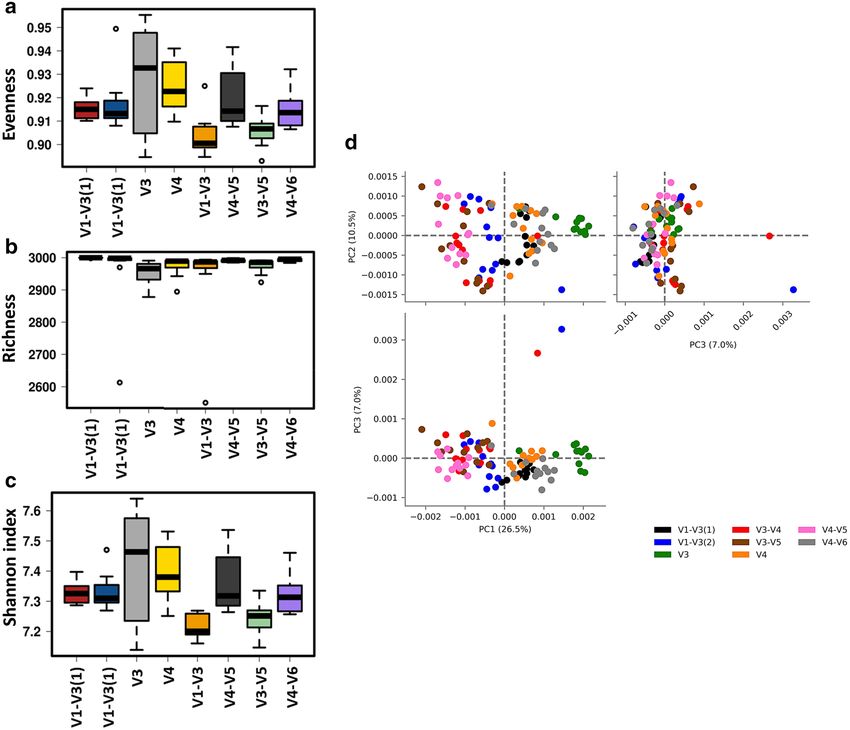
www.nature.com/scientificreports/

                                  Figure 5.  Changes in relative bacterial abundance (%) in chicken cecal content at species level. (a) Taxonomic
                                  profile of chicken cecal microbiota. Effect of primer sets on the relative abundance of (b) unclassified bacteria
                                  (UNCL), (c) Bacteroides fragilis, (d) Blautia producta, (e) Butyricicoccus pulicaecorum, (f) Faecallibacterium
                                  prausnitzii, and (g) low abundance reads (LAR). Only significant (P < 0.05) data are shown and only first
                                  6 species with the highest abundance are shown. Different letters denote statistically significant (P < 0.05)
                                  differences between primer sets.

Scientific Reports |   (2021) 11:11848 |               https://doi.org/10.1038/s41598-021-91387-w                                                     7

                                                                                                                                              Vol.:(0123456789)
www.nature.com/scientificreports/
Figure 6. Effect of the primer set on alpha and beta diversities of predicted function of the cecal microbiota
in chickens. Function of the microbiota was determined using PICRUST and visualized using Calypso (a–c)
and STAMP (d). Alpha diversities: (a) evenness (P < 0.001), (b) richness (P = 0.33) and (c) Shannon index
(P < 0.0001) (d) beta diversity between primer set bacterial populations was determined using principal
component analysis (PCA).
highest abundance of Faecallibacterium prausnitzii (Fig. 5g). Also, the level of low abundance reads (LAR) was
significantly affected by primer set choice (Fig. 5g).
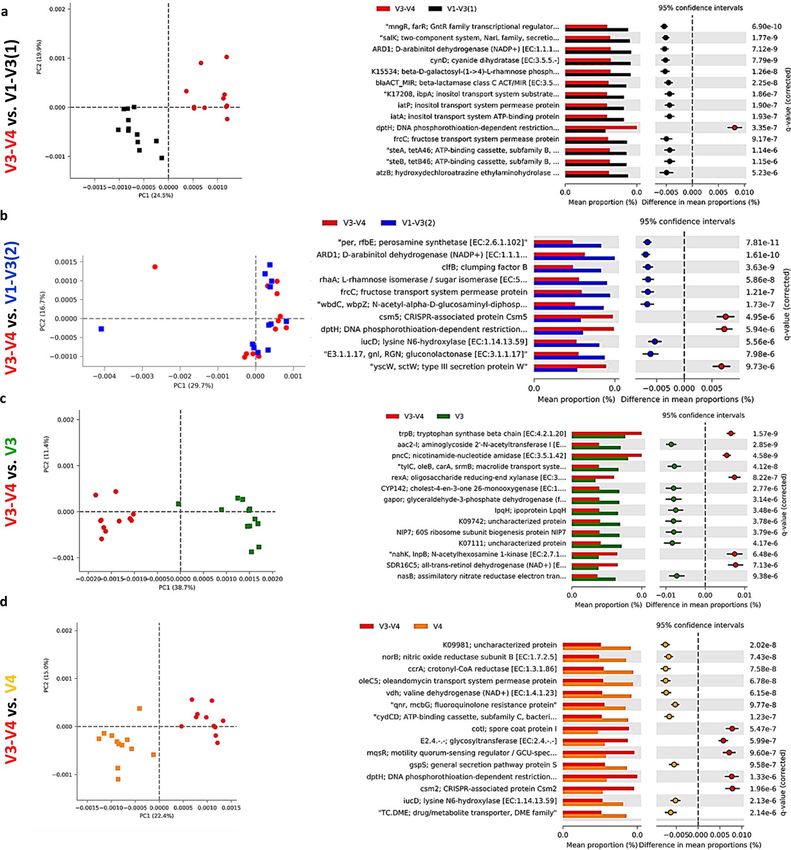
Microbiota predicted function. Alterations in the presumptive function of the cecal microbiota in broiler
chicken due to different 16S primers were evaluated using PICRUSt2 analysis and visualized using Calypso and
STAMP. Evenness and Shannon index of predicted function (Fig. 6a–c) was significantly (P < 0.001) affected
by the primer set while Richness was not affected (P = 0.33). Similarly, Principal Component Analysis (PCA)
showed separation between bacterial function due to the primer set (Fig. 6d). Figure 7 shows PCA analysis and
the changes in the top predicted microbial genes between V3-V4 and other primer sets. We choose to compare
all other sets to the V3–V4 primer set because it is the most widely used primer set and almost exclusively used
by our laboratory to determine the taxonomic composition of chicken microbiota. Comparison of V3–V4 with
V1–V3(1) primer sets, revealed clear function separation (PCA) with most of the top function upregulated
with V1–V3(1) primer set (Fig. 7a). In contrast, no separation of predicted function was detected for V3–V4
and V1–V3(2) sets, but most of the top function were upregulated with V1–V3(2) primer set (Fig. 7b). Both
comparisons, V3–V4 vs. V3 and vs. V4 showed a similar pattern of changes with clear separations between
these two populations as shown by PCA and upregulations of 2/3 of top KEGG function in V3 and V4 primer
sets (Fig. 7c,d). V3–V4 and V3–V5 function comparison revealed no clustering (PCA) with all the top func-
tion being upregulated in the V3–V4 primer set (Fig. 7e). Similarly, V3–V4 and V4–V5 samples were clustered
Scientific Reports | (2021) 11:11848 | https://doi.org/10.1038/s41598-021-91387-w 8
Vol:.(1234567890)www.nature.com/scientificreports/
Figure 7. Effect of the primer set on predicted function of the cecal microbiota in chickens. Function of the
microbiota was determined using PICRUST with KEGG database and visualized using STAMP. Principal
component analysis (PCA) and extended error bar plots for comparison of predicted function of microbiota
between (a) V3–V4 and V1–V3(1) (b) V3–V4 and V1–V3(2), (c) V3–V4 and V3, (d) V3–V4 and V4, (e) V3–
V4 and V4–V5, (f) V3–V4 and V3–V5, and (g) V3–V4 and V4–V6 primer sets.
Scientific Reports | (2021) 11:11848 | https://doi.org/10.1038/s41598-021-91387-w 9
Vol.:(0123456789)www.nature.com/scientificreports/
Figure 7. (continued)
together but all top of KEGG function were upregulated in the V4–V5 primer set (Fig. 7f). Definite clustering of
function between V3–V4 and V4–V6 primers were detected and the top of KEGG functions were upregulated
in V4–V6 primers in comparison to V3–V4 primers (Fig. 7g).
Discussion
Over the last decade, several regions of the 16S gene were used to characterize the chicken microbial popula-
tion, including V1–V246,47, V1–V3*3,48, V33,49, V43,7,50, V3–V551,52, V4–V63, V4–V553, V3–V45,54, and V1–V955.
At the same time, many studies on mammalian, human, or environmental samples raised the issues of data bias
introduced by methodology, including primer choices for 16S30–32. Moreover, the call for standardization of
microbiota profiling protocol has been issued in the human microbiome community39, but recently also among
poultry microbiome r esearchers40,56. The MBQC project that analyzed the effects of experimental sample collec-
tion, nucleic acid extraction, sequencing protocol, and bioinformatic approaches on 16S profiling of the human
fecal microbiota, determined that the extraction method, as well as 16S rRNA primers selection, are the main
sources of data fluctuation39. There is an evident need for a similar project in the poultry microbiome community
since every step in the microbiome sequencing protocol such as sample collection, DNA isolation, and library
preparation, can introduce bias to the data. Little attention so far has been drawn on the possible data bias due
to methodology issues or bioinformatic analysis for poultry microbiome analysis.
To gain a deeper understanding of how the 16S primer choice can influence the final results for microbiota
diversity and composition, we tested 8 different 16S primer pairs located in 7 different regions of the 16S rRNA
in broiler chicken cecal content. Two primer sets were located in the V1–V3 region and they differed only by few
Scientific Reports | (2021) 11:11848 | https://doi.org/10.1038/s41598-021-91387-w 10
Vol:.(1234567890)www.nature.com/scientificreports/
base pairs, and one pair was located within V3 and V4 region. The remaining 4 pairs span the V3–V4, V4–V5,
V3–V5, and V4–V6 regions of the 16S rRNA. Alpha and beta diversities analysis clearly showed huge differences
between these primer sets. It is interesting, that only a few base pair differences in a primer set designed for the
same 16S region (V1–V3(1) vs. V1–V3(2)) resulted also in a significant difference for Richness index and they
clustered separately when PCoA was employed. Our data are in agreement with previously published studies.
Zhao et al.3, using microbiome differences between high and low body weight chickens, described the differ-
ence in the number of species detected among V3, V4, V1–V3, and V4–V6 primer pairs. Moreover, V3 has been
shown to underestimated species R ichness3, while the V4 primer provides estimates similar to these obtained
20
by the full length of 1 6S and V4 primers showed the greatest similarity to community profiling determined
by shotgun s equencing30. In contrast to our studies, Bhogoyu and c olleagues55 have examined different regions
(V1–V9) in chickens and determined that most of the reads (60%) were located in very conserved V3 region fol-
lowed by V7–V8, V7, V8 (~ 14%), V4 (8.7%) and V9 and V2 region (from 1.2 to 2.2%). Other studies have shown
that primers can target certain strains allowing for non-proportional amplification of specific p opulations57,58.
Targeting V3–V4 regions favor enteric pathogens and gut m icroorganisms56. Moreover, in silico study by Kim
et al.59 identified V1–V3 and V1–V4 regions to be targeted for analysis of bacteria.
Hugerth and Andersson58 have shown that the choice of primers is very sensitive since the same bacterial
community amplified with different high-quality primer pairs can give a different microbiological profile. Indeed
in our studies, we have shown that primer choice had a significant effect on taxonomic composition in chicken
ceca. On the phylum level, Actinobacteria were favored by the V4 primer set while Bacteroidetes were detected
at a very low level with V3, V3–V4 and V3–V5 primer pairs. Similar significant changes were detected at the
family and species level. On the species level, Butyricicoccus pulliceacorum was detected at a high abundance level
only by V3–V4 and V3–V5 primer pairs while Blautia producta was favored by V3–V4 primers. It has been also
shown that taxonomic composition (classification) relies more on primer choice than the sequencing p latform30.
Additionally, we have shown that the predicted function of the microbiota differs among 16S primer sets. These
data clearly indicate that the primer set has a significant role in the determination of taxonomic composition and
that the employment of different primers may lead to a different interpretation of results. The same conclusion
was stated by others suggesting that the selection of specific hypervariable regions for 16S primers will influence
microbiome data and subsequent interpretation60,61. Moreover, studies of others showed that data generated
by different 16S primers are not directly comparable62–64. There are no universal primers, so always bias will
be introduced by selecting primer p airs30, therefore it would be perfect if we had a standardized protocol for
microbiome studies in poultry and could apply the same primer set across all studies to be able to compare data
sets between studies and discuss the data with published literature. Moreover, Trembley and c olleagues30 suggest
that protocol consistency, particularly the primer choice, is more important in comparative 16S studies than
the specific primers. On the other hand, Allali et al.38 confirmed differences between sequencing platforms and
libraries preparation protocols in the determination of microbial diversity and species richness in their studies
but they also suggested that the same biological conclusions could be drawn from data as long as the data are
collected and analyzed consistently throughout the course of the experiment.
In conclusion, similarly to previous reports of primer bias in human and other animal datasets, we have clearly
shown similar data bias due to the 16S primer choice in chicken samples. Moreover, be believe, that our results
might help researchers make an informed decision about which variable region should be selected for analysis
of chicken microbiota samples. This is only one factor that can affect the data generation and interpretation. Our
data also showed a need for a standardized protocol for 16S studies in poultry. If the protocol is not developed,
one of the possible solutions for this problem would be to study parallel regions of 16S r RNA65, but this may not
be the most cost-effective solution in poultry research.
Methods
Animals, experimental protocols, and tissue sampling. All animal care procedures were approved
by the USDA-ARS Institutional Animal Care and Use Committee. The study was carried out in compliance with
ARRIVE guidelines (https://arriveguidlines.org/arrive-guidelines). All methods were carried out in accordance
with relevant guidelines and regulations. Ross 708 broiler chicken (Longenecker’s Hatchery, Elizabethtown, PA)
were raised from hatch to day 35 in-floor pen settings. One hundred and fifty-two hatchlings were equally dis-
tributed between 4-floor pens, covered with wood shavings, and equipped with heat lamps, nipple drinkers, and
feeders. All birds had full access to a commercial type corn-soybean meal-based diet (starter from day 1 to day
21 or grower (day 21 to day 35) that met or exceeded all N RC66 recommendations as well as average nutrient
usage concentrations in the US for 201267. Cecal content samples were collected from birds (one per pen) 7, 21,
and 35 days post-hatch to determine the luminal bacterial population. Isolated specimens were snap-frozen in
liquid nitrogen and stored at − 80℃ until bacterial DNA isolation.
DNA isolation and library preparation. DNA was extracted from cecal contents and evaluated as
described previously68. The 16S rRNA amplicon libraries were generated according to Illumina’s workflow
and chemistry (Illumina, Inc., San Diego, CA). Eight PCR primer sets targeting different regions of the vari-
able region of the 16S rRNA (Table 1) were used. All selected primer sets were previously published and used
in poultry research. Amplicon PCR followed by index PCR, and PCR amplicon cleaning were performed as
described previously68. Concentration and quality of the amplicons were determined using QIAxcel DNA Hi-
Resolution cartridge, proprietary QIAxcel ScreenGel software (version 1.6.0, https://www.qiagen.com), and
QIAxcel Advanced System (Qiagen) per manufacturing instructions. Library pooling, dilution, denaturation,
and sequencing were performed as described in Proszkowiec-Weglarz et al.68. The 16S rRNA gene sequences
Scientific Reports | (2021) 11:11848 | https://doi.org/10.1038/s41598-021-91387-w 11
Vol.:(0123456789)www.nature.com/scientificreports/
Name Region Forward primer (5’ → 3’) Reverse primer (5’ → 3’) References
DAGAGTTTGATCMTGG TMTTACCGCGGCNGCT
V1–V3(1) V1–V3 Daquigan et al., 201669
CTCAG GGCAC
GAGAGTTTGATYMTGG
V1–V3(2) V1–V3 ACCGCGGCTGCTGGCAC Li et al., 201848
CTCAG
GATCCTACGGGAGGC
V3 V3 CTTACCGCGGCTGCTGGC Cao et al., 201849
AGCA
GTGCCAGCMGCCGCG GGACTACHVGGGTWT Zhang et al., 2018, Xu et al.,
V4 V4
GTAA CTA T 20187,50
GACTACHVGGGTATCTA
V3–V4 V3–V4 CCTACGGGNGGCWGCAG Klindworth et al., 201377
ATCC
GTGCCAGCMGCCGCG CCGTCAATTCMTTTRAG
V4–V5 V4–V5 Wang et al., 201853
GTAA TTT
V3–V5 V3–V5 CCTACGGGAGGCAGCAG CCGTCAATTCMTTTRAGT Lucke et al., 201378
V4–V6 V4–V6 GTGCCAGCMGCNGCGG3 GGGTTNCGNTCGTTG Zhao et al., 20133
Table 1. 16S rRNA primers used to analyze microbiota diversity, composition and function in chicken cecal
content.
determined in this study were deposited in the NCBI Sequence Read Archive (SRA) database (SRA accession #
PRJNA680391).
16S rRNA data processing and analysis. The quality of the raw reads was determined using the
FASTQC software (https://www.bioinformatics.babraham.ac.uk/projects/fastqc/). Raw sequences were trimmed
of adapters and low-quality reads and cleaned using the BBDuk program as part of the BBTools software suite
(BBMap—Bushnell B.—sourceforge.net/projects/bbmap/), using the following parameters: with parameters
ktrim=r k=23 mink=11 hdist=1 tpe tbo qtrim=rl trimq=10. BBMerge (part of the BBTools suite) was used to
determine if sequences in the pair-end library merged using the default settings. An optimization table was cre-
ated for paired-end and single-end reads for each primer set to determine the best parameters of non-chimeric
data. Based on the optimization table, only single-end (forward) sequences were imported into Quantitative
Insight Into Microbial Ecology (QIIME) software package 2 (version 2018.12.0, http://qiime2.org)24 to perform
quality control and analysis of the sequence reads. Demultiplexed, single-end sequence data were denoised with
DADA2. Naïve Bayesian classifier was used for taxonomic classification against the Greengenes database v13_8
(http://greengenes.secongenome.com). A sampling depth of 12,480 was used for alpha and beta diversity analy-
sis. QIIME data were transformed using R package Compositions72 followed by Phylogenetic Investigation of
Communities by Reconstruction of Unobserved States (PICRUSt)273 was used to predict metagenome path-
ways for each primer set using the Kyoto Encyclopedia of Genes and Genomes (KEGG)74. Statistical Analysis
of Metagenomic Profiles (STAMP)75 and Calypso software76 (cgenome.net, version 8.84) was used to create a
visualization of metabolic pathway comparison.
Statistical analyses. Microbiome composition data were obtained by normalization to the total number
of reads in each sample (relative abundance) and were analyzed using two-way (time and primer set) ANOVA
using GLM (SAS, ver. 9.4). Significance was set at P < 0.05. Differences between alpha diversity indices were
tested using the Kruskal–Wallis test (QIIME2). The difference in community structure due to main effects (time
and primer set) and their interaction were statistically tested by non-parametric multivariate ANOVA (PER-
MANOVA) with 999 permutations using QIIME 2 software package. Within STAMP analysis, ANOVA followed
by post-hoc Turkey-Kramer test77, corrected for False Discovery Rate (FDR, Benjamini–Hochberg a nalysis78)
was used for multiple group comparison while two group comparison was performed using Welsh t-test77 with
Benjamini-Hochber FDR analysis78.
Data availability
The 16S rRNA gene sequences determined in this study were deposited in the NCBI Sequence Read Archive
(SRA) database (SRA accession #PRJNA680391).
Received: 21 December 2020; Accepted: 26 May 2021
References
1. Clavijo, V. & Florez, M. J. V. The gastrointestinal microbiome and its association with the control of pathogens in broiler chicken
production: A review. Poult. Sci. 97, 1006–1021. https://doi.org/10.3382/ps/pex359 (2018).
2. Pan, D. & Yu, Z. Intestinal microbiome of poultry and its interaction with host and diet. Gut Microbes 5, 108–119. https://doi.org/
10.4161/gmic.26945 (2014).
3. Zhao, L. et al. Quantitative genetic background of the host influences gut microbiomes in chickens. Sci. Rep. 3, 1163. https://doi.
org/10.1038/srep01163 (2013).
4. Waite, D. W. & Taylor, M. W. Exploring the avian gut microbiota: current trends and future directions. Front. Microbiol. 6, 673.
https://doi.org/10.3389/fmicb.2015.00673 (2015).
Scientific Reports | (2021) 11:11848 | https://doi.org/10.1038/s41598-021-91387-w 12
Vol:.(1234567890)www.nature.com/scientificreports/
5. Kumar, S. et al. Effect of antibiotic withdrawal in feed on chicken gut microbial dynamics, immunity, growth performance and
prevalence of foodborne pathogens. PLoS ONE 13, e0192450. https://doi.org/10.1371/journal.pone.0192450 (2018).
6. Pineda-Quiroga, C. et al. Feeding broilers with dry whey powder and whey protein concentrate affected productive performance,
ileal digestibility of nutrients and cecal microbiota community. Animal 12, 692–700. https://doi.org/10.1017/S17517311170022
08 (2018).
7. Xu, S. et al. Bacillus licheniformis normalize the ileum microbiota of chickens infected with necrotic enteritis. Sci. Rep. 8, 1744.
https://doi.org/10.1038/s41598-018-20059-z (2018).
8. Yang, C. et al. Effects of encapsulated cinnamaldehyde and citral on the performance and cecal microbiota of broilers vaccinated
or not vaccinated against coccidiosis. Poult. Sci. 99, 936–948. https://doi.org/10.1016/j.psj.2019.10.036 (2020).
9. Wang, Y. et al. Effect of probiotics on the meat flavour and gut microbiota of chicken. Sci. Rep. 7, 6400. https://doi.org/10.1038/
s41598-017-06677-z (2017).
10. Gao, P. et al. Feed-additive probiotics accelerate yet antibiotics delay intestinal microbiota maturation in broiler chicken. Microbiome
5, 91. https://doi.org/10.1186/s40168-017-0315-1 (2017).
11. Jung, S. J., Houde, R., Baurhoo, B., Zhao, X. & Lee, B. H. Effects of galacto-oligosaccharides and a Bifidobacteria lactis-based
probiotic strain on the growth performance and fecal microflora of broiler chickens. Poult. Sci. 87, 1694–1699. https://doi.org/10.
3382/ps.2007-00489 (2008).
12. Xu, Z. R., Hu, C. H., Xia, M. S., Zhan, X. A. & Wang, M. Q. Effects of dietary fructooligosaccharide on digestive enzyme activities,
intestinal microflora and morphology of male broilers. Poult. Sci. 82, 1030–1036. https://doi.org/10.1093/ps/82.6.1030 (2003).
13. Oakley, B. B. et al. The cecal microbiome of commercial broiler chickens varies significantly by season. Poult. Sci. 97, 3635–3644.
https://doi.org/10.3382/ps/pey214 (2018).
14. Stanley, D., Hughes, R. J. & Moore, R. J. Microbiota of the chicken gastrointestinal tract: Influence on health, productivity and
disease. Appl. Microbiol. Biotechnol. 98, 4301–4310. https://doi.org/10.1007/s00253-014-5646-2 (2014).
15. Videnska, P. et al. Succession and replacement of bacterial populations in the caecum of egg laying hens over their whole life. PLoS
ONE 9, e115142. https://doi.org/10.1371/journal.pone.0115142 (2014).
16. Dwivedi, H. P. & Jaykus, L. A. Detection of pathogens in foods: the current state-of-the-art and future directions. Crit. Rev. Micro-
biol. 37, 40–63. https://doi.org/10.3109/1040841X.2010.506430 (2011).
17. Park, S. H. et al. Modifying the gastrointestinal ecology in alternatively raised poultry and the potential for molecular and metabo-
lomic assessment. Poult. Sci. 92, 546–561. https://doi.org/10.3382/ps.2012-02734 (2013).
18. Shang, Y., Kumar, S., Oakley, B. & Kim, W. K. Chicken gut microbiota: Importance and detection technology. Front. Vet. Sci. 5,
254. https://doi.org/10.3389/fvets.2018.00254 (2018).
19. Deusch, S., Tilocca, B., Camarinha-Silva, A. & Seifert, J. News in livestock research—Use of Omics-technologies to study the
microbiota in the gastrointestinal tract of farm animals. Comput. Struct. Biotechnol. J. 13, 55–63. https://doi.org/10.1016/j.csbj.
2014.12.005 (2015).
20. Youssef, N. et al. Comparison of species richness estimates obtained using nearly complete fragments and simulated pyrosequenc-
ing-generated fragments in 16S rRNA gene-based environmental surveys. Appl. Environ. Microbiol. 75, 5227–5236. https://doi.
org/10.1128/AEM.00592-09 (2009).
21. Hughes, J. B., Hellmann, J. J., Ricketts, T. H. & Bohannan, B. J. Counting the uncountable: Statistical approaches to estimating
microbial diversity. Appl. Environ. Microbiol. 67, 4399–4406. https://doi.org/10.1128/aem.67.10.4399-4406.2001 (2001).
22. Schloss, P. D. et al. Introducing mothur: Open-source, platform-independent, community-supported software for describing and
comparing microbial communities. Appl. Environ. Microbiol. 75, 7537–7541. https://doi.org/10.1128/AEM.01541-09 (2009).
23. Caporaso, J. G. et al. QIIME allows analysis of high-throughput community sequencing data. Nat. Methods 7, 335–336. https://
doi.org/10.1038/nmeth.f.303 (2010).
24. Bolyen, E. et al. Reproducible, interactive, scalable and extensible microbiome data science using QIIME 2. Nat. Biotechnol. 37,
852–857. https://doi.org/10.1038/s41587-019-0209-9 (2019).
25. Bokulich, N. A. et al. Optimizing taxonomic classification of marker-gene amplicon sequences with QIIME 2’s q2-feature-classifier
plugin. Microbiome 6, 90. https://doi.org/10.1186/s40168-018-0470-z (2018).
26. DeSantis, T. Z. et al. Greengenes, a chimera-checked 16S rRNA gene database and workbench compatible with ARB. Appl. Environ.
Microbiol. 72, 5069–5072. https://doi.org/10.1128/AEM.03006-05 (2006).
27. Cole, J. R. et al. Ribosomal database project: Data and tools for high throughput rRNA analysis. Nucleic Acids Res. 42, D633-642.
https://doi.org/10.1093/nar/gkt1244 (2014).
28. Pruesse, E. et al. SILVA: A comprehensive online resource for quality checked and aligned ribosomal RNA sequence data compat-
ible with ARB. Nucleic Acids Res. 35, 7188–7196. https://doi.org/10.1093/nar/gkm864 (2007).
29. Choi, K. Y., Lee, T. K. & Sul, W. J. Metagenomic analysis of chicken gut microbiota for improving metabolism and health of
chickens—A review. Asian-Australas J. Anim. Sci. 28, 1217–1225. https://doi.org/10.5713/ajas.15.0026 (2015).
30. Tremblay, J. et al. Primer and platform effects on 16S rRNA tag sequencing. Front. Microbiol. 6, 771. https://d oi.o
rg/1 0.3 389/f micb.
2015.00771 (2015).
31. Fouhy, F., Clooney, A. G., Stanton, C., Claesson, M. J. & Cotter, P. D. 16S rRNA gene sequencing of mock microbial populations—
Impact of DNA extraction method, primer choice and sequencing platform. BMC Microbiol. 16, 123. https://doi.org/10.1186/
s12866-016-0738-z (2016).
32. Rintala, A. et al. Gut microbiota analysis results are highly dependent on the 16S rRNA gene target region, whereas the impact of
DNA extraction is minor. J. Biomol. Tech. 28, 19–30. https://doi.org/10.7171/jbt.17-2801-003 (2017).
33. Jones, M. B. et al. Library preparation methodology can influence genomic and functional predictions in human microbiome
research. Proc. Natl. Acad. Sci. U S A 112, 14024–14029. https://doi.org/10.1073/pnas.1519288112 (2015).
34. Yu, G., Fadrosh, D., Goedert, J. J., Ravel, J. & Goldstein, A. M. Nested PCR biases in interpreting microbial community structure
in 16S rRNA gene sequence datasets. PLoS ONE 10, e0132253. https://doi.org/10.1371/journal.pone.0132253 (2015).
35. Pankoke, H. et al. F5Evaluation of commercially available DNA extraction kits for the analysis of the broiler chicken cecal micro-
biota. FEMS Microbiol. Lett. https://doi.org/10.1093/femsle/fnz033 (2019).
36. Krakat, N., Anjum, R., Demirel, B. & Schroder, P. Methodological flaws introduce strong bias into molecular analysis of microbial
populations. J. Appl. Microbiol. 122, 364–377. https://doi.org/10.1111/jam.13365 (2017).
37. Dechesne, A., Musovic, S., Palomo, A., Diwan, V. & Smets, B. F. Underestimation of ammonia-oxidizing bacteria abundance by
amplification bias in amoA-targeted qPCR. Microb. Biotechnol. 9, 519–524. https://doi.org/10.1111/1751-7915.12366 (2016).
38. Allali, I. et al. A comparison of sequencing platforms and bioinformatics pipelines for compositional analysis of the gut microbiome.
BMC Microbiol. 17, 194. https://doi.org/10.1186/s12866-017-1101-8 (2017).
39. Sinha, R., Abnet, C. C., White, O., Knight, R. & Huttenhower, C. The microbiome quality control project: Baseline study design
and future directions. Genome Biol. 16, 276. https://doi.org/10.1186/s13059-015-0841-8 (2015).
40. Borda-Molina, D., Seifert, J. & Camarinha-Silva, A. Current perspectives of the chicken gastrointestinal tract and its microbiome.
Comput. Struct. Biotechnol. J. 16, 131–139. https://doi.org/10.1016/j.csbj.2018.03.002 (2018).
41. Wang, L., Lilburn, M. & Yu, Z. Intestinal microbiota of broiler chickens as affected by litter management regimens. Front. Microbiol.
7, 593. https://doi.org/10.3389/fmicb.2016.00593 (2016).
42. Sergeant, M. J. et al. Extensive microbial and functional diversity within the chicken cecal microbiome. PLoS ONE 9, e91941.
https://doi.org/10.1371/journal.pone.0091941 (2014).
Scientific Reports | (2021) 11:11848 | https://doi.org/10.1038/s41598-021-91387-w 13
Vol.:(0123456789)www.nature.com/scientificreports/
43. Borda-Molina, D., Vital, M., Sommerfeld, V., Rodehutscord, M. & Camarinha-Silva, A. Insights into broilers’ gut microbiota fed
with phosphorus, calcium, and phytase supplemented diets. Front. Microbiol. 7, 2033. https://doi.org/10.3389/fmicb.2016.02033
(2016).
44. Danzeisen, J. L., Kim, H. B., Isaacson, R. E., Tu, Z. J. & Johnson, T. J. Modulations of the chicken cecal microbiome and metagenome
in response to anticoccidial and growth promoter treatment. PLoS ONE 6, e27949. https://doi.org/10.1371/journal.pone.0027949
(2011).
45. Meng, H. et al. Body weight selection affects quantitative genetic correlated responses in gut microbiota. PLoS ONE 9, e89862.
https://doi.org/10.1371/journal.pone.0089862 (2014).
46. Borda-Molina, D. et al. Effects of protease and phytase supplements on small intestinal microbiota and amino acid digestibility in
broiler chickens. Poult. Sci. 98, 2906–2918. https://doi.org/10.3382/ps/pez038 (2019).
47. Pineda-Quiroga, C. et al. Microbial and functional profile of the ceca from laying hens affected by feeding prebiotics, probiotics,
and synbiotics. Microorganisms 7. https://doi.org/10.3390/microorganisms7050123 (2019).
48. Li, B. et al. The effect of inulin and wheat bran on intestinal health and microbiota in the early life of broiler chickens. Poult. Sci.
97, 3156–3165. https://doi.org/10.3382/ps/pey195 (2018).
49. Cao, G. T. et al. Modulation of broilers’ caecal microflora and metabolites in response to a potential probiotic Bacillus amylolique-
faciens. J. Anim. Physiol. Anim. Nutr. 102, e909–e917. https://doi.org/10.1111/jpn.12856 (2018).
50. Zhang, B. et al. Dietary l-arginine supplementation alleviates the intestinal injury and modulates the gut microbiota in broiler
chickens challenged by Clostridium perfringens. Front. Microbiol. 9, 1716. https://doi.org/10.3389/fmicb.2018.01716 (2018).
51. Metzler-Zebeli, B. U. et al. Fecal microbiota transplant from highly feed efficient donors affects cecal physiology and microbiota
in low- and high-feed efficient chickens. Front. Microbiol. 10, 1576. https://doi.org/10.3389/fmicb.2019.01576 (2019).
52. Metzler-Zebeli, B. U. et al. Feed restriction modifies intestinal microbiota-host mucosal networking in chickens divergent in
residual feed intake. mSystems 4. https://doi.org/10.1128/mSystems.00261-18 (2019).
53. Wang, J., Nesengani, L. T., Gong, Y., Yang, Y. & Lu, W. 16S rRNA gene sequencing reveals effects of photoperiod on cecal microbiota
of broiler roosters. PeerJ 6, e4390. https://doi.org/10.7717/peerj.4390 (2018).
54. Biasato, I. et al. Modulation of intestinal microbiota, morphology and mucin composition by dietary insect meal inclusion in
free-range chickens. BMC Vet. Res. 14, 383. https://doi.org/10.1186/s12917-018-1690-y (2018).
55. Bhogoju, S., Nahashon, S., Wang, X., Darris, C. & Kilonzo-Nthenge, A. A comparative analysis of microbial profile of Guinea fowl
and chicken using metagenomic approach. PLoS ONE 13, e0191029. https://doi.org/10.1371/journal.pone.0191029 (2018).
56. Feye, K. M., Thompson, D. R., Rothrock, M. J. Jr., Kogut, M. H. & Ricke, S. C. Poultry processing and the application of microbiome
mapping. Poult. Sci. 99, 678–688. https://doi.org/10.1016/j.psj.2019.12.019 (2020).
57. Yu, Z. & Morrison, M. Comparisons of different hypervariable regions of rrs genes for use in fingerprinting of microbial com-
munities by PCR-denaturing gradient gel electrophoresis. Appl. Environ. Microbiol. 70, 4800–4806. https://doi.org/10.1128/AEM.
70.8.4800-4806.2004 (2004).
58. Hugerth, L. W. & Andersson, A. F. Analysing microbial community composition through amplicon sequencing: From sampling
to hypothesis testing. Front. Microbiol. 8, 1561. https://doi.org/10.3389/fmicb.2017.01561 (2017).
59. Kim, M., Morrison, M. & Yu, Z. Evaluation of diffrent partial 16S rRNA gene sequence regions for phylogenetic analysis of micro-
biomes. J. Microbiol. Methods 84, 81–87 (2011).
60. Comeau, A. M., Douglas, G. M. & Langille, M. G. Microbiome helper: A custom and streamlined workflow for microbiome
research. mSystems 2. https://doi.org/10.1128/mSystems.00127-16 (2017).
61. Brandt, J. & Albertsen, M. Investigation of detection limits and the influence of DNA extraction and primer choice on the observed
microbial communities in drinking water samples using 16S rRNA gene amplicon sequencing. Front. Microbiol. 9, 2140. https://
doi.org/10.3389/fmicb.2018.02140 (2018).
62. Nossa, C. W. et al. Design of 16S rRNA gene primers for 454 pyrosequencing of the human foregut microbiome. World J. Gastro-
enterol. 16, 4135–4144. https://doi.org/10.3748/wjg.v16.i33.4135 (2010).
63. Soergel, D. A., Dey, N., Knight, R. & Brenner, S. E. Selection of primers for optimal taxonomic classification of environmental 16S
rRNA gene sequences. ISME J. 6, 1440–1444. https://doi.org/10.1038/ismej.2011.208 (2012).
64. Yang, B., Wang, Y. & Qian, P. Y. Sensitivity and correlation of hypervariable regions in 16S rRNA genes in phylogenetic analysis.
BMC Bioinform. 17, 135. https://doi.org/10.1186/s12859-016-0992-y (2016).
65. Smith, B. C. et al. The cervical microbiome over 7 years and a comparison of methodologies for its characterization. PLoS ONE 7,
e40425. https://doi.org/10.1371/journal.pone.0040425 (2012).
66. National Research Council. Nutrient Requirements of Poultry 9th Rev. (National Academy of Science, 1994).
67. AgriStats. AgriStats. End of Year Summary: 2011. (Agri Stats, Inc, 2012).
68. Proszkowiec-Weglarz, M. et al. Research Note: Effect of butyric acid glycerol esters on ileal and cecal mucosal and luminal micro-
biota in chickens challenged with Eimeria maxima. Poult. Sci. 99, 5143–5148. https://doi.org/10.1016/j.psj.2020.06.022 (2020).
69. Daquigan, N., Grim, C. J., White, J. R., Hanes, D. E. & Jarvis, K. G. Early Recovery of Salmonella from Food Using a 6-Hour Non-
selective Pre-enrichment and Reformulation of Tetrathionate Broth. Front Microbiol 7, 2103 https://doi.org/10.3389/fmicb.2016.
02103 (2016).
70. Anna, K. E., Timmy, P., Jörg, S., Christian, P., Matthias, Q., Oliver, H. F., Glöckner (2013) Evaluation of general 16S ribosomal
RNA gene PCR primers for classical and next-generation sequencing-based diversity studies. Nucleic Acids Research 41(1), e1–e1
https://doi.org/10.1093/nar/gks808
71. Annegret, L. J., Qendrim, B., Zebeli B. U., Metzler-Zebeli (2018) Dietary Deoxynivalenol Contamination and Oral Lipopolysac-
charide Challenge Alters the Cecal Microbiota of Broiler Chickens. Frontiers in Microbiology 9, 804 https://doi.org/10.3389/fmicb.
2018.00804
72. R: A Language and Environment for Statistical Computing (R Foundation for Statistical Computing, 2020).
73. Douglas, G. M. et al. PICRUSt2 for prediction of metagenome functions. Nat. Biotechnol. 38, 685–688. https://doi.org/10.1038/
s41587-020-0548-6 (2020).
74. Kanehisa, M., Sato, Y., Kawashima, M., Furumichi, M. & Tanabe, M. KEGG as a reference resource for gene and protein annota-
tion. Nucleic Acids Res. 44, D457-462. https://doi.org/10.1093/nar/gkv1070 (2016).
75. Parks, D. H., Tyson, G. W., Hugenholtz, P. & Beiko, R. G. STAMP: Statistical analysis of taxonomic and functional profiles. Bioin-
formatics 30, 3123–3124. https://doi.org/10.1093/bioinformatics/btu494 (2014).
76. Zakrzewski, M. et al. Calypso: A user-friendly web-server for mining and visualizing microbiome-environment interactions.
Bioinformatics 33, 782–783. https://doi.org/10.1093/bioinformatics/btw725 (2017).
77. Bluman, A. G. Elementary Statistics: A Step by Step Approach (6th edn). (Higher Education, 2007).
78. Benjamini, Y. & Hochberg, Y. Controlling the false discovery rate: A practical and powerful approach to multiple testing. R. Stat.
Soc. B 57, 289–300 (1995).
Acknowledgements
N.D. was supported by the Research Participation Program at the USDA, administered by the Oak Ridge Institute
for Science and Education through an interagency agreement between the U.S. Department of Energy and the
USDA. The work was funded by in house USDA-ARS CRIS # 8042-31000-108-00D.
Scientific Reports | (2021) 11:11848 | https://doi.org/10.1038/s41598-021-91387-w 14
Vol:.(1234567890)www.nature.com/scientificreports/
Author contributions
M.P.-W. conceived and designed research; M.P.-W., and L.L.S. performed experiments and analyzed samples;
N.D., J.S., and M.P.-W. analyzed data; N.D., J.S., and M.P.-W. interpreted results of experiments; N.D. drafted
manuscript; N.D., J.S., L.L.S., and M.P.-W. edited and revised manuscript; all authors approved final version of
the manuscript.
Competing interests
The authors declare no competing interests.
Additional information
Correspondence and requests for materials should be addressed to M.P.-W.
Reprints and permissions information is available at www.nature.com/reprints.
Publisher’s note Springer Nature remains neutral with regard to jurisdictional claims in published maps and
institutional affiliations.
Open Access This article is licensed under a Creative Commons Attribution 4.0 International
License, which permits use, sharing, adaptation, distribution and reproduction in any medium or
format, as long as you give appropriate credit to the original author(s) and the source, provide a link to the
Creative Commons licence, and indicate if changes were made. The images or other third party material in this
article are included in the article’s Creative Commons licence, unless indicated otherwise in a credit line to the
material. If material is not included in the article’s Creative Commons licence and your intended use is not
permitted by statutory regulation or exceeds the permitted use, you will need to obtain permission directly from
the copyright holder. To view a copy of this licence, visit http://creativecommons.org/licenses/by/4.0/.
© The Author(s) 2021
Scientific Reports | (2021) 11:11848 | https://doi.org/10.1038/s41598-021-91387-w 15
Vol.:(0123456789)You can also read