Distinct Basal Metabolism in Three Mouse Models of Neurodevelopmental Disorders - eNeuro
←
→
Page content transcription
If your browser does not render page correctly, please read the page content below
Research Article: New Research

Disorders of the Nervous System

Distinct Basal Metabolism in Three Mouse Models
of Neurodevelopmental Disorders
Caitlin Menzies,1,2 Shama Naz,3 David Patten,3                             Thierry Alquier,4,5 Brian M. Bennett,6 and
Baptiste Lacoste1,2,7

https://doi.org/10.1523/ENEURO.0292-20.2021
1
  Neuroscience Program, Ottawa Hospital Research Institute, Ottawa, Ontario K1H 8L6, Canada, 2Faculty of Medicine,
Department of Cellular and Molecular Medicine, University of Ottawa, Ottawa, Ontario K1H 8M5, Canada, 3University
of Ottawa Metabolomics Core Facility, Faculty of Medicine, Ottawa, Ontario K1H 8M5, Canada, 4Montreal Diabetes
Research Center and Centre de Recherche du Centre Hospitalier de l’Université de Montréal (CRCHUM), Montréal,
Quebec H1W 4A4, Canada, 5Department of Medicine, Université de Montréal, Montréal, Quebec H3T 1J4, Canada,
6
  Faculty of Health Sciences, Department of Biomedical and Molecular Sciences and Centre for Neuroscience Studies,
Queens University, Kingston, Ontario K7L 3N6, Canada, and 7University of Ottawa Brain and Mind Research Institute,
Ottawa, Ontario K1H 8M5, Canada

Abstract
Prevalence of metabolic disturbances is higher among individuals with neurodevelopmental disorders (NDDs), yet this as-
sociation has been largely overlooked. Investigation into human disease remains challenging, as a complete pathophysio-
logical understanding relies on accurate modeling and highly controlled variables. Genetically engineered mouse models
are widely used to gain insight into the biology of human NDDs, but research focus has been on behavioral and neuro-
physiological abnormalities. Such models not only allow for evaluating usefulness in reproducing human features, including
similarities and discrepancies with rodent phenotypes, but they also represent a unique opportunity to observe and quan-
tify novel anomalies. Here, we present the first characterization and comparison of basal metabolism in three mouse mod-
els of NDDs, namely, Down syndrome (DS; Dp(16)Yey/1 mice), 16p11.2 deletion syndrome (16pDel; 16p11.2df/1 mice),
and fragile X syndrome [FXS; Fmr1 knock-out (KO) mice] and their wild-type (WT) counterparts. Using the Comprehensive
Lab Animal Monitoring System (CLAMS) coupled to EchoMRI, as well as quantification of key plasma metabolites by liq-
uid chromatography mass spectrometry (LC-MS), our in vivo study reveals that each mouse model expresses a unique
metabolic signature that is sex-specific, independent of the amount of food consumed and minimally influenced by physi-
cal activity. In particular, we identify striking differences in body composition, respiratory exchange ratio (RER), caloric ex-
penditure (CE), and concentrations of circulating plasma metabolites related to mitochondrial function. Providing novel
insight into NDD-associated metabolic alterations is an essential prerequisite for future preclinical and clinical interventions.
Key words: 16p11.2 deletion syndrome; basal metabolism; Down syndrome; fragile X syndrome; neurodevelop-
mental disorders; plasma metabolites

    Significance Statement
    Most studies on neurodevelopmental and autism spectrum disorders (ASDs) have focused on neurophysiological
    mechanisms, yet these disorders are also associated with metabolic abnormalities in humans. Despite this known
    association, the link between metabolic imbalance and neurodevelopmental disorders (NDDs) has been largely
    overlooked, particularly in a fundamental research setting. Here, to address this knowledge gap, we performed the
    first systematic characterization of basal metabolism in mouse models of Down syndrome (DS), 16p11.2 deletion
    syndrome (16pDel), and fragile X syndrome (FXS), revealing unique metabolic signatures. This work provides a
    basis for future studies aimed at understanding mechanisms underlying metabolic dysfunction in NDDs.

                                                                                   Author contributions: B.L. and D.P. designed research; C.M. and D.P. performed
Received July 3, 2020; accepted March 15, 2021; First published April 5, 2021.   research; B.M.B. contributed unpublished reagents/analytic tools; C.M., B.L., D.P., S.
  The authors declare no competing financial interests.                          N., and T.A. analyzed data; C.M., B.M.B., B.L., D.P., S.N., and T.A. wrote the paper.

March/April 2021, 8(2) ENEURO.0292-20.2021 1–14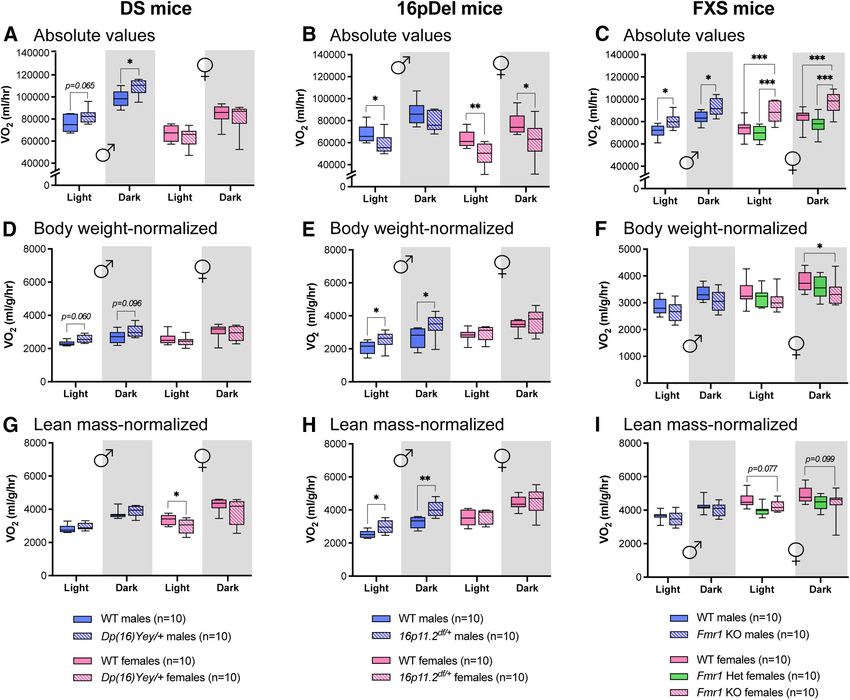
Research Article: New Research      2 of 14

Introduction                                                                      associated with cardiovascular disease, obesity and hyper-
   Down syndrome (DS), 16p11.2 deletion syndrome                                  tension (Crabbe et al., 1993; McLennan et al., 2011). As FXS
(16pDel), and fragile X syndrome (FXS) are neurodevelop-                          is an X-linked syndrome, males are more commonly affected
mental disorders (NDDs) of distinct genetic origins commonly                      by FXS and typically display severe phenotypes. Females
associated with intellectual disability, developmental delay                      may harbor a heterozygous or homozygous FXS mutation
and autism spectrum disorders (ASDs; Miller et al., 2009;                         (Linden et al., 1999; Bartholomay et al., 2019). Heterozygous
Hanson et al., 2010; McLennan et al., 2011; Shields et al.,                       females produce ;80% of the FMRP levels and display mild
2017). These particular NDDs are also associated with higher                      phenotypes (Bartholomay et al., 2019). Rarer homozygous
incidence of obesity, hypertension, hormonal dysfunction,                         FXS females display phenotypes similar to male FXS individu-
heart defects and diabetes in comparison to the general pop-                      als (Linden et al., 1999; Bartholomay et al., 2019).
ulation (McLennan et al., 2011; Miller et al., 2009; Croen et al.,                   Genetically engineered mouse models of DS, 16pDel,
2015; Shields et al., 2017; Flygare Wallén et al., 2018).                         and FXS have proven reliable tools in preclinical research
   DS is caused by the presence of a third copy of chro-                          (Bakker et al., 1994; Roubertoux and Carlier, 2010; Yang
mosome 21. DS individuals display developmental delay                             et al., 2015; Arbogast et al., 2016; Herault et al., 2017;
and behavioral abnormalities (Mazurek and Wyka, 2015),                            Lovelace et al., 2018). To model DS in this study, we used
and infants are often premature with low birthweights and                         Dp(16)Yey/1 mice that harbor trisomy of the orthologous
heart defects leading to higher rates of neonate mortality                        genes of human chromosome 21 (Hsa21) that are present
(Vis et al., 2009; Mazurek and Wyka, 2015). Adult DS pa-                          on Mmu16. These mice embody cognitive and develop-
tients display obesity, insulin resistance, type 2 diabetes                       mental aspects reminiscent of human DS (Li et al., 2007;
and decreased cardiovascular fitness (Vis et al., 2009;                           Roubertoux and Carlier, 2010; Yu et al., 2010; Herault et
Mendonca et al., 2010; Real de Asua et al., 2014;                                 al., 2017). Heterozygous 16p11.2df/1 mice represent a ro-
Bertapelli et al., 2016; Shields et al., 2017). Despite expe-                     bust 16pDel model. They possess a deletion (;440 kb, 27
riencing multiple cardiovascular risk factors, DS individu-                       genes) of the 7qF3 region of synteny conservation with the
als display lower rates of coronary artery disease and                            human 16p11.2 locus (Horev et al., 2011). Compared with
atherosclerotic damage, particularly among males                                  their wild-type (WT) littermates, 16p11.2df/1 mice display al-
(Vianello et al., 2013; Sobey et al., 2015). 16pDel origi-                        terations including social interactions deficits and hyperactiv-
nates from a hemizygous deletion at the 16p11.2 locus,                            ity. These mice also display lower birthweight and decreased
resulting in the loss of ;500 kb of DNA and haploinsuffi-                         adiposity in adults, improved glucose tolerance, decreased
ciency of ;30 genes. Individuals harboring a 16p11.2 de-                          leptin and free fatty acid levels, as well as cerebrovascular
letion are characterized by developmental delay and                               deficits (Horev et al., 2011; Portmann et al., 2014; Arbogast et
speech and language problems (Miller et al., 2009;                                al., 2016; Ouellette et al., 2020). Finally, Fmr1 / knock-out
Hanson et al., 2010; Horev et al., 2011). 16pDel is also as-                      (KO) mice are commonly used to model human FXS. Fmr1 /
sociated with obesity and hyperinsulinaemic hypoglyce-                            mice harbor a KO allele of the Fmr1 gene located on the X
mia (Kostopoulou et al., 2019). Male carriers are at higher                       chromosome. Although different from human FXS, Fmr1 /
risk of developing hypertension, whereas female carriers                          mice lack FMRP expression (Hoogeveen and Oostra, 1997;
are at greater risk of developing type 2 diabetes (Croen et                       Dahlhaus, 2018). Fmr1 / mice display phenotypes including
al., 2015; Flygare Wallén et al., 2018). Finally, FXS is                          enhanced sensitivity to sensory stimuli, hyperactivity and
caused by an expansion of CGG repeats in the promoter                             physical characteristics (Hoogeveen and Oostra, 1997;
region of the FMR1 gene, which prevents production of                             Dahlhaus, 2018; Lovelace et al., 2018). These mice also dis-
fragile X mental retardation protein (FMRP; Hoogeveen                             play increased glucose tolerance and insulin sensitivity, as
and Oostra, 1997; McLennan et al., 2011; Dahlhaus,                                well as a shift toward lipid utilization (Leboucher et al., 2019).
2018). FXS is one of the most common genetic causes of                               Despite this context, a systematic characterization of
moderate-to-severe intellectual impairments but is also                           basal metabolism in these three mouse models is lacking.
                                                                                  Here, we performed a comprehensive assessment of
                                                                                  basal metabolism of DS, 16pDel, and FXS mice by meas-
  This work was supported by Canadian Institutes of Health Research Grants
                                                                                  uring body composition, physiological indices and se-
388805 (to B.L.) and 153013 (to B.M.B.) and by a Canadian Vascular Network
Scholarship (C.M.). T.A. holds a salary Award from Fonds de Recherche Santé       lected plasma metabolites.
Québec. The Metabolomics Core Facility is supported by the Terry Fox
Research Institute and the University of Ottawa.
  Acknowledgements: We thank Dr. Mary-Ellen Harper for providing CLAMS
                                                                                  Materials and Methods
cages; Dr. Julie St-Pierre, director of the uOttawa Metabolomics Core Facility;
                                                                                    All animal procedures were conducted in accordance to
Dr. Matthew McDonald and Dr. Yan Burelle for feedback on this manuscript;         guidelines of the Canadian Council on Animal Care.
Diane Anderson and Lihua Xue for technical assistance; the Behavioural Core
Facility at uOttawa for assistance; and the Animal Care and Veterinary
Services at uOttawa for guidance.                                                 Animals
  Correspondence should be addressed to Baptiste Lacoste at blacoste@               Dp(16)Yey/1 “DS” mice (stock #013530; mixed B6/129
uottawa.ca.                                                                       background) were obtained from The Jackson Laboratory
  https://doi.org/10.1523/ENEURO.0292-20.2021                                     through the Cytogenetics and Down Syndrome Resource
Copyright © 2021 Menzies et al.
                                                                                  funded by a contract from the National Institute of Child
This is an open-access article distributed under the terms of the Creative
Commons Attribution 4.0 International license, which permits unrestricted use,
                                                                                  Health and Human Development/National Institutes of
distribution and reproduction in any medium provided that the original work is    Health (275201000006C-3-0-1). These mice harbor tris-
properly attributed.                                                              omy of the Mmu16 region of synteny with the Down

March/April 2021, 8(2) ENEURO.0292-20.2021                                                                                                eNeuro.org
Research Article: New Research      3 of 14

Syndrome Critical Region (DSCR) on Hsa21 and carry 113        inches (17.75 cm) in diameter, 5.625 inches (14.25 cm) in
genes orthologous to genes on Hsa21 (Roubertoux and           ceiling height. Overall size with base and stand: 15 inches
Carlier, 2010; Herault et al., 2017). 16p11.2df/1 “16pDel”    (38 cm) wide, 11 inches (28 cm) deep, 23 inches (58.4 cm)
mice (Horev et al., 2011) were purchased from The             high. Animals were monitored daily for well-being.
Jackson Laboratory (stock #013128; mixed B6/129 back-         Equipment was calibrated before data collection by the
ground). Heterozygous 16p11.2df/1 mice possess a dele-        University of Ottawa’s Behavioural Core services and
tion of the 7qF3 region of synteny conservation with the      checked daily to ensure proper functioning. The CLAMS
human 16p11.2 locus. Fmr1 / “FXS” mice (Bakker et al.,        software automatically calculates output measures of vol-
1994) were purchased from The Jackson Laboratory              ume of O2 consumption (VO2), volume of CO2 production
(stock #004624, mixed FVB/129 background). These              (VCO2), respiratory exchange ratio (RER), caloric expendi-
mice lack of expression of the Fmr1 gene product.             ture (CE), and food intake, as well as physical activity levels.
                                                              The physiological effects of stress are minimized by allowing
Mouse husbandry                                               24 h of habituation before data collection and minimal noise
   All mice were bred in-house and housed maximum five        in the experimental area (Arch, et al., 2006; Ramos-Jimenez
per cage at room temperature with free access to water        et al., 2008; Gupta et al., 2017).
and food. Animals were maintained on Teklad Global               IC is based on the principal that the conversion of car-
18% Protein Rodent Diet (Harlan Laboratories, Teklad          bohydrates, fats and proteins into chemical energy results
Diets) composed in part of 18.6% protein, 6.2% fat, 3.5%      in a substance-specific ratio of O2 required for catabolism
fiber, and 44.2% carbohydrates. Male 16p11.2df/1 were         of macronutrients and CO2 produced as a by-product
crossed with WT females to obtain hemizygous                  (Ramos-Jimenez et al., 2008; Watson et al., 2014; Arch et
16p11.2df/1 mice and WT littermates. Fmr1 / males             al., 2006; Mtaweh et al., 2018). A number of factors must
were bred with Fmr1 / females to obtain Fmr1 / prog-          be considered for accurate IC measurement. Total CE
eny, and Fmr1 / males were bred with FVB females to           measured by CLAMS is a composite of resting energy
obtain Fmr11/ heterozygous animals. Male Dp(16)Yey/1          expenditure (REE), activity-related energy expenditure
mice were bred with female C57BL/6J mice (The Jackson         (AEE), and the thermic effect of feeding (TEF). REE is the
Laboratory) to obtain hemizygous Dp(16)Yey/1 mice and         energy required for the body to conduct the biochemical
WT littermates.                                               reactions required to sustain life and accounts for most
                                                              bodily energy expenditure of mammals. AEE refers to en-
                                                              ergy used while performing elective movement, such as
Genotyping
                                                              walking or running. TEF refers to the energy lost in the
  16p11.2df/1 mice and WT littermates were genotyped
                                                              form of heat in the process of substrate utilization
by PCR using the two following primers: 59-
                                                              (Mtaweh et al., 2018). CLAMS cages provide an environ-
CCTCATGGACTAATTATGGAC-39 (forward) and 59-CCA
                                                              ment that minimizes the contribution of AEE and TEF. The
GTTTCACTAATGACACA-39 (reverse). Fmr1 / mice and
                                                              CLAMS chambers where mice are housed are small and
WT littermates were genotyped by PCR using the three
                                                              limit movement of the animal thus limiting AEE. TEF is mi-
following primers: 59-CACGAGACTAGTGAGACGTG-39
                                                              tigated by continuous feeding throughout the experiment
(mutant forward), 59-TGTGATAGAATATGCAGCATGTGA-
                                                              and housing animals in a thermo-neutral environment
39 (WT forward), and 59-CTTCTGGCACCTCCAGCTT-39
                                                              (Ramos-Jimenez et al., 2008; Mtaweh et al., 2018).
(common). Dp(16)Yey/1 mice and WT littermates were
                                                                 Gas exchanges were measured every 26 min over a 72-
genotyped by PCR by a commercial vendor (Transnetyx)
                                                              h period consisting of an initial 24-h habituation period fol-
using proprietary primers.
                                                              lowed by 48 h of data collection. The RER value repre-
In vivo basal metabolism assessment                           sents the ratio of VCO2 produced to VO2 consumed. Total
   Live, awake 10-week-old mice were weighed, placed in       CE was calculated by a multi-step equation where a “cal-
an enclosed tube and inserted into the Echo-MRI machine       orific value,” a standardized number of kilocalories gener-
(EchoMRI-700, EchoMRI LLC) for 2–3 min. EchoMRI device        ated per liter of O2 consumed, was first obtained by using
employs magnetic resonance imaging to quantify total body     RER. This calorific value was then multiplied by the VO2 of
weight, lean mass and fat mass in grams. Immediately fol-     the organism to obtain the number of kilocalories used
lowing EchoMRI scanning, mice were individually housed at     per unit of time. Food intake was measured as the cumu-
thermo-neutrality (28°C) into Comprehensive Lab Animal        lative amount of food consumed from the beginning of the
Monitoring System (CLAMS) cages (CLAMS-CF and                 experiment at each measurement period. Physical activity
Oxymax software, Columbus Instruments) for metabolic          of animals was measured via an infrared beam system.
measurements using indirect calorimetry (IC). A thermo-       Data are presented in terms of “beam breaks” where the
neutral environment eliminates the need for the body to ex-   number of times different beams were interrupted by the
pend energy heating the body (Ramos-Jimenez et al., 2008;     animal during the interval of time from one sampling ses-
Gupta et al., 2017; Mtaweh et al., 2018). CLAMS cages are     sion to the next.
open circuit systems in which subjects breathe in gases          CLAMS data were expressed both in absolute terms,
that match atmospheric composition in an airtight acrylic     and normalized to body weight and to lean mass, as rec-
chamber meant to mimic a home-cage, thermo-neutral en-        ommended for comparison of populations with differential
vironment with open access to food and water. CLAMS           anthropomorphic characteristics or metabolic health sta-
chambers are of the following dimensions. Livable area: 7     tus (Arch et al., 2006; Watson et al., 2014; Van Eersel et

March/April 2021, 8(2) ENEURO.0292-20.2021                                                                           eNeuro.org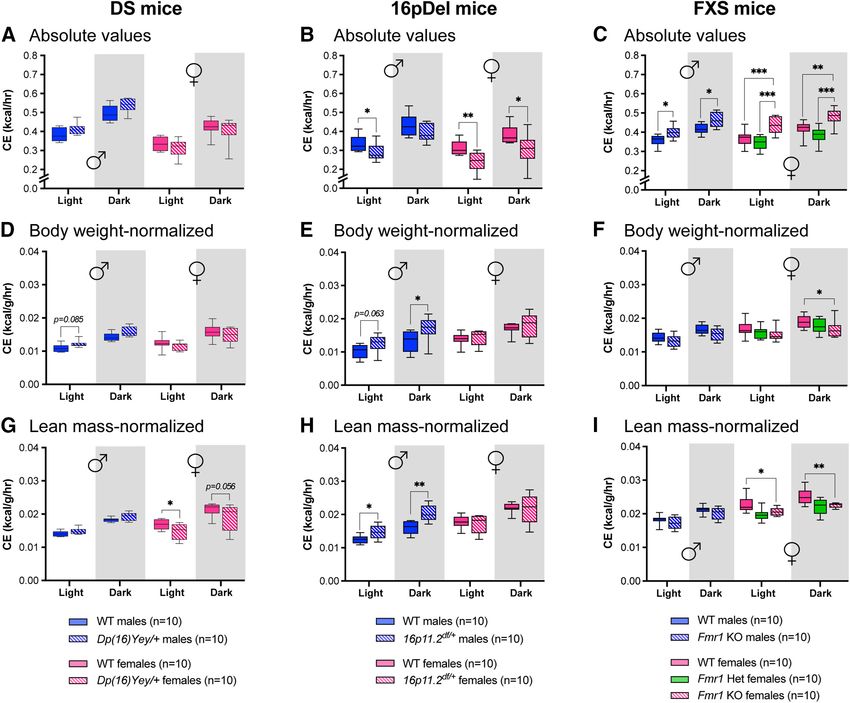
Research Article: New Research      4 of 14

al., 2017; Mtaweh et al., 2018). Moreover, it is suggested        10 l/min; sheath gas temperature 300°C (–ESI) and 225°C
that RER is calculated from absolute values of O2 and CO2 ex-     (1ESI); sheath gas flow 12 l/min; nebulizer pressure 40
changes (Arch et al., 2006; Tschöp et al., 2011). Normalization   psig, capillary voltage 3000 V, nozzle voltage 0 V and frag-
of CE to lean mass facilitates comparison between groups of       mentor voltage of 125 V. MS data were collected for m/z
different body composition (Mtaweh, et al., 2018).                range of 60–1050 at the acquisition rate of two spectra/s
                                                                  in the extended dynamic range mode (2 GHz).
Targeted plasma metabolome profiling                                  Metabolite identification and analysis. Metabolite iden-
   Plasma levels of selected metabolites were quantified          tification was confirmed by exact mass, retention time
by liquid chromatography mass spectrometry (LC-MS).               and subsequent MS/MS fragmentation of metabolite
Sample temperature was maintained on ice or dry ice               standards and quality control samples. These identifica-
where possible, and all solvents were MS grade and pre-           tions correspond to Metabolomics Standards Initiative
equilibrated to 20°C.                                             identification level 1 (Sumner et al., 2007). A targeted list
    Metabolite extraction. Mouse saphenous vein blood             of metabolites was quantified (relative quantification) by
(200 ml) was collected in prechilled EDTA tubes, and cen-         external standard calibration curves with Mass Hunter
trifuged for 10 min at 4500 rpm at 4°C. Metabolites from          Quant (Agilent).
50 ml of the resulting plasma were extracted with 600 ml of
a 1:1:1 mixture of methanol:acetonitrile:water. Samples           Statistics
were vortexed and 600 ml of dichloromethane plus an ad-              No statistical methods were used to predetermine sam-
ditional 300-ml water were added for liquid-liquid extrac-        ple size. Sample size (n = 10 per sex/genotype) was simi-
tion. Samples were vortexed, incubated on ice for 10 min          lar to previous reports (Horev et al., 2011; Portmann et al.,
and then centrifuged for 10 min at 4000 rpm at 4°C. The           2014; Arbogast et al., 2016). Researchers were blind to
resulting upper phase, consisting of polar metabolites,           genotype throughout data collection and analysis. In
was separated into two fractions (for 1ESI and –ESI injec-        whisker box plots, boxes represent interquartile range
tions), dried with a refrigerated ( 4°C) centrivap concen-        (IQR), the median value is represented by a line through
trator (Labconco) and stored at 80°C before LC-MS                 the box, and whiskers represent maximum and minimum
analyses.                                                         values. In linear graphs, the line represents the mean and
    LC-MS metabolite quantification. Samples were resus-          shadow represents SEM. Group differences were ana-
pended with 75% acetonitrile, cleared by centrifugation           lyzed by two-way ANOVA and a Sidak’s multiple compari-
and run on an Agilent 6545B Q-TOF mass spectrometer               sons post hoc test. Statistical significance, depicted by
equipped with a 1290 Infinity II ultra-high performance LC        asterisks in plots, was considered when p , 0.05. All sta-
(Agilent Technologies). Continuous internal mass calibra-         tistical tests were performed using GraphPad Prism 9.0
tion was executed using signals from purine [12,000 full          Software.
width at half maximum (FWHM) resolution] and hexakis
(1H, 1H, 3H-tetrafluoropropoxy) phosphazine (24,000
FWHM resolution). All study samples were randomized
                                                                  Results
before analysis and run using both high and low pH hy-            Body composition of DS, 16pDel, and FXS mice
drophilic interaction chromatography (HILIC-Z) in nega-           measured by EchoMRI
tive and positive ionization polarities, respectively. HILIC         In humans, DS, 16pDel, and FXS are all associated with
separation was obtained using the Poroshell 120 HILIC-Z           alterations in body composition, including altered adipose
column (2.1  100 mm, 2.7 mm; Agilent) and correspond-            tissue content and body size (Vis et al;, 2009; Horev et al.,
ing guard column. For negative ion mode chromatogra-              2011; McLennan et al., 2011; Real de Asua et al., 2014;
phy, mobile phase A consisted of water and mobile phase           Gimeno-Ferrer et al., 2018). We first sought to examine
B acetonitrile/water (85/15, v/v), both with 10 mM ammo-          body composition of the corresponding mouse models
nium acetate and 5 mM medronic acid following the gradi-          using EchoMRI to acquire quantitative measures of
ent: 0–2 min 96% B; 2–12 min linear gradient to 60% B;            weight, lean mass and fat mass. No significant difference
12–15 min linear gradient to 60% B, 15–16 min back to ini-        in weight, lean or fat mass was measured between Dp(16)
tial conditions and re-equilibrated in 96% B for 8 min. For       Yey/1 mice and their WT littermates (Fig. 1A), but a main
positive ion mode chromatography, mobile phase A con-             effect of sex was detected for body weight (F(1,18) = 63.09;
sisted of water and mobile phase B acetonitrile/water (90/        p , 0.0001) and lean mass (F(1,18) = 271.6; p , 0.0001).
10, v/v), both with 10 mM ammonium formate and 0.1%               We found that 16p11.2df/1 mice weighed significantly less
formic acid following the gradient: 0–1 min 98% B; 1–             and had significantly lower proportions of lean mass com-
1.5 min linear gradient 90% B, 1.5–5 min linear gradient          pared with their WT littermates (Fig. 1B). The Fmr1 /
80% B, 5–8 min linear gradient 60% B, 8–10.7 linear gra-          mice, however, weighed more and had higher lean and fat
dient 5% B, 10.7–12 min 98% B, 12–12.7 min linear gradi-          mass content when compared with their WT counterparts
ent to initial conditions and re-equilibrated for 3.6 min.        (Fig. 1C). As the mutation in Fmr1 underlying FXS is X-
Autosampler and column temperature were maintained at             linked, females may be either homozygous or heterozy-
4°C and 30°C, respectively. Samples were analyzed using           gous for the mutation (Linden et al., 1999). We therefore
0.25 ml/min flow rate with an injection volume of 2 ml. MS        included heterozygous Fmr11/ females in our study.
detection settings were as follows: N2 drying gas temper-         There was no difference in weight, lean or fat mass be-
ature 200°C (–ESI) and 200°C (1ESI); N2 drying gas flow           tween female Fmr11/ and WT mice (Fig. 1C). These

March/April 2021, 8(2) ENEURO.0292-20.2021                                                                              eNeuro.org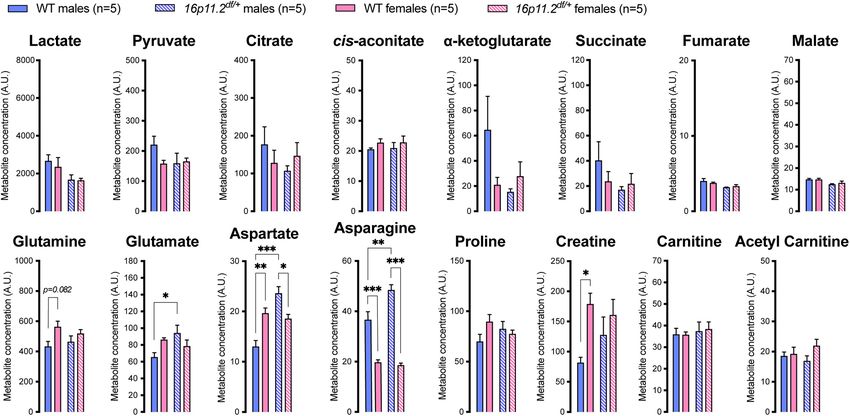
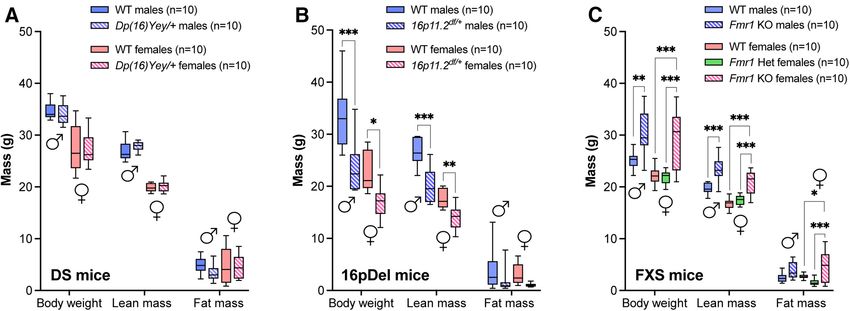
Research Article: New Research 5 of 14
Figure 1. Analysis of body weight, lean mass, and fat mass in DS, 16pDel, and FXS mice by EchoMRI. A, Weight, lean mass, and
fat mass (g) of WT and Dp(16)Yey/1 male and female mice. B, Weight, lean mass, and fat mass (g) of WT and 16p11.2df/1 male and
female mice. C, Weight, lean mass, and fat mass (g) of WT and Fmr1 KO (homo/heterozygous) male and female mice. WT, wild
type; DS, Down syndrome; 16pDel, 16p11.2 deletion syndrome; FXS, fragile X syndrome. All data are whisker boxes (min to max,
center line indicating median; n = 10 animals per group). Asterisks depict significant differences between groups; *p , 0.05,
**p , 0.01, ***p , 0.001 (two-way ANOVA and Sidak’s post hoc test). #: males; $: females.
results demonstrate that genetic variations associated these data suggest that differences identified in our study
with DS, 16pDel, and FXS in mice affect body weight, lean are not because of feeding behaviors and are minimally
mass, and fat mass in a distinct manner. influenced by activity levels. We thus hypothesized that
metabolic differences observed hereafter result from
changes in basal energy metabolism.
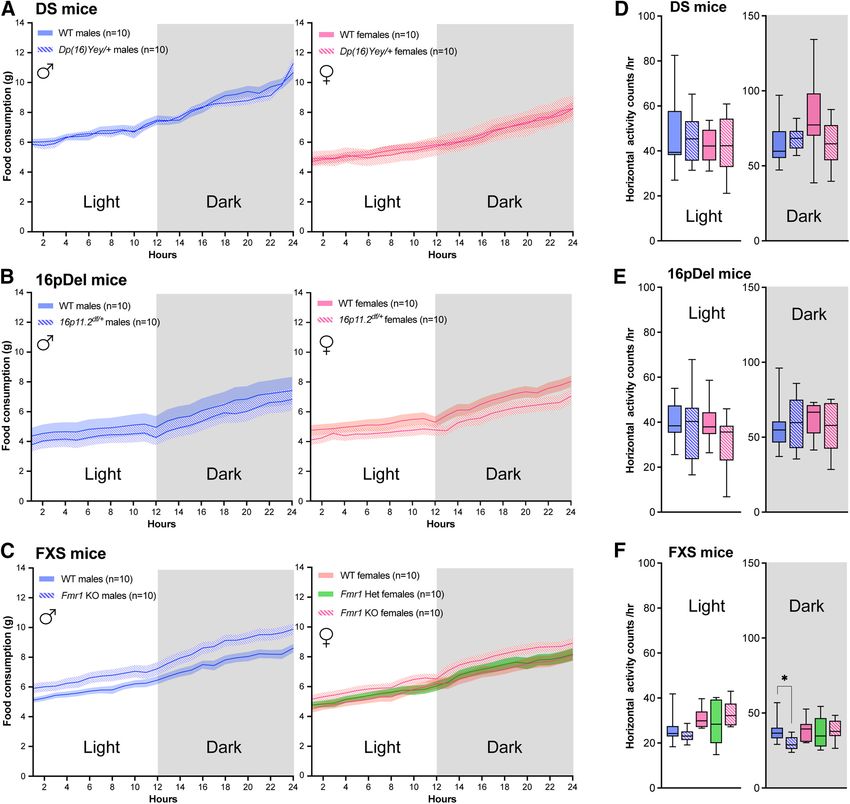
Basal metabolism indices measured by CLAMS in DS, When collecting and analyzing CLAMS data on VO2, we
16pDel, and FXS mice found that Dp(16)Yey/1 males consumed more O2 than fe-
Physiologic measures for each mouse model were then males and WT males at night (Fig. 3A). No difference was de-
collected over a 48-h period (i.e., two day/night cycles) by tected among body weight-normalized values (Fig. 3D);
housing mice in the CLAMS. Data were averaged over a however, when normalized to lean mass, Dp(16)Yey/1 fe-
24-h cycle. CLAMS cages allow for a tight control of envi- males appeared to consume less O2 during the day com-
ronmental factors, such as temperature, that could con- pared with sex-matched WT littermates (Fig. 3G).
found metabolic calculations. Body composition data 16p11.2df/1 mice consumed less O2 than their WT
obtained from the EchoMRI (body weight or lean mass) counterparts, a difference more pronounced in females
were used to normalize CLAMS-generated metabolic (Fig. 3B). Interestingly, when normalized to body weight or
data (see Materials and Methods). lean mass, a male-specific increase in O2 consumption
Body composition and metabolic variables are highly was observed among 16p11.2df/1 mice (Fig. 3E,H).
influenced by food intake and engagement in physical ac- Conversely, Fmr1 / mice consumed more O2 than their
tivity (qualitatively and quantitatively; Vis et al;, 2009; sex-matched WT littermates (Fig. 3C). When normalized
Mazurek and Wyka, 2015; Bertapelli et al., 2016; Peretti et to body weight or lean mass, Fmr1 / females appeared
al., 2019). To account for the influence of food intake on to consume less O2 than their WT counterparts (Fig. 3F,I).
body composition and subsequent metabolic indices, all Similar VO2 was found between Fmr11/ and WT females
mice were fed the same chow diet and the cumulative (Fig. 3C,F,I). These results demonstrate that rates of O2
amount of food consumed by each animal was measured consumption are inconsistent between the DS, 16pDel,
over the duration of the experiment. No significant differ- and FXS mouse models, and that these phenotypes are
ence in food consumption was found in all three mouse sex specific.
models (Fig. 2A–C). Physical activity (i.e., number of hori- The CLAMS also measure fluctuations in CO2 produc-
zontal laser beam breaks) of each animal was also re- tion (VCO2), which also reflects changes in resting metab-
corded in CLAMS cages. Activity levels were largely olism (Farinatti et al., 2016; Patel et al., 2020). In absolute
similar between mutant and WT mice from all models (Fig. values for the DS model, females produced overall slightly
2D–F). We only detected a main effect of sex for FXS mice more CO2 than their male counterparts (Fig. 4A). Lean
(day: F(1,18) = 17.48; p , 0.001; night: F(1,18) = 4.835; mass-normalized VCO2 values revealed that Dp(16)Yey/1
p , 0.05) and an interaction between sex and genotype females produced significantly more CO2 than their WT
for DS mice at night (F(1,18) = 5.758; p , 0.05) and a slight, counterparts during the day (Fig. 4G). In absolute values,
albeit significant, difference was found between Fmr1 / 16p11.2df/1 females produced significantly less CO2 than
males and their WT counterparts at night (Fig. 2F). Hence, their WT littermates (Fig. 4B). However, weight-
March/April 2021, 8(2) ENEURO.0292-20.2021 eNeuro.org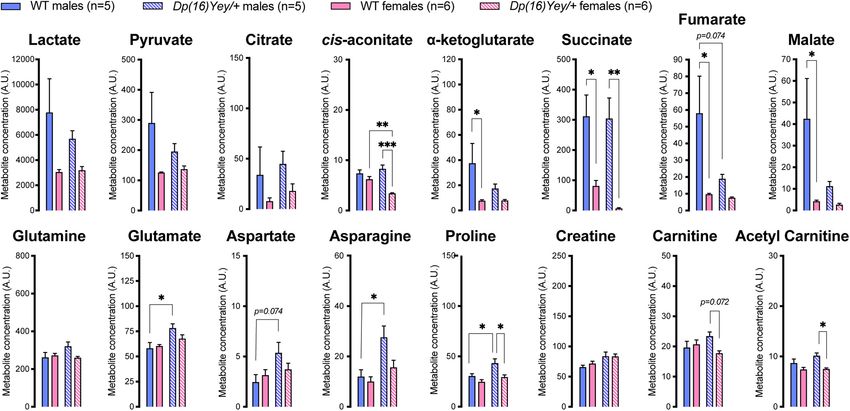
Research Article: New Research      6 of 14

Figure 2. Cumulative food consumption and activity levels of DS, 16pDel, and FXS mice measured in CLAMS. A–C, Average cumu-
lative food consumption in grams shown over a 24-h cycle for WT and Dp(16)Yey/1 male and female mice (A); WT and 16p11.2df/1
male and female mice (B); WT and Fmr1 KO (homo/heterozygous) male and female mice (C). D–F, Activity levels (horizontal beam
breaks) in CLAMS cages for WT and Dp(16)Yey/1 male and female mice (D); WT and 16p11.2df/1 male and female mice (E); WT
and Fmr1 KO (homo/heterozygous) male and female mice (F). The night phase of testing is depicted by gray shaded area. WT, wild
type; DS, Down syndrome; 16pDel, 16p11.2 deletion syndrome; FXS, fragile X syndrome. Data are whisker boxes (min to max, cen-
ter line indicating median) in A–C, or mean 6 SEM in D–F (n = 10 animals per group); *p , 0.05 (two-way ANOVA and Sidak’s post
hoc test). #: males; $: females.

normalized and lean mass-normalized VCO2 values ap-             variations associated with DS, 16pDel, and FXS lead to dis-
peared higher in 16p11.2df/1 males at night compared            tinct rates of CO2 production and that these phenotypes are
with WT littermates (Fig. 4E,H). In absolute values, Fmr1 /     sex specific.
females displayed higher VCO2 compared with their WT               Obtaining VO2 and VCO2 allows for calculation of the
counterparts throughout the 24-h cycle (Fig. 4C). However,      respiratory exchange (RER = VCO2/ VO2), which indicates
normalized VCO2 values revealed that Fmr1 / females have        the preferred metabolic substrate. An RER value near 1 is
significantly reduced CO2 production compared with WT lit-      indicative of predominant usage of carbohydrates as en-
termates (Fig. 4F,I). These data demonstrate that genetic       ergy substrates (Ramos-Jimenez et al., 2008; Farinatti et

March/April 2021, 8(2) ENEURO.0292-20.2021                                                                             eNeuro.org
Research Article: New Research      7 of 14

Figure 3. VO2 by DS, 16pDel, and FXS mice measured in CLAMS. A–C, Absolute values of average VO2 during day (light) and night
(dark) in WT and Dp(16)Yey/1 male and female mice (A); WT and 16p11.2df/1 male and female mice (B); WT and Fmr1 KO (homo/
heterozygous) male and female mice (C). D–F, Average VO2 during day and night normalized to body weight in WT and Dp(16)Yey/1
male and female mice (D); WT and 16p11.2df/1 male and female mice (E); WT and Fmr1 KO (homo/heterozygous) male and female mice
(F). G–I, Average VO2 during day and night normalized to lean mass in WT and Dp(16)Yey/1 male and female mice (G); WT and
16p11.2df/1 male and female mice (H); WT and Fmr1 KO (homo/heterozygous) male and female mice (I). The night phase of testing is de-
picted by gray shaded areas. WT, wild type; DS, Down syndrome; 16pDel, 16p11.2 deletion syndrome; FXS, fragile X syndrome. Data
are whisker boxes (min to max, center line indicating median); n = 10 animals per group. Asterisks depict significant differences between
groups; *p , 0.05, **p , 0.01, ***p , 0.001 (two-way ANOVA and Sidak’s post hoc test); p value is indicated when approaching signifi-
cance. #: males; $: females.

al., 2016; Coffman et al., 2019; Patel et al., 2020). All mice           Finally, the CLAMS monitors heat produced by the animals
housed in the CLAMS for this study displayed an RER of                (in kilocalories per hour) as an indicator of CE. In the DS
;1 and below, consistent with low-to-moderate activity                mouse model, females displayed slightly lower CE compared
(Fig. 5). During their inactive (light) phase, male and female        with males in absolute values (Fig. 6A). Interestingly, Dp(16)
Dp(16)Yey/1 mice displayed a significantly lower RER                  Yey/1 females showed significantly reduced CE compared
than their WT counterparts (Fig. 5A). No significant differ-          with WT females when values were normalized to lean mass
ence in RER was detected between WT and 16p11.2df/1                   (Fig. 6G). In absolute values, 16p11.2df/1 mice displayed re-
mice (Fig. 5B), whereas Fmr1 / females displayed a                    duced CE compared with sex-matched WT littermates (Fig.
lower average RER during the day compared with WT fe-                 6B). However, when normalized to body weight or lean mass,
males (Fig. 5C). These data reveal distinct sex-specific ef-          16p11.2df/1 males displayed increased CE (Fig. 6E,H).
fects of genetic variations on basal energy metabolism in             Fmr1 / mice displayed significantly higher absolute CE
the DS, 16pDel, and FXS mouse models.                                 compared with WT littermates, a phenotype again more

March/April 2021, 8(2) ENEURO.0292-20.2021                                                                                     eNeuro.org
Research Article: New Research        8 of 14

Figure 4. VCO2 by DS, 16pDel, and FXS mice measured in CLAMS. A–C, Absolute values of average VCO2 during day (light) and night
(dark) in WT and Dp(16)Yey/1 male and female mice (A); WT and 16p11.2df/1 male and female mice (B); WT and Fmr1 KO (homo/heterozy-
gous) male and female mice (C). D–F, Average VCO2 during day and night normalized to body weight in WT and Dp(16)Yey/1 male and fe-
male mice (D); WT and 16p11.2df/1 male and female mice (E); WT and Fmr1 KO (homo/heterozygous) male and female mice (F). G–I, Average
VCO2 during day and night normalized to lean mass in WT and Dp(16)Yey/1 male and female mice (G); WT and 16p11.2df/1 male and female
mice (H); WT and Fmr1 KO (homo/heterozygous) male and female mice (I). The night phase of testing is depicted by gray shaded areas. WT,
wild type; DS, Down syndrome; 16pDel, 16p11.2 deletion syndrome; FXS, fragile X syndrome. Data are whisker boxes (min to max, center line
indicating median); n = 10 animals per group. Asterisks depict significant differences between groups; *p , 0.05, **p , 0.01, ***p , 0.001 (two-
way ANOVA and Sidak’s post hoc test); p value is indicated when approaching significance. #: males; $: females.

pronounced in females (Fig. 6C). However, when normalized                 (Gross et al., 2019; Orozco et al., 2019), we next sought to
to body weight or lean mass, Fmr1 / females displayed sig-                identify differences in circulating metabolites related to
nificantly reduced CE (Fig. 6F,I). These results demonstrate              mitochondrial function in all three mouse models. Using
that the DS, 16pDel, and FXS mouse models display distinct,               targeted metabolomics by LC-MS, we measured the lev-
sex-specific levels of CE.                                                els of key plasma metabolites related to the tricarboxylic
                                                                          acid (TCA) cycle in three independent batches (DS,
                                                                          16pDel, and FXS mice; Figs. 7-9). These metabolites in-
Plasma metabolites measured by LC-MS in DS,                               clude intermediates of the TCA cycle (e.g., citrate,
16pDel, and FXS mice                                                      cis-aconitate and a-ketoglutarate) as well as anaplerotic
  Since the above-mentioned findings suggested sex-                       metabolites that replenish the TCA cycle intermediates
specific alterations in basal energy metabolism, and as re-               (e.g., pyruvate, aspartate, glutamate). Blood plasma was
cent studies have linked NDD to alterations in plasma me-                 collected in the fed state to match CLAMS analyses that
tabolites related to one-carbon and energy metabolism                     were performed with free access to food and water.

March/April 2021, 8(2) ENEURO.0292-20.2021                                                                                          eNeuro.org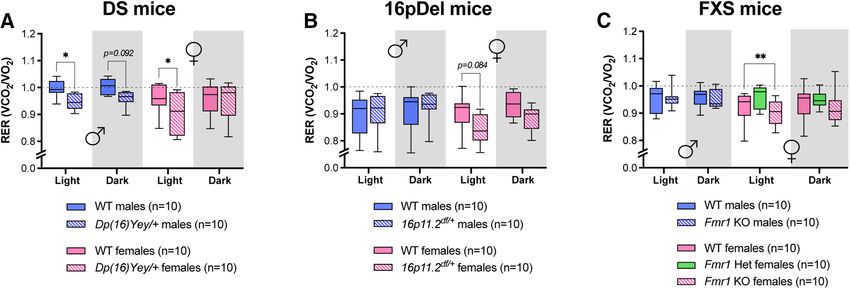
Research Article: New Research 9 of 14
Figure 5. RER from DS, 16pDel, and FXS mice. A–C, RER calculated from absolute values during day (light) and night (dark) in WT
and Dp(16)Yey/1 male and female mice (A); WT and 16p11.2df/1 male and female mice (B); WT and Fmr1 KO (homo/heterozygous)
male and female mice (C). The night phase of testing is depicted by gray shaded areas. The dotted line depicts a RER of 1. WT,
wild type; DS, Down syndrome; 16pDel, 16p11.2 deletion syndrome; FXS, fragile X syndrome. Data are whisker boxes (min to max,
center line indicating median); n = 10 animals per group. Asterisks depict significant differences between groups; *p , 0.05,
**p , 0.01 (two-way ANOVA and Sidak’s post hoc test); p value is indicated when approaching significance. #: males; $: females.
When compared with their respective sex-matched WT hyperactive (Horev et al., 2011; Ouellette et al., 2020),
littermates, Dp(16)Yey/1 females displayed significantly and the majority of 16p11.2 deletion human carriers
lower levels of cis-aconitate, while Dp(16)Yey/1 males ex- display hyperactivity (Miller et al., 2009). However, the
hibited higher concentration of glutamate, asparagine and limited space offered by CLAMS cages serves to con-
proline (Fig. 7). Compared with Dp(16)Yey/1 females, Dp trol for metabolic measures, enabling accurate assess-
(16)Yey/1 males displayed higher levels of cis-aconitate, ment of basal metabolism independent of activity. Of
succinate, proline, and acetyl carnitine (Fig. 7). note, whereas hyperactivity is a common feature
When compared with their WT counterparts, 16p11.2df/1 among individuals with NDDs, they are, however, less
females did not show any change, while 16p11.2df/1 males likely to engage in physical activity (Vis et al., 2009;
displayed significantly higher plasma concentrations of gluta- Mendonca et al., 2010; Mazurek and Wyka, 2015),
mate, aspartate and asparagine (Fig. 8). 16p11.2df/1 males partly because of a lack of social skills necessary to
also displayed higher levels of aspartate and asparagine participate in group-based physical activities (Foerste
compared with 16p11.2df/1 females (Fig. 8). et al., 2016).
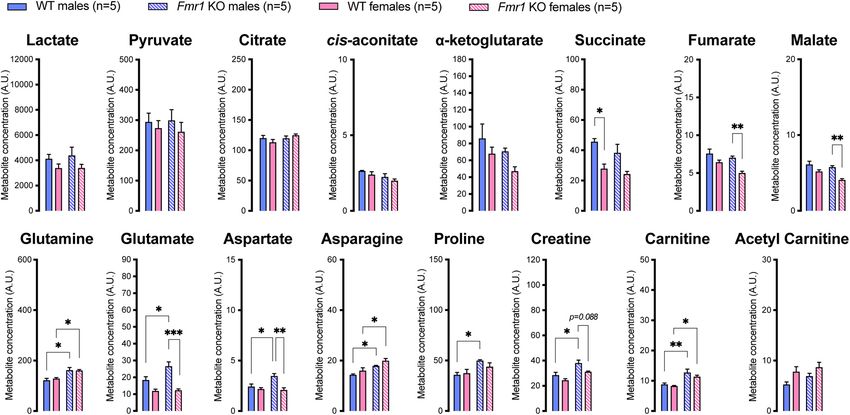
Finally, compared with their respective sex-matched Results obtained from the DS mouse model suggest
WT littermates both Fmr1 / males and females dis- that differences in metabolism arise from the DS genotype
played significantly elevated levels of glutamine, aspara- independent of important factors that influence metabo-
gine and carnitine (Fig. 9). Fmr1 KO males also displayed lism, including activity levels and food intake. Pronounced
a significant increase in glutamate, aspartate, proline, and differences were found between mutant (Dp(16)Yey/1)
carnitine compared with their WT counterparts. Fmr1 / males and females, bolstering the importance of sex dif-
females showed significantly lower levels of fumarate, ferences in DS research. Sex differences in human DS in-
malate, glutamate, and aspartate than Fmr1 / males clude higher disease penetrance among males and high
rates of congenital heart defects and increased abdomi-
(Fig. 9).
nal adiposity in females (Sobey et al., 2015; Flygare
Wallén et al., 2018). Our results also suggest that DS phe-
Discussion notypes are more severe in male mice. The fact that Dp
Together, our study provides the first systematic char- (16)Yey/1 mice modeling DS do not display differences in
acterization of basal metabolism in mouse models of DS, weight and lean mass in our study also highlights an im-
16pDel, and FXS, revealing that these models display dis- portant discrepancy with the human syndrome. This
tinct, sex-specific basal metabolic signatures with mini- could reflect the particular DS mouse model used, since
mal influence of physical activity and independent of the Dp(16)Yey/1 mice only possess trisomy of ;66% of
number of calories consumed. Hsa21 gene orthologues (Li et al., 2007; Roubertoux and
Activity data obtained in our study do not necessarily Carlier, 2010; Yu, 2010; Herault et al., 2017). The other
reflect the hyperactivity phenotypes commonly found Hsa21 gene orthologues for the mouse are present on
among human or rodent NDDs, a discrepancy most likely Mmu 10 and 17. Although Hsa21 is syntenic with portions
because of our experimental setup. Indeed, the CLAMS of three mouse chromosomes, trisomy of those genes
consists of relatively small individual cages, limiting ani- present on Mmu 16 (113 genes) is generally considered a
mal mobility. For instance, in a normal home cage envi- reliable model of human DS cognitive, physical and be-
ronment, male and female 16p11.2df/1 mice are havioral phenotypes. The lack of differences in weight
March/April 2021, 8(2) ENEURO.0292-20.2021 eNeuro.orgResearch Article: New Research 10 of 14 Figure 6. CE by DS, 16pDel, and FXS mice measured in CLAMS. A–C, Absolute values of average CE during day (light) and night (dark) in WT and Dp(16)Yey/1 male and female mice (A); WT and 16p11.2df/1 male and female mice (B); and WT and Fmr1 KO (homo/heterozygous) male and female mice (C). D–F, Average CE during day and night normalized to body weight in WT and Dp(16) Yey/1 male and female mice (D); WT and 16p11.2df/1 male and female mice (E); and WT and Fmr1 KO (homo/heterozygous) male and female mice (F). G–I, Average CE during day and night normalized to lean mass in WT and Dp(16)Yey/1 male and female mice (G); WT and 16p11.2df/1 male and female mice (H); and WT and Fmr1 KO (homo/heterozygous) male and female mice (I). The night phase of testing is depicted by gray shaded areas. WT, wild type; DS, Down syndrome; 16pDel, 16p11.2 deletion syndrome; FXS, fragile X syndrome. Data are whisker boxes (min to max, center line indicating median); n = 10 animals per group. Asterisks depict significant differences between groups; *p , 0.05, **p , 0.01, ***p , 0.001 (two-way ANOVA and Sidak’s post hoc test). #: males; $: females. and lean mass in the Dp(16)Yey/1 mice could suggest Although 16p11.2df/1 mice accurately embody numerous that the genes linked to human DS-associated obesity are phenotypes reminiscent of the human syndrome, inter- present in regions of synteny on Mmu17 or Mmu10. pretation of metabolic data must be made in light of the However, body proportions of a DS mouse model harbor- opposite body proportions often observed between mu- ing trisomy of all Hsa21 syntenic regions found small but tant mice and human carriers (Horev et al., 2011; significant reductions in body length and weight (Yu, Portmann et al., 2014; Arbogast et al., 2016). Indeed, 2010), again in discordance with human DS body propor- human 16pDel is associated with obesity, whereas tions (Vis et al., 2009; Shields et al., 2017). 16p11.2df/1 mice display a propensity for leanness (Horev The 16p11.2df/1 mutation also had an influence on me- et al., 2011; Portmann et al., 2014; Arbogast et al., 2016), tabolism, yet distinct from the other NDD models used in particularly in females as confirmed by our study. this study. Results in 16p11.2df/1 mice were also inde- Finally, Fmr1 / mice also displayed a metabolic phe- pendent of activity levels and food consumption. notype distinct from the DS and 16pDel mouse models. March/April 2021, 8(2) ENEURO.0292-20.2021 eNeuro.org
Research Article: New Research     11 of 14

Figure 7. Plasma metabolite levels in DS mice measured by LC-MS. WT, wild type. Data are mean 6 SEM; n = 5–6 animals per
group. Asterisks depict significant differences between groups; *p , 0.05, **p , 0.01, ***p , 0.001 (two-way ANOVA and Tukey’s
post hoc test).

The Fmr1 mutation was associated with an increase in            1997; Linden et al., 1999; McLennan et al., 2011;
body weight and altered all physiological indices exam-         Bartholomay et al., 2019).
ined in this study. Interestingly, heterozygous Fmr11/ fe-        Remarkably, the 16pDel and FXS mouse models dis-
male mice displayed similar metabolic signatures as WT          played largely contrasting phenotypes. The 16pDel and
(Fmr11/1) females and males, as expected from compen-           FXS mouse models also exhibited larger changes in meta-
sation by the remaining WT allele (Hoogeveen and Oostra,        bolic phenotypes among females compared with males.

Figure 8. Plasma metabolite levels in 16pDel mice measured by LC-MS. WT, wild type. Data are mean 6 SEM; n = 5 animals per
group. Asterisks depict significant differences between groups; *p , 0.05, **p , 0.01, ***p , 0.001 (two-way ANOVA and Tukey’s
post hoc test).

March/April 2021, 8(2) ENEURO.0292-20.2021                                                                            eNeuro.org
Research Article: New Research     12 of 14

Figure 9. Plasma metabolite levels in FXS mice measured by LC-MS. WT, wild type. Data are mean 6 SEM; n = 5 animals per
group. Asterisks depict significant differences between groups; *p , 0.05, **p , 0.01, ***p , 0.001 (two-way ANOVA and Tukey’s
post hoc test).

Both the DS and 16pDel mouse models demonstrated                plasma anaplerotic amino acids could result from in-
metabolic difference among males and females, regard-           creased muscular proteolysis, decreased glucogenesis
less of genotype. This could be an effect of the back-          and/or decreased oxidation and anaplerotic influx in the
ground strain of these mouse models, which used a               TCA cycle (Chang and Goldberg, 1978; Owen et al.,
mixed B6/129 background, whereas the FXS mouse                  2002). Interestingly, altered plasma levels of glutamate,
model used a mixed FVB/129 background.                          aspartate and asparagine have been associated with pre-
   In line with sex-specific and model-specific alterations     diabetes (Owei et al., 2019) as well as coronary heart dis-
in body composition and metabolic phenotypes, our me-           ease and type 2 diabetes in human subjects (Ottosson et
tabolomic data suggest significant changes in mitochon-         al., 2018). Although it is premature to speculate based on
drial metabolism. First, many changes were observed for         plasma metabolite levels, which metabolic pathway(s) are
TCA intermediates downstream of citrate (e.g., cis-aconi-       affected and whether or not mitochondrial anaplerotic flux
tate and succinate in DS mice) to suggest that the first        is altered, our findings highlight major sex-specific and
TCA reaction, i.e., condensation of oxaloacetate with ace-      mutation-specific differences in TCA cycle metabolites
tyl-CoA catalyzed by citrate synthase, is not affected. In      and anaplerotic amino acids.
agreement, circulating levels of pyruvate and acetyl carni-        Our findings bring forward the concept of NDD-associ-
tine were mostly similar in males and females whatever          ated metabolic disturbances and support NDD mouse
the mouse model and mutation. Second, some TCA inter-           models as valuable tools to gain novel insight into this
mediates were highly different between male and female          understudied association. Providing novel insight into
WT littermates of the Dp(16)Yey/1 strain (e.g., succinate,      NDD-associated metabolic alterations is an essential pre-
fumarate, and malate), while they were unchanged in the         requisite for future preclinical and clinical investigations.
plasma of the other WT strains. This suggests that inter-       Because of similarities in phenotypic expression, NDDs
strain differences of the genetic backgrounds could con-        are generally treated as homogeneous groups, neglecting
tribute to these observations. Third, important differences     their unique genetic variations. Our results challenge this
were observed in the levels of anaplerotic substrates in        idea by demonstrating the influence of genetics despite
males of each mouse model. The mutations led to in-             similarities in overt expression of symptoms. This sug-
creased levels of anaplerotic amino acids including gluta-      gests that personalized clinical interventions may be re-
mate, aspartate and asparagine in the three mouse               quired to address unique NDD-associated metabolic
models as well as increased proline in Dp(16)Yey/1 and          abnormalities depending on both genetic cause and sex.
Fmr1 / males. Interestingly, this pattern was not related          Insights into basal metabolic function in live animals will
to differences in body weight or lean mass (a main source       provide a basis for future studies aimed at understanding
of amino acids) since each model showed either un-              mechanisms underlying metabolic dysfunction in NDDs,
changed (Fig. 1A), decreased (Fig. 1B), or increased (Fig.      and/or aimed at detecting changes in response to
1C) body weight and lean mass. Increased levels of              intervention.

March/April 2021, 8(2) ENEURO.0292-20.2021                                                                            eNeuro.org
Research Article: New Research         13 of 14

References                                                                Hoogeveen A, Oostra B (1997) The fragile X syndrome. J Inherit
                                                                             Metab Dis 20:139–151.
Arch J, Hislop D, Wang S, Speakman J (2006) Some mathematical             Horev G, Ellegood J, Lerch J, Son Y, Muthuswamy L, Vogel H,
  and technical issues in the measurement and interpretation of              Krieger A, Buja A, Henkelman M, Wigler M, Mills A (2011) Dosage-
  open-circuit indirect calorimetry in small animals. Int J Obes (Lond)      dependent phenotypes in models of 16p11.2 lesions found in au-
  30:1322–1331.                                                              tism. Proc Natl Acad Sci USA 108:17076–17081.
Arbogast T, Ouagazzal A, Chevalier C, Kopanitsa M, Afinowi N,             Kostopoulou E, Dastamani A, Caiulo S, Antell H, Flanagan S, Shah P
  Migliavacca E, Cowling B, Birling M, Champy M, Reymond A,                  (2019) Hyperinsulinaemic hypoglycaemia: a new presentation of
  Herault Y (2016) Reciprocal effects on neurocognitive and meta-            16p11.2 deletion syndrome. Clin Endocrinol (Oxf) 90:766–769.
  bolic phenotypes in mouse models of 16p11.2 deletion and dupli-         Leboucher A, Pisani D, Martinez-Gili L, Chilloux J, Bermudez-Martin
  cation syndromes. PLoS Genet 12:e1005709.                                  P, Van Dijck A, Ganief T, Macek B, Becker J, Le Merrer J, Kooy R,
Bakker C, Vereij C, Willemsen R, van der Helm R, Oerlemans F,                Amri E, Khandjian E, Dumas M, Davidovic L (2019) The translation-
  Vermy M, Bygrave A, Hoogeveen A, Oostra B, Reyniers E, De BK,              al regulator FMRP controls lipid and glucose metabolism in mice
  D’Hooge R, Cras P, van Velzen D, Nagels G, Martin J, De Deyn P,            and humans. Mol Metab 21:22–35.
  Darby J, Willems P (1994) Fmr1 knockout mice: a model to study          Li Z, Yu T, Morishima M, Pao A, LaDuca J, Conroy J, Nowak N,
  fragile X mental retardation. The Dutch-Belgian fragile X consor-          Matsui S, Shiraishi I, Yu Y (2007) Duplication of the entire 22.9 Mb
  tium. Cell 78:23–33.                                                       human chromosome 21 syntenic region on mouse chromosome
Bartholomay K, Lee C, Bruno J, Lightbody A, Reiss A (2019) Closing           16 causes cardiovascular and gastrointestinal abnormalities. Hum
  the gender gap in fragile X syndrome: review on females with FXS           Mol Genet 16:1359–1366.
  and preliminary research findings. Brain Sci 9:11.                      Linden M, Tassone F, Gane L, Hills J, Hagerman R, Taylor A (1999)
Bertapelli F, Pitetti K, Agiovlasitis S, Guerra-Junior G (2016)              Compound heterozygous female with fragile X syndrome. Am J
  Overweight and obesity in children and adolescents with Down               Med Genet 83:318–321.
  syndrome-prevalence, determinants, consequences, and inter-             Lovelace J, Ethell I, Binder D, Razak K (2018) Translation-relevant
  ventions: a literature review. Res Dev Disabil 57:181–192.                 EEG phenotypes in a mouse model of fragile X syndrome.
Coffman K, Cheuvront N, Salgado R, Kenefick R (2019) Biological              Neurobiol Dis 115:39–48.
  variation of resting measures of ventilation and gas exchange in a      Mazurek D, Wyka J (2015) Down syndrome. Genetic and nutritional
  large healthy cohort. Eur J Appl Physiol 119:2033–2040.                    aspects of accompanying disorders. Rocz Panstw Zakl Hig
Chang TW, Goldberg AL (1978) The metabolic fates of amino acids              66:189–194.
  and the formation of glutamine in skeletal muscle. J Biol Chem          McLennan Y, Polussa J, Tassone F, Hagerman R (2011) Fragile x
  253:3685–3693.                                                             syndrome. Curr Genomics 12:216–224.
Crabbe LS, Bensky AS, Hornstein L, Schwartz DC (1993)                     Mendonca G, Pereira F, Fernhall B (2010) Reduced exercise capacity
  Cardiovascular abnormalities in children with fragile X syndrome.          in persons with down syndrome: cause, effect, and management.
  Pediatrics 91:714–715.                                                     Ther Clin Risk Manag 6:601–610.
Croen L, Zerbo O, Qian Y, Massolo M, Rich S, Sidney S, Kripke C           Miller DT, Chung W, Nasir R, Shen Y, Steinman K, Wi B, Hanson E
  (2015) The health status of adults on the autism spectrum. Autism          (2009) 16p11.2 recurrent microdeletion [Updated 2015 Dec 10]. In:
  19:814–823.                                                                GeneReviews (Adam MP, Ardinger HH, Pagon RA, eds), pp 1993–
Dahlhaus R (2018) Of men and mice: modeling the fragile X syn-               2020. Seattle: University of Washington, Seattle.
  drome. Front Mol Neurosci 11:41.                                        Mtaweh H, Tuira L, Floh AA, Parshuram CS (2018) Indirect calorime-
Farinatti P, Castinheiras Neto A, Amorim P (2016) Oxygen consump-            try: history, technology, and application. Front Pediatr 6:257.
  tion and substrate utilization during and after resistance exercises    Orozco JS, Hertz-Picciotto I, Abbeduto L, Slupsky CM (2019)
  performed with different muscle mass. Int J Exerc Sci 9:77–88.             Metabolomics analysis of children with autism, idiopathic-devel-
Flygare Wallén E, Ljunggren G, Carlsson AC, Pettersson D, Wändell            opmental delays, and Down syndrome. Transl Psychiatry 9:243.
  P (2018) High prevalence of diabetes mellitus, hypertension and         Ottosson F, Smith E, Melander O, Fernandez C (2018) Altered aspar-
  obesity among persons with a recorded diagnosis of intellectual            agine and glutamate homeostasis precede coronary artery disease
  disability or autism spectrum disorder. J Intellect Disabil Res            and type 2 diabetes. J Clin Endocrinol Metab 103:3060–3069.
  62:269–280.                                                             Ouellette J, Toussay X, Comin CH, Costa LDF, Ho M, Lacalle-
Foerste T, Sabin M, Reid S, Reddihough D (2016) Understanding the            Aurioles M, Freitas-Andrade M, Liu QY, Leclerc S, Pan Y, Liu Z,
  causes of obesity in children with trisomy 21: hyperphagia vs              Thibodeau JF, Yin M, Carrier M, Morse CJ, Dyken PV, Bergin CJ,
  physical inactivity. J Intellect Disabil Res 60:856–864.                   Baillet S, Kennedy CR, Tremblay MÈ, et al. (2020) Vascular contri-
Gimeno-Ferrer F, Albuquerque D, Guzmán Luján C, Marcaida Benito              butions to 16p11.2 deletion autism syndrome modeled in mice.
  G, Torreira Banzas C, Repáraz-Andrade A, Ballesteros Cogollos V,           Nat Neurosci 23:1090–1101.
  Aleu Pérez-Gramunt M, Galán Gómez E, Quintela I, Rodríguez-             Owei I, Umekwe N, Stentz F, Wan J, Dagogo-Jack S (2019) Amino
  López R (2019) The effect of copy number variations in chromo-             acid signature predictive of incident prediabetes: a case-control
  some 16p on body weight in patients with intellectual disability. J        study nested within the longitudinal pathobiology of prediabetes in
  Hum Genet 64:221–231.                                                      a biracial cohort. Metabolism 98:76–83.
Gross TJ, Doran E, Cheema AK, Head E, Lott IT, Mapstone M (2019)          Owen OE, Kalhan SC, Hanson RW (2002) The key role of anaplerosis
  Plasma metabolites related to cellular energy metabolism are al-           and cataplerosis for citric acid cycle function. J Biol Chem
  tered in adults with Down syndrome and Alzheimer’s disease.                277:30409–30412.
  Develop Neurobiol 79:622–638.                                           Patel H, Menouar MA, Bhardwaj A (2020) Physiology, respiratory
Gupta R, Ramachandran R, Venkatesan P, Anoop S, Joseph M,                    quotient [Updated 2020 Apr 29]. In: StatPearls. Treasure Island:
  Thomas N (2017) Indirect Calorimetry: From Bench to Bedside.               StatPearls Publishing. Available from: https://www.ncbi.nlm.nih.
  Indian J Endocrinol Metab 21:594–599.                                      gov/books/NBK531494/.
Hanson E, Nasir R, Fong A, Lian A, Hundley R, Shen Y, Wu B, Holm I,       Peretti S, Mariano M, Mazzocchetti C, Mazza M, Pino MC, Verrotti Di
  Miller D; 16p11.2 Study Group Clinicians (2010) Cognitive and be-          Pianella A, Valenti M (2019) Diet: the keystone of autism spectrum
  havioral characterization of 16p11.2 deletion syndrome. J Dev              disorder? Nutr Neurosci 22:825–839.
  Behav Pediatr 31:649–657.                                               Portmann T, Yang M, Mao R, Panagiotakos G, Ellegood J, Dolen G,
Herault Y, Delabar J, Fisher E, Tybulewicz V, Yu E, Brault V (2017)          Bader PL, Grueter BA, Goold C, Fisher E, Clifford K, Rengarajan P,
  Rodent models in Down syndrome research: impact and future op-             Kalikhman D, Loureiro D, Saw NL, Zhengqui Z, Miller MA, Lerch
  portunities. Dis Model Mech 10:1165–1186.                                  JP, Henkelman M, Shamloo M, et al. (2014) Behavioral

March/April 2021, 8(2) ENEURO.0292-20.2021                                                                                           eNeuro.org
Research Article: New Research 14 of 14
abnormalities and circuit defects in the basal ganglia of a mouse Tschöp MH, Speakman JR, Arch JR, Auwerx J, Brüning JC, Chan L,
model of 16p11.2 deletion syndrome. Cell Rep 7:1077–1092. Eckel RH, Farese RV Jr, Galgani JE, Hambly C, Herman MA,
Ramos-Jimenez A, Hernandez-Torres R, Torres-Duran P, Romero- Horvath TL, Kahn BB, Kozma SC, Maratos-Flier E, Müller TD,
Gonzalez J, Mascher D, Posadas-Romero C, Juarez-Oropeza M Münzberg H, Pfluger PT, Plum L, Reitman ML, Rahmouni K,
(2008) The respiratory exchange ratio is associated with fitness in- Shulman GI, Thomas G, Kahn CR, Ravussin E (2011) A guide to
dicators both in trained and untrained men: a possible application analysis of mouse energy metabolism. Nat Methods 9:57–63.
for people with reduced exercise tolerance. Clin Med Circ Respirat Van Eersel G, Bouwmeester S, Polak M, Verkoeijen P (2017) The mis-
Pulm Med 2:1–9. use of ANCOVA in neuroimaging studies https://doi.org/10.31234/
Real de Asua D, Parra P, Costa R, Moldenhauer F, Suarez C (2014) osf.io/qcsbz.
Evaluation of the impact of abdominal obesity on glucose and lipid Vianello E, Dogliotti G, Dozio E, Corsi Romanelli M (2013) Low heart-
metabolism disorders in adults with Down syndrome. Res Dev type fatty acid binding protein level during aging may protect
Disabil 35:2942–2949. Down syndrome people against atherosclerosis. Immun Ageing
10:2.
Roubertoux P, Carlier M (2010) Mouse models of cognitive disabil-
Vis J, Duffels M, Winter M, Weijerman M, Cobben J, Huisman S,
ities in trisomy 21 (Down Ssyndrome). Am J Med Genet C Semin
Mulder B (2009) Down syndrome: a cardiovascular perspective. J
Med Genet 154C:400–416.
Intellect Disabil Res 53:419–425.
Shields N, Hussey J, Murphy J, Gormley J, Hoey H (2017) An explor-
Watson LP, Raymond-Barker P, Moran C, Schoenmakers N, Mitchell
atory study of the association between physical activity, cardio- C, Bluck L, Chatterjee VK, Savage DB, Murgatroyd PR (2014) An
vascular fitness and body size in children with Down syndrome. approach to quantifying abnormalities in energy expenditure and
Dev Neurorehabil 20:92–98. lean mass in metabolic disease. Eur J Clin Nutr 68:234–240.
Sobey C, Judkins C, Sundararajan V, Phan T, Drummond G, Srikanth Yang M, Mahrt E, Lewis F, Foley G, Portmann T, Dolmetsch R,
V (2015) Risk of major cardiovascular events in people with Down Portfors C, Crawley J (2015) 16p11.2 deletion syndrome mice dis-
syndrome. PLoS One 10:e0137093. play sensory and ultrasonic vocalization deficits during social in-
Sumner LW, Amberg A, Barrett D, Beale MH, Beger R, Daykin CA, teractions. Autism Res 8:507–521.
Fan TW, Fiehn O, Goodacre R, Griffin JL, Hankemeier T, Hardy N, Yu T, Li Z, Jia Z, Clapcote SJ, Liu C, Li S, Asrar S, Pao A, Chen R,
Harnly J, Higashi R, Kopka J, Lane AN, Lindon JC, Marriott P, Fan N, Carattini-Rivera S, Bechard AR, Spring S, Henkelman RM,
Nicholls AW, Reily MD, et al. (2007) Proposed minimum reporting Stoica G, Matsui SI, Nowak NJ, Roder JC, Chen C, Bradley A, et
standards for chemical analysis Chemical Analysis Working Group al. (2010) A mouse model of Down syndrome trisomic for all
(CAWG) Metabolomics Standards Initiative (MSI). Metabolomics human chromosome 21 syntenic regions. Hum Mol Genet
3:211–221. 19:2780–2791.
March/April 2021, 8(2) ENEURO.0292-20.2021 eNeuro.orgYou can also read