Relative Adipose Tissue Failure in Alström Syndrome Drives Obesity-Induced Insulin Resistance
←
→
Page content transcription
If your browser does not render page correctly, please read the page content below
364                                                                                                                      Diabetes Volume 70, February 2021

             Relative Adipose Tissue Failure in Alström Syndrome
             Drives Obesity-Induced Insulin Resistance
             Tarekegn Geberhiwot,1,2 Shanat Baig,1,3 Cathy Obringer,4 Dorothée Girard,5 Charlotte Dawson,1
             Konstantinos Manolopoulos,2 Nadia Messaddeq,6 Pierre Bel Lassen,7 Karine Clement,7
             Jeremy W. Tomlinson,8 Richard P. Steeds,3 Hélène Dollfus,4,9 Nikolai Petrovsky,5,10 and Vincent Marion11
             Diabetes 2021;70:364–376 | https://doi.org/10.2337/db20-0647

             Obesity is a major risk factor for insulin resistance (IR)                          Alström syndrome (ALMS) is an ultra-rare (,1 per mil-
             and its attendant complications. The pathogenic mech-                               lion) autosomal recessive (OMIM identifier 203800) mono-
             anisms linking them remain poorly understood, partly                                genic metabolic syndrome characterized by childhood-onset
             due to a lack of intermediary monogenic human pheno-                                obesity, extreme insulin resistance (IR), early-onset type
             types. Here, we report on a monogenic form of IR-prone                              2 diabetes, accelerated nonalcoholic fatty liver disease,
             obesity, Alström syndrome (ALMS). Twenty-three sub-                                 cardiomyopathy, chronic kidney disease, dyslipidemia,
             jects with monogenic or polygenic obesity underwent                                 and hypertension (1–4). Other hallmarks of ALMS include
             hyperinsulinemic-euglycemic clamping with concomitant                               retinal rod-cone dystrophy and hearing loss (1). ALMS is
METABOLISM

             adipose tissue (AT) microdialysis and an in-depth anal-                             caused by mutations in ALMS1, a gene encoding the
             ysis of subcutaneous AT histology. We have shown
                                                                                                 ubiquitously expressed 461-kDa ALMS1 protein (5). We
             a relative AT failure in a monogenic obese cohort, a
                                                                                                 and others have shown that IR in ALMS resembles an
             finding supported by observations in a novel conditional
                                                                                                 extreme form of the metabolic syndrome seen in other
             mouse model (Almsflin/flin) and ALMS1-silenced human
                                                                                                 obese individuals but is disproportionate to the degree of
             primary adipocytes, whereas selective reactivation
             of ALMS1 gene in AT of an ALMS conditional knock-                                   adiposity and body fat distribution (4,6). Significantly,
             down mouse model (Almsflin/flin; Adipo-Cre1/2) restores                               patients with ALMS are exquisitely sensitive to caloric
             systemic insulin sensitivity and glucose tolerance.                                 intake (7) and their metabolic profile of severe IR is similar
             Hence, we show for the first time the relative AT failure                            to that seen in lipodystrophy (8), a condition of partial or
             in human obese cohorts to be a major determinant of                                 complete loss of adipose tissue (AT). The severe metabolic
             accelerated IR without evidence of lipodystrophy. These                             consequences of AT deficiency have been conceptually
             new insights into adipocyte-driven IR may assist de-                                linked to obesity-related IR by the notion of “adipose
             velopment of AT-targeted therapeutic strategies for                                 expandability” (9). According to this hypothesis, the abil-
             diabetes.                                                                           ity of AT to store excess energy is finite and when this

             1Department of Diabetes, Endocrinology and Metabolism, Queen Elizabeth Hospital     10Vaxine Pty Ltd, Bedford Park, Australia
             Birmingham, Birmingham, U.K.                                                        11INSERM,  UMR_U1112, Ciliopathies Modeling and Associated Therapies Group,
             2Institute of Metabolism and Systems Research, University of Birmingham,            Laboratoire de Génétique Médicale, Fédération de Medecine Translationelle de
             Birmingham, U.K.                                                                    Strasbourg, Strasbourg, France
             3Institute of Cardiovascular Sciences, University of Birmingham, Birmingham, U.K.
                                                                                                 Corresponding authors: Tarekegn Geberhiwot, tarekegn.hiwot@uhb.nhs.uk, and
             4INSERM, UMR_U1112, Laboratoire de Génétique Médicale, Université de Stras-
                                                                                                 Vincent Marion, vincent.marion@inserm.fr
             bourg, Hôpitaux Universitaires de Strasbourg, Fédération de Médecine Trans-
                                                                                                 Received 22 June 2020 and accepted 17 September 2020
             lationnelle de Strasbourg, Strasbourg, France
             5Flinders Medical Centre, Flinders University, Bedford Park, Australia              This article contains supplementary material online at https://doi.org/10.2337/
             6Institute of Genetics and Molecular and Cellular Biology, CNRS/INSERM, Collège     figshare.12988274.
             de France, Illkirch, France                                                         T.G. and V.M. are co–senior authors.
             7NutriOmics Unit, INSERM, Sorbonne Université, Assistance-Publique Hôpitaux de
                                                                                                 © 2020 by the American Diabetes Association. Readers may use this article as
             Paris, and Nutrition Department, Pitié-Salpêtrière Hospital, Paris, France
             8Oxford Centre for Diabetes, Endocrinology and Metabolism, NIHR Oxford Bio-
                                                                                                 long as the work is properly cited, the use is educational and not for profit, and the
                                                                                                 work is not altered. More information is available at https://www.diabetesjournals
             medical Research Centre, University of Oxford, Oxford, U.K.
             9Service de Génétique Médicale et CARGO, Institut de Génétique Médicale
                                                                                                 .org/content/license.

             d’Alsace, Hôpitaux Universitaires de Strasbourg, Strasbourg, France                 See accompanying article, p. 323.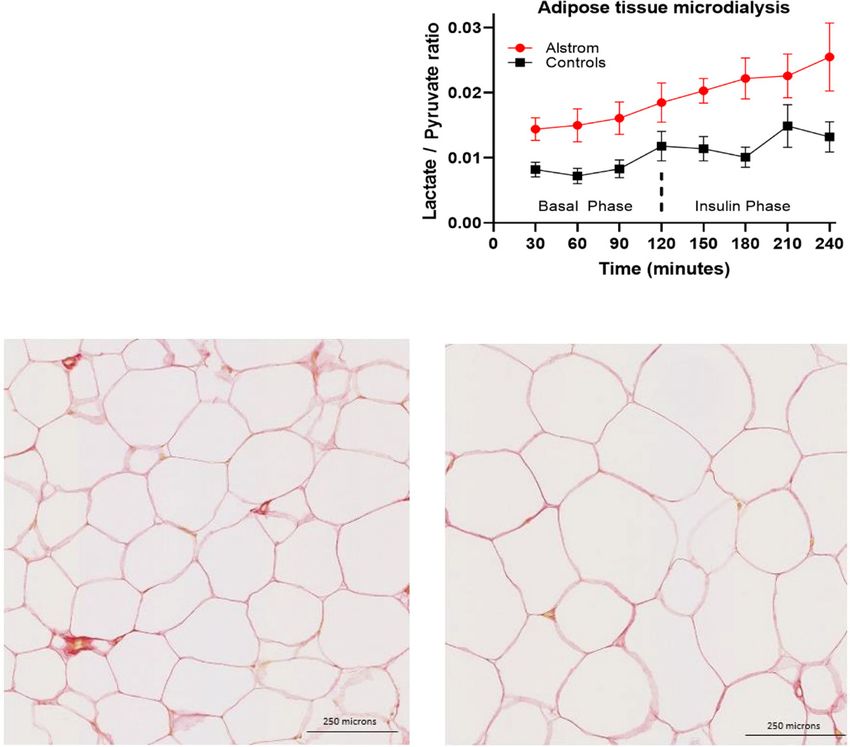
diabetes.diabetesjournals.org                                                               Geberhiwot and Associates    365

limit is reached, whether at very low absolute levels in        a rate of 40 mU/m2/min for 2 h. At 124 min, 20% dextrose
lipodystrophy or at high absolute levels as in obesity,         solution with [13C]-glucose (enriched to 4%) was infused.
lipotoxicity of AT and other organs ensues (9–11). Despite      The rates of hepatic glucose production and glucose dis-
the conceptual appeal of the notion that obesity-related        posal were calculated with a modified version of the Steele
metabolic disease arises from relative AT capacity failure,     equations (35).
no human examples of obesity with disproportionate                 Serum [U-13C]-glucose enrichment was determined by
metabolic complications due to constraint of AT expansion       gas chromatography–mass spectrometry (gas chromatog-
have been described. Currently, it is not known how the         raphy, Agilent 6890N, and mass spectrometry, Agilent
underlying molecular defects in ALMS result in severe IR        5973N; Agilent Technologies). Glucose was extracted
or whether AT dysfunction plays a role in IR. In an ALMS        with use of methanol-chloroform and hydrochloric acid,
mouse model, a GLUT4 glucose transport defect was pro-          dried under nitrogen gas, and then derivatized using the
posed as an early sign of metabolic alterations (12),           heptofluorobuyric acid method as previously described
although others using ALMS1-silenced human preadipo-            (37). The glucose derivative was acquired by selection of
cytes reported that proximal signaling events in response       ion monitoring at mass-to-charge ratios (m/z) 519 and
to insulin were unaffected in the absence of ALMS1 (13).        525 for unlabeled and [U-13C]-glucose, respectively. Serum
   We hypothesized that AT dysfunction may be a key             [U-13C]-glucose enrichment was determined using a stan-
determinant of accelerated IR in our monogenic obese            dard curve for [U-13C]-glucose.
human ALMS cohort. To test this hypothesis, we used an
                                                                AT Microdialysis
integrative physiological approach to assess intermediary
                                                                A microdialysis catheter (CMA 63; M Dialysis AB, Stock-
metabolism and subcutaneous AT (sAT) structure and
                                                                holm, Sweden) was inserted 10 cm lateral to the umbilicus
function in ALMS and matched polygenic obese control
                                                                and connected to a microdialysis pump containing an
subjects. To gain further insight into the role of ALMS1 in
                                                                isotonic fluid, Perfusion Fluid T1 (M Dialysis AB), which
adipocyte dysfunction, we generated an ALMS mutant
                                                                was infused at a fixed rate of 0.3 mL/min. A microvial was
mouse model and then selectively reactivated ALMS1
                                                                connected to the exit end, and samples were collected
gene just in the adipocyte tissue. Selective reactivation
of ALMS1 in AT restored the whole systemic IR.                  every 30 min throughout the clamp procedure. Glycerol,
                                                                lactate, and pyruvate concentrations were measured in
RESEARCH DESIGN AND METHODS                                     microdialysate with an enzyme-kinetic analyzer (CMA
                                                                Iscus Flex). The rate of interstitial glycerol appearance
Clinical, Biochemical, and Imaging Assessment
                                                                was taken to reflect the rate of sAT lipolysis (36).
The human study took place in the National Institute for
Health Research/Wellcome Trust Clinical Research Facil-         AT Biopsy and Analysis
ity, Birmingham, U.K. Weight was measured using the             sAT biopsies were collected from the periumbilical region.
same digital weighing scale at all study visits, height was     Samples were preserved in 4% formalin solution and sub-
measured using a stadiometer, and BMI was calculated as         sequently embedded in paraffin. Fixed samples were sec-
weight in kilograms divided by the square of height in          tioned in 5-mm slices and stained with hematoxylin-eosin
meters. Waist circumference (WC) was measured with the          for determination of adipocyte morphology. Picrosirius red
subject in an erect posture just above the iliac crest. Blood   staining was used to assess fibrosis and CD68 and CD163
was collected after a 12-h fast, and plasma and serum were      immunostaining to assess macrophage infiltration.
separated immediately and stored at 280°C. Hemoglobin              Analysis of fibrosis was undertaken by histomorphom-
A1c (HbA1c), insulin, C-peptide, free fatty acids (FFA), en-    etry with use of Calopix (TRIBVN Healthcare, Châtillon,
hanced liver fibrosis (ELF) test, and adipokines (adiponec-      France) with content color thresholds. Total fibrosis was
tin and leptin) were analyzed as previously described. Liver    expressed as a ratio of total AT area, as described by Divoux
stiffness was assessed by transient elastography (Fibro-        et al. (37). Pericellular fibrosis was assessed in 10 fields of
Scan; Echosens, Paris, France) as previously described (34).    250 3 250 mm and expressed as a ratio of the sum of field
                                                                surfaces. Histological scoring of fibrosis was also applied as
Hyperinsulinemic-Euglycemic Clamp                               described by Bel Lassen et al. (38,39). Adipocyte images
Hyperinsulinemic-euglycemic clamping (HEC) was com-             were obtained at 340 magnification, and morphological
menced at 0900 h after an overnight fast. Glucose con-          analyses were performed with use of Adiposoft software
centrations were measured in arterialized blood. Participants   (Center for Applied Medical Research, University of Nav-
were given a bolus (2 mg/kg) of D-glucose (U-13C) (Cam-         arra). Adipocyte size and number were measured in two
bridge Isotope Laboratories, Cambridge, U.K.) followed by       fields of 1,000 3 1,000 mm using a validated, optimized
continuous infusion (0.02 mg/kg/min) for 4 h. During the        sequence of image analysis steps in Adiposoft. On average
first 2 h (basal phase), blood glucose was checked every         267 adipocytes were measured per participant.
15 min and steady-state blood samples were taken after
90, 105, 120 min for measurement of insulin, FFA, and           Reagents and Kits
stable isotopes. At 120 min, an insulin infusion (Actrapid;     2-(N-7-nitrobenz-2-oxa-1,3-diazol-4-yl)amino)-2-deoxy-
Novo Nordisk, Copenhagen, Denmark) was commenced at             glucose (2-NBDG) was from Molecular Probes, Invitrogen,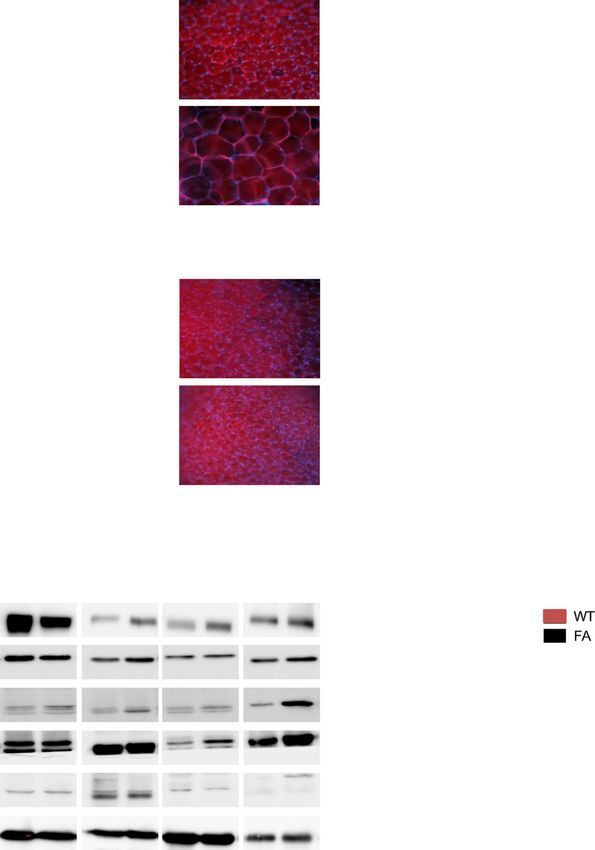
366   AT and Insulin Resistance in Alström Syndrome                                        Diabetes Volume 70, February 2021

and Hoechst 33258, cat. no. H3569 and C10587, was from          ELISA kit (Crystal Chem). Mice were sacrificed by cervical
LifeTech. AdipoRed Assay Reagent was from Lonza (cat. no.       dislocation.
PT-7009; Lonza, Basel, Switzerland). Lentiviral particles
were from Santa Cruz Biotechnology: ALMS1 shRNA (h)             Insulin-Dependent Glucose Uptake
Lentiviral Particles (cat. no. sc-72345-V) and Control shRNA    High-fat-fed (Specialty Feed, cat. no. SF03-020; 23%
Lentiviral Particles-A (cat. no. sc-108080). A glucose uptake   fat, 0.19% cholesterol, simple carbohydrates, based on
assay kit (Colorimetric) was from Abcam (cat. no. ab136955).    AIN93G) mice were fasted for 3–6 h before start of
The ELISA Kit for Leptin (LEP) was from Cloud-Clone (cat.       experiment. Insulin (0.75 units/kg) was injected intrave-
no. SEA084Mu).                                                  nously via the tail vein in combination with 3 mCi of 2-[1-C
                                                                (14)] deoxy-D-glucose (PerkinElmer, Melbourne, Australia).
In Vivo Mouse Studies                                           Blood glucose and samples were collected at 0, 5, 10, 15,
Animal studies were performed in accordance with the            20, 40, and 60 min after injection from the tail. Mice were
recommendations in the Australian Code of Practice for          sacrificed (cervical dislocation), and liver, muscle (both
the Care and Use of Animals for Scientific Purposes of the       sides soleus, and extensor digitorum longus 5 glycolytic
National Health and Medical Research Council. Alms1foz/foz      muscles; left thigh), heart, SAT, and visceral AT (peri-renal)
(fat aussie [FA]) mice and Alms11/1 [wild type]) litter-        were isolated and rinsed in ice-cold PBS, quickly dried on
mates were maintained on a C57BL/6J background in the           flint-free paper tissue, and weighed. Then, a piece of the
animal facility at Flinders Medical Centre under pathogen-      isolated tissue was chopped into small pieces, weighed
free conditions in a 12-h light/dark cycle. Mice had free       again, homogenized for 1 h at 60°C in 1 N NaOH, and then
access ad libitum to water and either normal chow (rat and      neutralized with HCl (1 mol/L). One part of the homog-
mouse maintenance pellets, Gordon’s Specialty Stock             enate was used for determination of deoxyglucose 1 deox-
Feeds, Yanderra, Australia). Primers flanking the foz mu-        yglucose-6-phosphate by precipitating proteins with 6%
tation were used for PCR genotyping: forward, ACA ACT           perchloro acid and the supernatant measured by scintillation
TTT CAT GGC TCC AGT; reverse, TTG GCT CAG AGA CAG               counter (PerkinElmer). The other part was mixed with 0.3 N
TTG AAA. The Almsflin/flin mouse model was generated              ZnSO4 to react with deoxy-glucose-6-P, and the complex was
using the EUCOMM/KOMP-CSD ES cell with the promoter             precipitated with 0.3 N Ba(OH)2 and the supernatant used
driven line, with further details available from https://       for scintillation measurement.
www.knockoutmouse.org/about/eucomm. Briefly, the cor-            AdipoRed Staining of AT
responding MGI allele was the Alms1tm1a(EUCOMM)tm1e. The        Fat tissue of 60-day-old and 120-day-old mice was isolated
ES cell strain on a C57BL/6N background with IKMC               and briefly washed in PBS (3.2 mmol/L Na2HPO4,
project number 27978 was used for blastocyst injection.         0.5 mmol/L KH2PO4, 1.3 mmol/L KCl, and 135 mmol/L
The targeting vector used was the PRPGS00084_A_C01.             NaCl, pH 7.4). Samples were then placed in 4% para-
Following mouse production, the resulting modified allele,       formaldehyde (in 0.1 mol/L sodium phosphate buffer,
corresponding to the Almsflin/flin modified allele, contained      pH 7.2) for 15 min, washed in PBS and incubated in
the Frt-lacZ-LoxP-Neo-Frt-LoxP sequence between exon            AdipoRed dye (1/25; Lonza) with 30 mmol/L DAPI
6 and exon 7 of the Alms1 gene without the third loxP after     (Sigma-Aldrich) for 15 min. After three washes with
exon 7. The C57BL/6J congenic strain for the adiponectin-       PBS, samples were mounted on slides and pictures were
Cre expressing mouse line was obtained from The Jackson         taken using Zeiss Axio Imager fluorescence microscope.
Laboratory, under the reference number 010803-B6;
FVB(Adipoq-cre)1Evdr/J, stock no. 010803. All animals           FFA Measurement
were housed in a temperature- and humidity-controlled           Plasma (10 mL) was spiked with 5 mL fatty acid standard
facility, with a 12-h light/12- h dark cycle and feeding with   mix containing 260 ng myristic acid-d3, 1,128 ng palmitic
chow diet (LM-485; Harlan Teklad Premier Laboratory             acid-d3, 840 ng stearic acid-d3, 650 ng linoleic acid-d4,
Diets) and tap water ad libitum. Mice were tested for IR        1.04 ng arachidic acid-d3, 432 ng arachidonic acid-d8,
by insulin tolerance test (ITT) and intraperitoneal glucose     650 ng behenic acid-d3, 108 ng DHA-d5, 0.52 ng ligno-
tolerance test (GTT). The ITT was performed in 4-h-fasted       ceric-d4, and 0.4 ng cerotic acid-d4. Plasma was mixed
mice. Insulin (Humulin R; Eli Lilly) was injected intraper-     with 1.2 mL Dole extraction solvent (2 mol/L of 40/10/1
itoneally at 0.5 units/kg body wt in 0.9% saline (Pfizer).       v/v/v isopropanol/hexane/phosphoric acid) and vigor-
The GTT was performed in 18-h-fasted mice. Glucose was          ously mixed for 5 min. FFAs were finally extracted
injected, 2 g/kg body wt, in 0.9% saline. The tail was          with 1 mL hexane and 1.5 mL distilled water. Analysis
snipped for blood collection, and the plasma glucose            was conducted by gas chromatography–mass spectro-
was determined at 0, 15, 30, 60, and 120 min in the             metry operating in negative chemical ionization mode
GTT with a glucometer (Optium Xceed; Abbott). Alterna-          as previously described.
tively, plasma insulin measurement was performed with
blood from 4-h-fasted mice collected from conscious ani-        Cell Culture
mals via submandibular bleeding and analyzed for fasting        Human white visceral preadipocytes (cat. no. C-12732;
insulin with a commercial ultrasensitive mouse insulin          PromoCell) were purchased. The preadipocytes were
diabetes.diabetesjournals.org Geberhiwot and Associates 367
seeded according to the manufacturer’s protocol and tissues cryosections were processed for protein detection
cultured in the preadipocyte growth medium (cat. no. after methanol fixation and permeabilized with 0.1%
C-27410; PromoCell) to confluence. One day before in- Triton X-100. The microscopy slides were mounted for
duction of terminal adipogenesis, the cells were infected detection with VECTASHIELD Mounting Medium (cat.
with specific lentiviral particles, and on the next day no. H-1200; Vector Laboratories). For viewing of im-
adipogenic differentiation was induced with preadipo- mune-detected proteins, cells were formalin fixated for
cyte differentiation medium (cat. no. C-27436; Promo- 15 min and were directly blocked, followed by immu-
Cell) for 2 days. After the differentiation phase, the nostaining and acquisition with an upright Zeiss Axio
medium was finally changed to the Adipocyte Nutrition Imager Z2 microscope.
Medium.
Statistical Analysis
RNA Extraction, cDNA Synthesis, Quantitative PCR, The required sample size (number of animals per group) to
and TaqMan detect a statistically significant effect with a two-tailed
Total RNA was prepared from the different tissues and Student t test was calculated based on the sample size
cells with a RiboPure kit (cat. no. AM1924; Ambion) determination method. Type I error probability was at
followed by a DNAse treatment with TURBO DNA-free 0.05 and with a power of 0.90. Depending on which
(cat. no. AM 1907; Ambion). RNA integrity was assessed technique was used, the minimum difference considered
by gel electrophoresis and RNA concentration by Eppen- meaningful was set between 10 and 15% with an anticipated
dorf BioPhotometer plus with the Hellma Tray Cell (cat. coefficient of variation between 5 and 10. In most experi-
no. 105.810-uvs; Hellma). Reverse transcription of 1 mg ments, the investigators were not blinded to sample iden-
total RNA to cDNA was performed using the Bio-Rad tity. Data are presented as mean 6 SE when normally
iScript cDNA Synthesis Kit (cat. no. 170-8891; Bio-Rad distributed or median with interquartile range (IQR) other-
Laboratories). Real-time quantitative PCR amplification wise. Categorical variables are reported as numbers and
was performed in a Bio-Rad CFX96 Real-Time System percentages. Unpaired Student t test (or, where appropriate,
using the iQ SYBR Green Supermix (cat. no. 170-8886; its nonparametric equivalent) was used to compare inde-
Bio-Rad Laboratories) and primer sets optimized for pendent groups. Area under the curve (AUC) analysis was
tested targets for SYBR Green–based real-time PCR performed with use of the trapezoidal method for intersti-
for the real-time PCR. TaqMan analysis was carried tial glycerol, lactate, and pyruvate release during the clamp.
out with the specific gene assay with the TaqMan Fast The Shapiro-Wilk test was used to determine the normality
Advanced Master Mix (cat. no. 4444557; Applied of the distribution in all cases where a parametric test
Biosystems). was used. In the event that the normality assumption
failed, the Wilcoxon signed rank test was used instead.
Western Blots and Immunofluorescence Microscopy The significance level for this study was set at P , 0.05.
Tissues were harvested after anesthesia-overdosing eutha- Statistical analyses were performed using GraphPad
nasia, and proteins were extracted with use of the radio- Prism 5 software (GraphPad Software, Inc.) and SPSS
immunoprecipitation assay buffer (50 mmol/L Tris, 150 statistical software, version 24.
mmol/L NaCl, 0.1% SDS, 1% Triton-X100; pH 7.4)
supplemented with cOmplete Mini Protease Inhibitor Data and Resource Availability
Cocktail and PhosSTOP phosphatase inhibitor cocktail The data sets generated during and/or analyzed during the
(Roche, Rotkreuz, Switzerland). Samples were homog- current study are available from the corresponding author
enized, sonicated, and centrifuged 30 min at 17,000g, upon reasonable request.
4°C, for 30 min. Protein concentration was determined by
BCA Assay (Thermo Fisher Scientific). Samples were boiled RESULTS
at 99°C for 10 min, and 25 mg protein was loaded per lane. Baseline Characteristics of Study Participants
Cellular proteins from cells were obtained by trichloro- All participants with ALMS had disease-causing pathogenic
acetic acid precipitation, and immunoblot analyses were mutations and met clinical diagnostic criteria (Supplemen-
performed with use of 30–50 mg total protein. Specific tary Table 1). Anthropometric, clinical, and metabolic
antibody binding was visualized with use of the Super- characteristics are shown in Table 1. There was no differ-
Signal West Femto Maximum Sensitivity Substrate (cat. ence between ALMS participants and obese control sub-
no. Lf145954; Pierce) on a Bio-Rad VersaDoc Imaging jects in terms of age, sex, weight, BMI, and WC. In line with
System. Ponceau S staining of gel lanes was used as loading participants with severe IR, most ALMS participants had
control and to normalize the signal obtained after specific type 2 diabetes and advanced nonalcoholic fatty liver
immunodetection of the protein of interest using the Bio- disease compared with none of the control subjects.
Rad Quantity One program. For immunofluorescence ALMS participants were also more likely to have hyper-
experiments, the cells were seeded on Permanox eight- tension and an atherogenic lipid profile (Table 1). Surro-
well Lab-Tek II Chamber Slide (cat. no. 177445, Nunc). gate markers of IR (fasting glucose and insulin and HOMA
Cells were treated as indicated, and then both cells and of IR [HOMA-IR]) were all high and QUICKI was low in368 AT and Insulin Resistance in Alström Syndrome Diabetes Volume 70, February 2021
Table 1—Demographic and clinical characteristics of study participants and control subjects with common obesity
Subjects Control subjects
Patient characteristics with ALMS (n 5 12) (n 5 11) P
Age (years) 26.5 6 9.7 29.7 6 4.2 0.33
Male, n (%) 67 72 0.14
Weight (kg) 76.3 6 14.4 88.1 6 16.9 0.09
BMI (kg/m2) 30.3 6 6.2 29.9 6 4.2 0.86
WC (cm) 96 6 12 100 6 13 0.41
Subjects with diabetes, % 67 0 —
Systolic BP (mmHg) 121 6 11 120 6 12 0.77
Glucose (mmol/L) 8.6 6 5 4.8 6 0.5 0.02
Insulin (pmol/L) 360 (245–478) 31 (18–62) ,0.001
HOMA-IR 14.2 6 9.6 1.2 6 0.7 ,0.001
QUICKI 0.28 6 0.05 0.38 6 0.04 ,0.001
M (mg/kg/min) 1.94 6 0.87 4.86 6 2.37 ,0.001
Gd (mg/kg/min) 1.25 6 0.85 3.65 6 1.81 ,0.001
EGP (mg/kg/min) 1.6 (1.4–2.4) 0.3 (0–1.9) 0.03
Hepatic insulin sensitivity disposition index 0.002 6 0.002 0.01 6 0.01 ,0.001
NEFA (mmol/L) 0.72 6 0.25 0.58 6 0.23 0.18
NEFA postinsulin (mmol/L) 0.14 6 0.09 0.02 6 0.02 ,0.001
NEFA_half_max 511 6 355 55 6 24 0.00
Adipose ISI (mmol/L 3 pmol/L) 244.3 6 169.4 23.27 6 17.22 0.00
Adiponectin (ng/mL) 1,478 6 756 7,310 6 3,823 ,0.001
Leptin (ng/mL) 15.3 6 11 5.8 6 4.7 0.0259
Ratio of adiponectin (mg/mL) to leptin (ng/mL) 136 6 108 2,960 6 3,052 0.006
Cholesterol (mmol/L) 4.4 6 1 4.4 6 0.9 0.94
Triglyceride (mmol/L) 2.8 6 2 1.3 6 0.6 0.03
HDL cholesterol (mmol/L) 0.7 6 0.2 1.2 6 0.2 ,0.001
Alanine transferase units/L 86.8 6 55.2 19.3 6 8.7 ,0.001
Aspartate transferase units/L 41.5 6 23 18.5 6 3.7 0.01
ELF score 9.1 6 1.3 7.4 6 0.7 ,0.001
Transient elastography (kpa) 9.35 (6.8–12.93) 4.9 (3.3–7.1) 0.05
IHD, n (%) 2 (17) 0 (0) —
Insulin, n (%) 2 (17) 0 (0) —
Oral hypoglycemic, n (%) 10 (83) 0 (0) —
Antihypertensive agents,
n (%) 11 (92) 0 (0) —
Lipid-lowering agents, n (%) 5 (42) 0 (0) —
Data are means 6 SE or median (IQR) unless otherwise indicated. BP, blood pressure; EGP, endogenous (hepatic) glucose production;
Gd, glucose disposal; IHD, ischemic heart disease; ISI, insulin sensitivity index; NEFA, nonesterified fatty acid.
ALMS participants (P , 0.001 for all) (Table 1). ALMS response to insulin (mean 6 SE 1.9 6 0.8 vs. control
participants had significantly lower plasma adiponectin subjects 4.8 6 2.3 mg/kg/min; P , 0.001) and had lower
(mean 6 SE 1,479 6 756 vs. 7,311 6 3,824 [P , weight-adjusted glucose disposal rates (1.2 6 0.8 vs.
0.001]) and higher leptin concentrations (15 6 11 vs. control subjects 3.6 6 1.8 mg/kg/min; P , 0.01), in-
5.8 6 4.8 [P 5 0.026]). dicating severe muscle IR in ALMS participants versus
obese controls. Endogenous (hepatic) glucose production
Participants With ALMS Have Severe Muscle and rates were higher in ALMS participants than obese control
Hepatic IR subjects (1.65 mg/kg/min [IQR 1.4–2.9) vs. 0.3 mg/kg/min
HEC (Fig. 1A and B) revealed that ALMS participants (0.03–1.9); P 5 0.02) (Fig. 1C). Furthermore, the hepatic
required lower weight-adjusted glucose infusion rates in insulin sensitivity disposition index for ALMS participantsdiabetes.diabetesjournals.org Geberhiwot and Associates 369
was lower (0.002 6 0.002 vs. 0.024 6 0.01 mg/kg/min/ early adolescence (18). We first used FA mice to identify
mL; P , 0.001) (Fig. 1D). the temporal relationship between onset of obesity, hyper-
insulinemia, and impaired glucose tolerance, as well as to
AT From ALMS Participants Has Altered Structure and examine for insulin-signaling defects in insulin-responsive
Is Severely Dysfunctional tissues that could be secondary to the ALMS1 mutation. In
sAT releases the majority of circulating nonesterified fatty comparison with age-matched wild-type littermates,
acids (NEFA). Systemic NEFA concentrations were similar 6-month-old FA mice were obese (mean 6 SE 45.5 6
in ALMS and control subjects in the fasting state but were 1.7 vs. 26.4 6 1.3 g; P , 0.05) (Fig. 3A), although contrary
significantly higher in ALMS than in obese control subjects to the adipocyte hyperplasia that underlies common obesity,
after insulin infusion (mean 6 SE 0.14 6 0.09 vs. 0.03 6 obesity in the FA was reflected in adipocyte hypertrophy,
0.04 mmol/L (P 5 0.001) (Fig. 1E and F). This difference similar to human ALMS data observations (Fig. 3B). Like
between the two cohorts became more pronounced when humans, obese FA mice exhibited fasting hyperglycemia and
we took into account the level of fasting insulin by deriving were highly insulin resistant on ITT compared with their
the AT IR index (ADIPO-IR) (ADIPO-IR 5 fasting NEFA 3 littermates (ITT) (Fig. 3C). Two-month-old FA mice prior to
fasting insulin) (14). ADIPO-IR in ALMS participants was development of obesity and adipocyte hypertrophy (Fig. 3D
nearly 10-fold higher than in obese control subjects (244.3 6 and E) already exhibited fasting hyperglycemia and IR on ITT
169.4 vs. 23.2 6 17.2 mm/pmol/L; P , 0.0001)) (Fig. 1G). (Fig. 3F), consistent with IR preceding rather than following
For quantification of AT insulin sensitivity, regression obesity. Immunodetection of IRAP, AKT, phosphorylated
analysis was used to establish the insulin concentration AKT, GLUT4, and C/EBP-a in insulin-responsive tissues
causing half-maximal suppression of serum NEFA; this (heart, liver, skeletal muscles, and white AT [WAT]) from
concentration was eightfold higher in ALMS participants 6-month-old nonfasted FA mice showed an increased phos-
than in obese control subjects (506 pmol/L [IQR 239.2– phorylated AKT–to–AKT ratio in WAT only (Fig. 3G), con-
717.7] vs. 62 [27–70]; P , 0.0001), confirming the ex- sistent with an increase rather than reduction in insulin
treme AT IR in ALMS (Fig. 1H). The responsiveness of sAT receptor activation and signaling in the proximal end of the
lipolysis to insulin was quantified by direct measurement insulin pathway. Insulin-stimulated deoxyglucose uptake
of interstitial glycerol concentration using microdialysis studies confirmed impaired uptake restricted to WAT in
during the HEC (Fig. 2A). In the fasting state, the rate of FA with compensatory increased deoxyglucose uptake by
increase in interstitial glycerol concentration was not muscle (Fig. 3H), pointing to a specific defect in adipocyte
different in ALMS participants and obese control subjects glucose transport as the primary site of IR in FA mice.
(P 5 0.05). In control subjects, insulin infusion suppressed Consistent with the human data, the 6-month-old FA
the rate of interstitial glycerol release (basal AUC 240 6 mice showed elevated circulating levels of leptin (Supplemen-
88 mmol/L $ h vs. postinsulin AUC 163 6 80 mmol/L $ h; tary Fig. 2A). Further metabolic characterization of the
P , 0.001), but insulin failed to suppress glycerol release FA mice showed that the circulating lipid profile was also
in ALMS participants (basal AUC 309 6 84 mmol/L $ h altered with significant decrease in the FFAs C16:0, C18:2
vs. postinsulin AUC 279 6 95 mmol/L $ h; P 5 0.26). n-6, C18:1 n-9, and C18:1 n-7 in the FA mice plasma
Furthermore, the sAT interstitial fluid lactate-to-pyruvate compared with controls (Supplementary Fig. 2B), a met-
ratio (an established marker of mitochondrial dysfunc- abolic effect associated with increased lipid droplets
tion and oxidative stress) (15,16) was markedly elevated denoting liver steatosis in the Alms mutant mice (Sup-
in ALMS participants (Fig. 2B). Taken together, these plementary Fig. 2C).
observations provide compelling evidence for dynamic
AT dysfunction in ALMS. sAT histology studies showed Adipocyte-Specific Reactivation of ALMS1 Reverses
that adipocyte size was on average larger in ALMS partic- Type 2 Diabetes Phenotype in a Mouse Model of ALMS
ipants than obese control subjects (6,033 1 875 vs. 4,346 6 To explore the exact contribution of AT in the metabolic
880 mm2; P , 0.001) (Fig. 2C and D). Multiorgan fibrosis phenotype of ALMS, we generated an ALMS mouse model
is a recognized feature of ALMS end-stage disease, and in where a targeting cassette containing encoding elements
murine models, primary alterations in extracellular matrix for b-galactosidase (lacZ gene), the neomycin-resistance
can influence adipose expandability (17). sAT from ALMS gene (neo), FRT, and loxP sites was inserted between exons
participants, however, showed no excess fibrosis whether 6 and 7 of the Alms1 gene (Supplementary Fig. 3A, top).
quantified as pericellular or total fat scores (Supplementary This specific insertion resulted in an Alms1 knockout
Fig. 1). model termed Almsflin/flin with no tissue Alms1 mRNA
detectable by real-time PCR (Fig. 4A). Subsequently, we
AT IR Specifically Drives the Type 2 Diabetes bred the Alms flin/flin mice with the Adiponectin-Cre mouse,
Phenotype in ALMS Mouse Model whose specific Cre activity was validated by a separate
The FA is a mutant mouse model of ALMS caused by breeding with the RosaTomato-eGFP mouse line depicting
a spontaneous 10-bp deletion and premature stop codon Cre recombinase activity only in the adipocytes (Supple-
in exon 8 of ALMS1. Similar to human ALMS patients, FA mentary Fig. 3B), to remove the floxed neo gene (Supple-
mice develop obesity, hyperinsulinemia, and diabetes in mentary Fig. 3A and bottom Supplementary Fig. 3C). The370 AT and Insulin Resistance in Alström Syndrome Diabetes Volume 70, February 2021 Figure 1—Metabolic parameters of human subjects included in this study. A–D: HEC markers of IR. E–H: NEFA concentration (conc) and Adipo-IR (fasting NEFA [mmol/L] 3 fasting insulin [pmol/L]) as measured during insulin clamp. Data are presented as n (%), median (IQR), or mean 6 SD, as applicable. Significance was set at P , 0.05. **P , 0.01, ***P , 0.001.
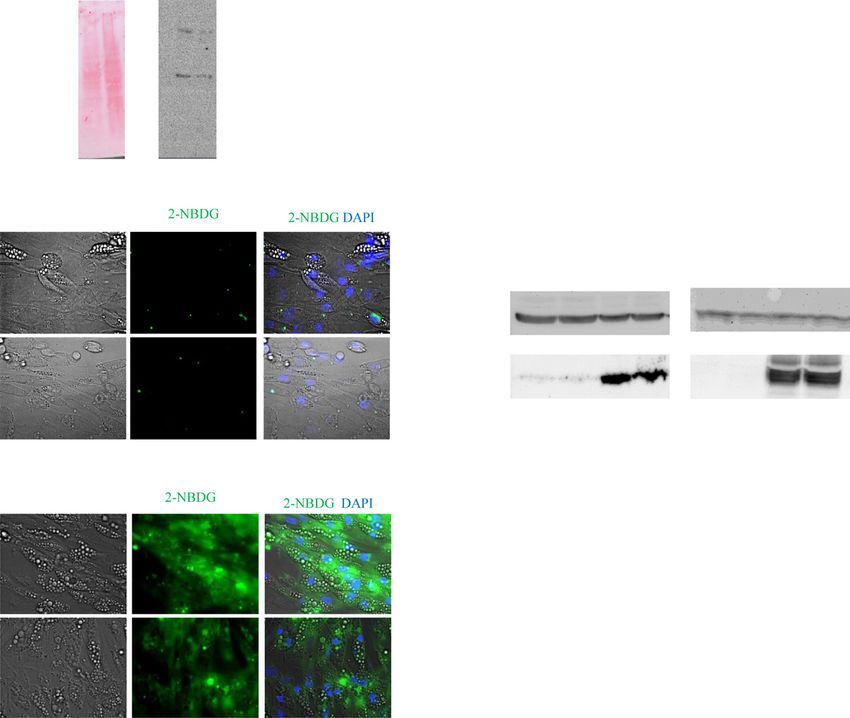
diabetes.diabetesjournals.org                                                                        Geberhiwot and Associates       371

Figure 2—AT characteristic of patients with ALMS and matched control subjects. A: Changes in glycerol levels measured in sAT interstitial
fluid during insulin clamp at the basal and insulin phase. Values shown are mean and SEM (AUC basal phase 0.01, AUC insulin phase P ,
0.001). B: Lactate-to-pyruvate ratio AUC basal phase 0.01, AUC insulin phase 0.03). C and D: sAT histology revealed significant
heterogeneity observed in adipocyte size in ALMS compared with obese control subjects as seen on hematoxylin-eosin staining of sAT.
372    AT and Insulin Resistance in Alström Syndrome                                           Diabetes Volume 70, February 2021

Figure 3—Metabolic characterization of FA mice. A: Mean body weight from 6-month-old male mice. B: Visceral AT from 6-month-old male
mice stained with AdipoRed. C: ITT and corresponding histogram showing AUC P , 0.001 from 6-month-old male mice. D: Mean body
weight from 2-month-old male mice. E: Visceral AT from 2-month-old male mice stained with AdipoRed. F: ITT and histogram showing AUC
from 2-month-old male mice. G: Immunoblots of insulin signaling-related proteins in tissues from 6-month-old mice. H: Measurement of
insulin-stimulated deoxyglucose uptake levels in 2-month-old mice (n 5 8 mice per genotype). Scale bar, 25 mmol/L. WT, wild type.

resulting reactivation of Alms1 expression specifically in          first 3 months (Fig. 4B), exhibiting adipocyte hypertrophy,
adipocytes (Fig. 4A) was associated with a loss of the             similar to the human ALMS data (Fig. 4C). This obesity and
obesity phenotype for the Almsflin/flin; Adipo-Cre1/2 com-           adipocyte hypertrophy reverted when AT Alms1 expression
pared with Almsflin/flin mice, which became obese in their           was restored in the Almsflin/flin; Adipo-Cre1/2 mice (Fig. 4C).
diabetes.diabetesjournals.org                                                                            Geberhiwot and Associates        373

Figure 4—Metabolic characterization of Almsflin/flin and Almsflin/flin; Adipo-Cre1/2 mice. A: Fold change in Alms1 expression levels measured
by real-time PCR in the indicated tissues for the given genotypes. Gapdh as reference gene. n 5 5 per group with significance set at *P , 0.01.
B: Mean body weight from 3-month-old male mice on chow diet. n 5 8 per group with significance set at *P , 0.05. C: Visceral AT from
3-month-old male mice stained with AdipoRed. D: Immunodetection of GLUT4, insulin receptor, AKT serine/threonine kinase 1 (AKT1), and
b-tubulin (b-tubulin) in 3-month-old visceral AT (25 mg total protein loaded per lane). E: Intraperitoneal GTT (ipGTT) and corresponding
histogram showing AUC P , 0.005 from 3-month-old male mice. F: Intravenous ITT (ivITT) and corresponding histogram showing AUC P ,
0.001 from 3-month-old male mice. b-TUB, b-tubulin; WT, wild type.

Immunodetection of AKT, GLUT4, and insulin receptor in                  not in ALMS1-silenced adipocytes (Fig. 5C and D). This
the visceral AT extracts was similar for the three tested               difference was not related to impaired AKT phosphoryla-
genotypes (Fig. 4D) with no significant differences upon                 tion, a key mediator of insulin signaling in adipocytes;
ImageJ quantification (data not shown). At 3 months old,                 p-S473-AKT levels were readily detected after 30 min in-
Almsflin/flin mice exhibited significant fasting hyperglyce-               cubation with insulin in both control and ALMS1-silenced
mia, glucose intolerance, and IR on both GTT (Fig. 4E) and              adipocytes (Fig. 5E). We also checked the possible impact of
ITT (Fig. 4F) compared with their wild-type littermates. By             ALMS1 silencing on adipogenesis. Following ALMS1 knock-
comparison, glucose tolerance and IR reverted to normal in              down in preadipocytes (Supplementary Fig. 4A), we mea-
Almsflin/flin mice when Alms1 expression was restored ex-                 sured the expression levels of classical adipogenic markers
clusively in the AT (Fig. 4E and F).                                    during differentiation. Although a significant decrease in
                                                                        the antiadipogenic factor PREF-1 was observed (Supplemen-
ALMS1 Plays a Role in Insulin-Stimulated Glucose
Uptake in Human Adipocytes                                              tary Fig. 4B), no significant difference in expression of pro-
Given the evidence of AT-driven IR both in ALMS partic-                 adipogenic transcription factors such as the cEBPs and
ipants and the three types of mouse models suggesting a key             PPARg was detected (Supplementary Fig. 4C–G), indicating
role for Alms1 in insulin-regulated glucose homeostasis, we             that ALMS1 is not required for adipogenic differentiation.
knocked down ALMS1 in mature human adipocytes using                     In parallel, following specific ALMS1 lentiviral-mediated
a commercial ALMS shRNA lentivirus (Fig. 5A). We assessed               knockdown in mature human adipocyte, we measured
the effect on glucose absorption using the fluorescent                   the mitochondrial marker expression level of UCP-1 and
glucose analog, 2-NBDG. In the absence of insulin stimu-                found a significant reduction of UCP-1 expression levels
lation, 2-NBDG uptake was not seen in control or ALMS1-                 in ALMS1-deprived mature adipocytes compared with
silenced adipocytes (Fig. 5B). Upon insulin stimulation,                controls (Supplementary Fig. 4H), denoting that ALMS1
2-NBDG uptake was significantly increased in control but                 inactivation also impacts mitochondrial function.
374 AT and Insulin Resistance in Alström Syndrome Diabetes Volume 70, February 2021 Figure 5—ALMS1 silencing impairs glucose absorption downstream of AKT phosphorylation step. A: Representative Ponceau S staining (left) and immunodetection of ALMS1 protein at 460 kDa (right) on cellular extracts from either control-shRNA-treated or ALMS1-shRNA- treated adipocytes. B: Photographs of 2-NBDG (green) in control or ALMS1-silenced mature adipocytes in absence of insulin. DIC, differential interference contrast pictures. C: Photographs of 2-NBDG uptake in presence of insulin. Scale bar, 20 mm. D: Quantification of cellular glucose absorption in treated human adipocytes (n 5 8 wells per group). E: Immunodetection of AKT and p-S473-AKT on mature adipocyte cell lysates in presence and absence of insulin. CTRL, control; INS, insulin. DISCUSSION We observed a disproportionately severe degree of IR The data presented herein provide new insights into the and its attendant complications in participants with ALMS relationship between obesity and IR. Firstly, our detailed compared with matched control subjects with common phenotyping of a human ALMS monogenic obese cohort obesity. A recent study of 38 participants showed no revealed a relative AT failure. Secondly, Alms1 gene in- difference in body fat distribution between ALMS partic- activation in the mouse recapitulated the metabolic profile ipants and matched obese control subjects (6), providing of human ALMS. Furthermore, complementing the human evidence that the disproportionately high rate of IR and and mouse in vivo data, Alms1 inactivation in adipocyte type 2 diabetes in ALMS is not due to differences in was shown to specifically inhibit adipocyte glucose absorp- relative fat distribution or sarcopenia. tion. Third, reactivation of Alms1 gene only in the AT of A growing body of evidence indicates that the primary Adipo-Cre1/2 mice reversed obesity, systemic IR, and defect leading to systemic IR occurs in AT. Maintenance of glucose intolerance. Taken together, these results indicate a high degree of flexibility in cell architecture and sur- that in ALMS, AT dysfunction is a major determinant in rounding extracellular matrix network has been reported driving whole-body systemic IR. as a prerequisite for healthy AT (19). The dramatic increase
diabetes.diabetesjournals.org                                                                          Geberhiwot and Associates                375

we have observed in adipocyte size in ALMS may reflect          cohort, is the sole primary cause to induce systemic IR.
that ATs undergo rapid turnover and de novo formation.         Although AT is not quantitatively important as a site of
Approximately 10% of fat cells are renewed annually in         postprandial glucose disposal compared with skeletal mus-
adults, and it has been highlighted that adipocyte devel-      cle, it does exert major remote effects on insulin sensitivity
opment and differentiations play a key role in the etiology    in muscle, liver, and other tissues (27,28).
of obesity and subsequent IR (20,21). Our findings of               It is now well established that AT is pivotal in regulating
larger and heterogeneous adipocytes proportionate to           overall glucose homeostasis, but what remained to be
the level of IR but discordant to the level of adiposity       demonstrated is how a tissue that absorbs a minimal
indicate the metabolic inflexibility of AT in the context of    20% of overall circulating levels of glucose can trigger
a chronic metabolic stressor (excess caloric intake) in our    such profound deleterious metabolic impacts when it
monogenic obese cohort. Similarly, adipocyte hypertro-         becomes dysfunctional. Impaired adipocyte glucose trans-
phy is a recognized feature of dysfunctional AT that           port in AT-conditional GLUT4 knockout mice has been
is associated with increased cellular stress, hypoxia, and     shown to be sufficient to drive whole-body extreme IR
inflammation, and a threshold may be reached beyond             and type 2 diabetes (29,30). Glucose entry into AT
which further hypertrophy impairs adipocyte metabolic          activates carbohydrate-response element–binding protein
flexibility (22,23). Furthermore, we found no evidence of       (ChREBP), which has been directly linked to whole-body
excess pericellular or total fat fibrosis between the two       insulin sensitivity (31). Furthermore, healthy adipocytes
obese cohorts. Existing evidence addressing the functional     release a lipokine, a lipid hormone linking AT to systemic
consequences of AT fibrosis are a matter of considerable        insulin sensitivity (32). In addition, it has been established
debate as to whether fibrosis is an adaptive or maladaptive     that two-thirds of all hepatic lipid content originate from AT,
process of obesity (24). In line with our hypothesis of        which indicates that any change will inevitably impact on the
relative AT failure as a driver of IR, we have shown severe    liver (33). The interesting observation that ALMS patients
AT dysfunction without fibrosis in moderately obese             develop obesity despite impaired glucose absorption prompted
patients with ALMS compared with control subjects.             us to hypothesize that the adipocyte switches cellular fuel from
This is the first study showing relative AT failure in          glucose to lipid utilization—an energy tropism switch that
a human obesity. ALMS may represent an intermediary            comes at a cost where the adipocyte starts secreting unhealthy
phenotype between lipodystrophy and extreme obesity,           signals and triggers a deleterious effect on a whole-body
distinguished by a low threshold for expression of relative    level. Similarly, any entity that restores physiological
adipose failure, but without frank anatomical deficiency of     energy usage in the adipocyte will probably improve
AT.                                                            whole-body metabolic dysfunctions—a hypothesis that
    Our two types of Alms1-deficient mouse models (nat-         warrants further investigation.
urally occurring and knockout) recapitulated the profound          In conclusion, we have shown for the first time that
systemic IR we have observed in human ALMS subjects.           relative AT failure in obesity drives systemic IR. Our result
This is consistent with a previously reported Alms1 knock-     showed the power of deep phenotyping of an ultra-rare
out mouse model where they have observed high levels of        monogenic disease to better understand common diseases
obesity and IR (5). Furthermore, using Alms1 knockout          of epidemic proportions and presented the first tractable
primary human adipocytes and mouse models, we have             genetically defined obese human model to study metabolic
shown the direct contribution of Alms1 protein in glucose      syndromes. Further studies are under way in exploring the
homeostasis in AT and the subsequent consequence for           mechanism by which ALMS1 protein alteration results in
other gluconeogenic organs in driving the whole-body           severe IR.
systemic IR.
    The precise role of Alms1 in adipocyte biology is not
fully understood, and expression decreases at an early         Acknowledgments. The authors thank all participants for their involvement
stage in adipocyte differentiation and is not altered by       in the study. The authors are grateful for the constant support of the U.K. and French
treatments known to effect differentiation (25). However,      ALMS patients’ organizations. The authors thank Shaun Bolton (Queen Elizabeth
knockdown experiments have shown that reduced Alms1            Hospital NHS Foundation Trust), Vishy Veeranna (Queen Elizabeth Hospital NHS
expression decreases adipogenesis and lipid accumulation,      Foundation Trust), and Wouter Lamers (University of Maastricht) for input.
although proximal insulin action is preserved (13). Alms1      Funding and Duality of Interest. In the U.K., this work was supported
knockout mice gain weight rapidly on a high-fat diet           by Queen Elizabeth Hospital NHS Foundation Trust and Prometic Pharmaceuticals.
                                                               In Australia, this work was supported by Flinders University and Vaxine. In France,
(6 weeks) with AT mass expansion. However, with in-
                                                               this work was supported by the French National Institute for Health and Medical
creasing time on a high-fat diet (up to 24 weeks), AT mass
                                                               Research (INSERM), the University of Strasbourg, and the SATT Conectus Alsace
fails to expand further, contrasting with observations in      maturation program. No other potential conflicts of interest relevant to this article
wild-type animals, and yet systemic IR has increased,          were reported.
indicating AT dysfunction (26). The amelioration of sys-       Author Contributions. T.G. and V.M. conceived and designed the study.
temic IR by selective reactivation of Alms1 gene only in the   S.B. recruited the study participants and performed HEC and fat biopsy. C.O., D.G.,
AT in (Almsflin/flin; Adipo-Cre1/2) mice provides compelling     and N.M. performed in vitro and in vivo experiments. All authors analyzed the data.
evidence that AT dysfunction alone, in this monogenic          T.G., S.B., J.W.T., R.P.S., H.D., and N.P. helped in drafting the manuscript. All
376 AT and Insulin Resistance in Alström Syndrome Diabetes Volume 70, February 2021
authors reviewed the draft and approved the final version. T.G. and V.M. are the 19. Sun K, Kusminski CM, Scherer PE. Adipose tissue remodeling and obesity. J
guarantors of this work and, as such, had full access to all the data in the study and Clin Invest 2011;121:2094–2101
take responsibility for the integrity of the data and the accuracy of the data 20. Rosen ED, Spiegelman BM. What we talk about when we talk about fat. Cell
analysis. 2014;156:20–44
21. Kahn CR, Wang G, Lee KY. Altered adipose tissue and adipocyte function
References in the pathogenesis of metabolic syndrome. J Clin Invest 2019;129:3990–
1. Marshall JD, Bronson RT, Collin GB, et al. New Alström syndrome phenotypes 4000
based on the evaluation of 182 cases. Arch Intern Med 2005;165:675–683 22. Rutkowski JM, Stern JH, Scherer PE. The cell biology of fat expansion. J Cell
2. Girard D, Petrovsky N. Alström syndrome: insights into the pathogenesis of Biol 2015;208:501–512
metabolic disorders. Nat Rev Endocrinol 2011;7:77–88 23. Spalding KL, Arner E, Westermark PO, et al. Dynamics of fat cell turnover in
3. Paisey RB, Smith J, Carey C, et al. Duration of diabetes predicts aortic pulse humans. Nature 2008;453:783–787
wave velocity and vascular events in Alström syndrome. J Clin Endocrinol Metab 24. Datta R, Podolsky MJ, Atabai K. Fat fibrosis: friend or foe? JCI Insight 2018;3:
2015;100:E1116–E1124 e122289
4. Gathercole LL, Hazlehurst JM, Armstrong MJ, et al. Advanced non-alcoholic 25. Romano S, Milan G, Veronese C, et al. Regulation of Alström syndrome gene
fatty liver disease and adipose tissue fibrosis in patients with Alström syndrome. expression during adipogenesis and its relationship with fat cell insulin sensitivity.
Liver Int 2016;36:1704–1712 Int J Mol Med 2008;21:731–736
5. Collin GB, Marshall JD, Ikeda A, et al. Mutations in ALMS1 cause obesity, type 26. Arsov T, Larter CZ, Nolan CJ, et al. Adaptive failure to high-fat diet char-
2 diabetes and neurosensory degeneration in Alström syndrome. Nat Genet 2002; acterizes steatohepatitis in Alms1 mutant mice. Biochem Biophys Res Commun
31:74–78 2006;342:1152–1159
6. Han JC, Reyes-Capo DP, Liu CY, et al. Comprehensive endocrine-metabolic 27. Ying W, Wollam J, Ofrecio JM, et al. Adipose tissue B2 cells promote insulin
evaluation of patients with Alström syndrome compared with BMI-matched resistance through leukotriene LTB4/LTB4R1 signaling. J Clin Invest 2017;127:
controls. J Clin Endocrinol Metab 2018;103:2707–2719 1019–1030
7. Paisey RB, Geberhiwot T, Waterson M, et al. Modification of severe insulin 28. Xu H, Barnes GT, Yang Q, et al. Chronic inflammation in fat plays a crucial role
resistant diabetes in response to lifestyle changes in Alström syndrome. Eur J Med in the development of obesity-related insulin resistance. J Clin Invest 2003;112:
Genet 2014;57:71–75 1821–1830
8. Semple RK, Savage DB, Cochran EK, Gorden P, O’Rahilly S. Genetic syn- 29. Abel ED, Peroni O, Kim JK, et al. Adipose-selective targeting of the GLUT4
dromes of severe insulin resistance. Endocr Rev 2011;32:498–514 gene impairs insulin action in muscle and liver. Nature 2001;409:729–733
9. Virtue S, Vidal-Puig A. Adipose tissue expandability, lipotoxicity and the 30. Minokoshi Y, Kahn CR, Kahn BB. Tissue-specific ablation of the GLUT4
Metabolic Syndrome–an allostatic perspective. Biochim Biophys Acta 2010;1801: glucose transporter or the insulin receptor challenges assumptions about insulin
338–349 action and glucose homeostasis. J Biol Chem 2003;278:33609–33612
10. Medina-Gomez G, Virtue S, Lelliott C, et al. The link between nutritional status 31. Herman MA, Peroni OD, Villoria J, et al. A novel ChREBP isoform in adipose
and insulin sensitivity is dependent on the adipocyte-specific peroxisome pro- tissue regulates systemic glucose metabolism. Nature 2012;484:333–338
liferator-activated receptor-gamma2 isoform. Diabetes 2005;54:1706–1716 32. Cao H, Gerhold K, Mayers JR, Wiest MM, Watkins SM, Hotamisligil GS.
11. Carobbio S, Pellegrinelli V, Vidal-Puig A. Adipose tissue function and ex- Identification of a lipokine, a lipid hormone linking adipose tissue to systemic
pandability as determinants of lipotoxicity and the metabolic syndrome. Adv Exp metabolism. Cell 2008;134:933–944
Med Biol 2017;960:161–196 33. Shulman GI. Ectopic fat in insulin resistance, dyslipidemia, and car-
12. Favaretto F, Milan G, Collin GB, et al. GLUT4 defects in adipose tissue are diometabolic disease. N Engl J Med 2014;371:2237–2238
early signs of metabolic alterations in Alms1GT/GT, a mouse model for obesity and 34. Baig S, Veeranna V, Bolton S, et al. Treatment with PBI-4050 in patients with
insulin resistance. PLoS One 2014;9:e109540 Alström syndrome: study protocol for a phase 2, single-centre, single-arm, open-
13. Huang-Doran I, Semple RK. Knockdown of the Alström syndrome-associated label trial. BMC Endocr Disord 18;18:88
gene Alms1 in 3T3-L1 preadipocytes impairs adipogenesis but has no effect on 35. Finegood DT, Bergman RN, Vranic M. Estimation of endogenous glucose
cell-autonomous insulin action. Int J Obes 2010;34:1554–1558 production during hyperinsulinemic-euglycemic glucose clamps. Comparison
14. Søndergaard E, Espinosa De Ycaza AE, Morgan-Bathke M, Jensen MD. How of unlabeled and labeled exogenous glucose infusates. Diabetes 1987;36:
to measure adipose tissue insulin sensitivity. J Clin Endocrinol Metab 2017;102: 914–924
1193–1199 36. Jentjens RL, Underwood K, Achten J, Currell K, Mann CH, Jeukendrup AE.
15. Ilias I, Apollonatou S, Nikitas N, et al. Microdialysis-assessed adipose tissue Exogenous carbohydrate oxidation rates are elevated after combined ingestion of
metabolism, circulating cytokines and outcome in critical illness. Metabolites glucose and fructose during exercise in the heat. J Appl Physiol (1985) 2006;100:
2018;8:62 807–816
16. Nikitas N, Kopterides P, Ilias I, et al. Elevated adipose tissue lactate to 37. Armstrong MJ, Hazlehurst JM, Hull D, et al. Abdominal subcutaneous adipose
pyruvate (L/P) ratio predicts poor outcome in critically ill patients with septic shock: tissue insulin resistance and lipolysis in patients with non-alcoholic steatohe-
a microdialysis study. Minerva Anestesiol 2013;79:1229–1237 patitis. Diabetes Obes Metab 2014;16:651–660
17. Stern JH, Rutkowski JM, Scherer PE. Adiponectin, leptin, and fatty acids in 38. Divoux A, Tordjman J, Lacasa D, et al. Fibrosis in human adipose tissue:
the maintenance of metabolic homeostasis through adipose tissue crosstalk. Cell composition, distribution, and link with lipid metabolism and fat mass loss. Di-
Metab 2016;23:770–784 abetes 2010;59:2817–2825
18. Arsov T, Silva DG, O’Bryan MK, et al. Fat aussie–a new Alström syndrome 39. Bel Lassen P, Charlotte F, Liu Y, et al. The FAT score, a fibrosis score of
mouse showing a critical role for ALMS1 in obesity, diabetes, and spermato- adipose tissue: predicting weight-loss outcome after gastric bypass. J Clin En-
genesis. Mol Endocrinol 2006;20:1610–1622 docrinol Metab 2017;102:2443–2453You can also read