Worsening of Oxidative Stress, DNA Damage, and Atherosclerotic Lesions in Aged LDLr-/- Mice after Consumption of Guarana Soft Drinks
←
→
Page content transcription
If your browser does not render page correctly, please read the page content below
Hindawi
Oxidative Medicine and Cellular Longevity
Volume 2019, Article ID 9042526, 13 pages
https://doi.org/10.1155/2019/9042526

Research Article
Worsening of Oxidative Stress, DNA Damage, and Atherosclerotic
Lesions in Aged LDLr-/- Mice after Consumption of Guarana
Soft Drinks

          Layla Aparecida Chisté,1 Beatriz Peters Pereira,1 Marcella Leite Porto,2
          Jairo Pinto de Oliveira,3 Arícia Leone Evangelista Monteiro de Assis,3
          Breno Valentim Nogueira,3 Silvana Santos Meyrelles ,4 Tadeu Uggere de Andrade,1
          Manuel Campos-Toimil ,5 Elisardo Corral Vasquez,1,4 Bianca Prandi Campagnaro ,1
          and Thiago Melo Costa Pereira 1,2,5
          1
            Pharmaceutical Sciences Graduate Program, Vila Velha University (UVV), Vila Velha, ES, Brazil
          2
            Federal Institute of Education, Science, and Technology (IFES), Vila Velha, ES, Brazil
          3
            Laboratory of Cellular Ultrastructure Carlos Alberto Redins (LUCCAR), Department of Morphology, Health Sciences Center,
            Federal University of Espirito Santo (UFES), Vitoria, ES, Brazil
          4
            Laboratory of Translational Physiology, Health Sciences Center, Federal University of Espirito Santo, Vitoria, ES, Brazil
          5
            Pharmacology of Chronic Diseases (CDPHARMA), Molecular Medicine and Chronic Diseases Research Center (CIMUS),
            University of Santiago de Compostela, Santiago de Compostela, Spain

          Correspondence should be addressed to Thiago Melo Costa Pereira; pereiratmc@gmail.com

          Received 8 February 2019; Accepted 12 May 2019; Published 10 June 2019

          Academic Editor: Silvana Hrelia

          Copyright © 2019 Layla Aparecida Chisté et al. This is an open access article distributed under the Creative Commons Attribution
          License, which permits unrestricted use, distribution, and reproduction in any medium, provided the original work is
          properly cited.

          Background. Excessive consumption of soft drinks (SD) has become a health problem worldwide due to its association with related
          cardiovascular diseases. We investigated the possible impacts associated with the consumption of Brazilian guarana (normal and
          zero) SD in dyslipidemic mice, thus mitigating potential clinical confounders such as poor-quality diet, lifestyle, body composition,
          and/or comorbidities. Methods. Sixteen-month-old LDLr-/- mice were divided into the following groups: (1) control; (2) GSD:
          normal guarana SD; and (3) Z-GSD: zero guarana SD. All were fed ad libitum, and blood pressure was measured noninvasively.
          After 8 weeks, aorta, blood, liver, and stomach samples were collected for histological and biochemical analyses. Results. Guarana
          soft drinks increased atherosclerosis (~60%) and were associated with hypercholesterolemia, hypertension, oxidative stress, DNA
          fragmentation, and apoptosis (~2-fold) of blood cells, besides presenting an increase in liver and gastric damage even in
          normoglycemia. Interestingly, Z-GSD did not cause the aforementioned changes, except in hemodynamic and renal parameters.
          Conclusions. Chronic administration of GSD is prooxidative, compromising the cardiovascular, gastric, and hepatic systems; the
          effects are due at least in part to free sugar consumption but not to guarana extract per se.

1. Introduction                                                          emerged to try to maintain the profitability of companies [3,
                                                                         4]. However, the intrinsic toxicity of these carbonated beverages
Excessive consumption of sugar-sweetened soft drinks (SD) has            is still controversial, reinforced by scarce experimental data and
become an alarming public health problem worldwide due to its            potential clinical confounders, such as poor-quality diet, life-
association with dyslipidemia, weight gain, diabetes type 2, and         style, body composition, and/or comorbidities [5–7]. Thus,
other related cardiovascular diseases [1, 2]. As an alternative, SD      experimental studies are needed to clarify the impact of long-
containing artificial sweeteners, considered as “healthier,” have         term consumption of SD and its consequences.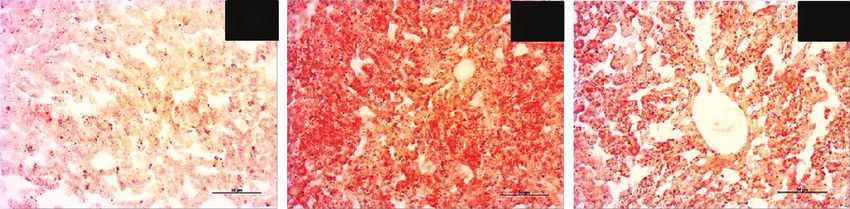
2                                                                                    Oxidative Medicine and Cellular Longevity

    Interestingly, only in the last decade have some experi-           Animals were bred and maintained in the animal care
mental studies described pathophysiological metabolic alter-       facility at the Experimental Monitoring Laboratory of Vila
ations after chronic exposure to sugar and artificially             Velha University (UVV) under standard conditions in indi-
sweetened SD, especially colas [2, 8–13]. However, these data      vidual acclimatized plastic cages at ~22°C and 60% humidity
may not be extrapolated to all SD, as specific substances are       under a 12-hour dark-light cycle. After 8 weeks of the diets,
present only in cola beverages (e.g., natural flavorings, color-    all animals were euthanized. All experimental procedures
ants, fluid extract of coca, and phosphoric acid), and it is nec-   were performed in accordance with the guidelines for the
essary to investigate other SD consumed in the world, such as      care and handling of laboratory animals as recommended
guarana SD. Guarana SD are made from extracts that have            by the National Institutes of Health (NIH), and all protocols
been obtained from the dried seeds of guarana (Paullinia           were approved by the Institutional Animal Care Committee
cupana H.B.K., Sapindaceae) in the Brazilian Amazonian             (Protocol # 375/2016).
region since 1921 [14, 15]. In the global market, guarana
SD, available in both sugar and artificially sweetened forms,       2.2. Blood Pressure Measurements. Systolic, diastolic, and
are among the fifteen highest selling SD in the world and           mean blood pressure (BP) were measured using plethysmog-
the second most consumed in Brazil [16]. Until now, the pos-       raphy of the tail (CODA Mouse Tail-Cuff Blood Pressure
sible consequences of long-term guarana consumption on             System, Kent Scientific Co., Connecticut, USA). Conscious
cardiovascular-metabolic diseases have not yet been evalu-         mice were placed individually in a restraint that allowed free
ated. Thus, this study reports for the first time the effects of     access to the tail and acclimated at 30°C for approximately
long-term consumption of regular guarana SD (sucrose-              15 min to ensure adequate blood flow to the tail. BP measure-
sweetened, GSD) and zero guarana SD (aspartame-acesul-             ments were performed in the morning in a quiet laboratory,
fame K-sweetened, Z-GSD) in the LDLr-/- mouse model.               and the mice were kept calm and handled by the same
    As rats are commonly resistant to the effects of overabun-      observer. Thirty-five measurements were recorded over
dant nutrients, genetically modified mice have been widely          15 min, and valid readings (at least 10) were averaged to
used in studies of cardiovascular-metabolic diseases, thus         determine the values for BP. All measurements were
expanding translational applications [17–21]. Among these,         recorded after a 3-day measurement acclimatization schedule
LDLr-/- mice show age-dependent susceptibility to concomi-         on the first and last day of the diet.
tant metabolic complications such as dyslipidemia, obesity,
and insulin resistance, mimicking humans with metabolic
syndrome [21–23].                                                  2.3. Oral Glucose Tolerance Test (OGTT). On the last day of
    In this context, the objective of this study was to investi-   the diet, basal glycemia was measured after 6 hours of total
gate possible biochemical and/or morphofunctional impacts          food and drink deprivation according to Andrikopoulos
associated with the consumption of GSD and Z-GSD in                et al. [24] and Ayala et al. [25]. Fasted mice were orally
aged dyslipidemic mice, mitigating the influence of poten-          administered 2 g of glucose/kg body weight, and blood glu-
tial confounders associated with SD consumption in                 cose was checked through tail blood extraction at regular
human subjects. These new results may help to fill the              intervals (0, 20, 40, 60, and 120 min) as graphically indicated.
data gaps to better inform scientists, patients, clinicians,       For this, animals were placed in a restraint, and the last 4 mm
and governments.                                                   of the tail was covered with clean gauze swabbed with lido-
                                                                   caine cream (4%). After 2 min, the anesthetic was removed
                                                                   with ethanol solution (70%), and the last 1 mm of the tip of
2. Methods                                                         the tail was then removed using sterilized surgical scissors.
                                                                   Then, the tail was gently massaged to ensure adequate blood
2.1. Animals and Experimental Design. Under a normal chow          flow. The total glucose response vs. time was evaluated by
diet provided ad libitum, female LDLr-/- mice, aged ~16            area under the curve (AUC) using Prism software (Prism
months old, were randomly separated into 3 groups with free        6.0, GraphPad Software Inc., San Diego, CA, USA).
access to one of the following drinks: water (control), regular
guarana SD (GSD) (sucrose-sweetened carbonated drink,              2.4. Clinical Biochemistry Parameters. The blood was col-
Guaraná Antarctica®, Brazil), or zero guarana SD (Z-GSD)           lected from the heart (right ventricle) of mice euthanized
(low-calorie aspartame–acesulfame K-sweetened carbonated           with sodium thiopental (100 mg/kg, i.p.). The blood was then
drink, Guaraná Antarctica Zero®, Brazil). The CO2 content          centrifuged at 4,000 g for 10 min. Then, the serum was sepa-
was completely removed from both guarana drinks by vigor-          rated and kept at −80°C until analysis. Serum concentrations
ous shaking using a magnetic bar and a stirring plate in a         of glucose, triglycerides, total plasma cholesterol, high-
container filled with the SD, after which the SD was offered         density lipoprotein (HDL), uric acid, urea, creatinine, C-
to the animals at room temperature. Body weight and food           reactive protein (CRP), and homocysteine and the activity
and drink consumption were measured weekly. Cumulative             of AST and ALT were determined by an automatic biochem-
food intake was calculated from the difference in weight            ical analyzer (AU 680, Olympus/Beckman Coulter, Munich,
before and after feeding. The average caloric food consump-        Germany) according to the manufacturers’ instructions.
tion was determined proportionally to food intake under the        Standard controls were run before each determination. The
classic nutritional parameters: carbohydrate (4 kcal/g), pro-      levels of non-HDL lipoprotein were calculated by subtracting
tein (4 kcal/g), and fat (9 kcal/g).                               HDL from total serum cholesterol.
Oxidative Medicine and Cellular Longevity                                                                                          3

    For the determination of enzymuria, as described by Fang      fluorescence was observed through a bandpass filter at
et al. [26], urine samples were collected before euthanasia for   585/42 nm. All the data are represented as the proportion
the measurement of glutamyl transpeptidase (GGT) and cre-         (%) of unstained/viable cells [29].
atinine. The samples were kept at −80°C before being                  Apoptotic blood cells were analyzed according to the pro-
assayed. All measurements were performed by standard lab-         tocol of our lab (Porto et al. [28] and Bôa et al. [29]). In brief,
oratory methods using the same automatic biochemical              cells were washed two times with PBS and adjusted to 0.5 mL
analyzer.                                                         with the binding buffer (500,000 cells). After the incubation
                                                                  with annexin V-FITC and PI (at 25°C in the dark for
2.5. Morphological Analysis of Aortic Lipid Deposition. The       15 min), the cells were detected using a FACSCanto II (BD
analysis of aortic lipid deposition was performed as previ-       Biosciences) flow cytometer. Apoptotic cells were identified
ously described [20, 21, 27]. After euthanasia and venous         by the positive staining for annexin V (Q2 + Q4).
blood collection, the animals were perfused with PBS-
formaldehyde (4%; pH 7.4; 0.1 mol/L) (Merck S.A., São             2.8. Advanced Oxidation Protein Products (AOPP) in Plasma,
Paulo, Brazil) via the left ventricle, and the thoracic cavity    Liver, and Stomach. The analyses of AOPP were performed
was opened. Briefly, en face aortic surfaces were opened, fixed     according to Witko-Sarsat et al. [30] and Coutinho et al.
in ethylene vinyl-acetate (EVA), and stained with Oil Red O       [21] using spectrophotometry with a microplate reader
(Sigma-Aldrich, St. Louis, MO) to identify neutral lipids;        (SpectraMax 190, Molecular Devices, Sunnyvale, CA, USA).
images were captured using a digital camera. Then, quantifi-       Forty microliters of plasma, liver, or stomach homogenate
cation was performed using imaging software (ImageJ 1.35d,        (diluted at 1: 10, 1: 30, and 1: 10, respectively) was solubi-
USA, public domain software from National Institutes of           lized 1: 5 in PBS or chloramine-T standard solutions (0 to
Health). Finally, the aortic lesion area was measured by a        100 μmol/L). Then, the samples were placed in each well of
“blind” investigator.                                             a 96-well microtiter plate (BD Discover Labware, Lincoln
                                                                  Park, NJ, USA), and 10 μL of 1.16 mol/L potassium iodide
2.6. Measurement of Oxidative Stress in the Blood (ROS            (KI, Sigma-Aldrich) was added, followed by the addition of
Production). ROS were quantified by flow cytometry analysis         20 μL of acetic acid. The absorbance of the reaction mixture
according to previous protocols [21, 28]. To estimate the bio-    was immediately read at 340 nm in a microplate reader
availability of intracellular superoxide (•O2-) and hydrogen      against a blank containing 200 μL of PBS, 10 μL of KI, and
peroxide (H2O2), dihydroethidium (DHE, 160 μM) and 2 ′            20 μL of acetic acid. Finally, the AOPP was determined when
,7 ′ -dichlorofluorescein diacetate (DCF, 20 mM) were,             the correlation coefficient was >0.95. The concentrations
respectively, added to a cell suspension (106 cells) and incu-    were presented in μmol/mg of total protein as determined
bated for 30 min (at 37°C) in the dark. In relation to highly     by the Bradford method [31] from dilutions of 1: 200 for
reactive oxygen species (hROS), such as peroxynitrite and         plasma, 1: 50 for liver, and 1: 4 for stomach for each
hydroxyl radicals, they were selectively measured using           measurement.
HPF        (2-[6-(4 ′ -hydroxy)phenoxy-3H-xanthen-3-on-9-yl]
benzoic acid). After washing the cells and resuspension in        2.9. Comet Assay. DNA damage was assessed using an alka-
PBS, the samples were analyzed using a flow cytometer              line comet assay (single-cell gel electrophoresis), based on
(FACSCanto II, BD Biosciences, San Jose, CA). All the data        Singh et al. [32] following minor adaptations established
were obtained through the FACSDiva software (BD Biosci-           from our laboratory [33, 34]. Briefly, histological slides were
ences, San Jose, CA), and histograms were generated using         precoated with 1.5% normal melting point agarose in water
the FCS Express software (De Novo Software, Thornhill,            in a water bath at 65°C. Subsequently, 10 μL of blood cell sus-
Ontario). For the measurement of the probes DHE, DCF,             pension was embedded in 110 μL of 1% low melting point
and HPF fluorescence, ten thousand events per sample were          agarose in PBS at 37°C and spread on agarose-precoated
explored for each analysis in monoplicate with excitation         slides using coverslips. The experiment was conducted in
occurring at 488 nm. For •O2- quantification, DHE fluores-          duplicate, i.e., two slides per animal. After gelling at 4°C for
cence was measured through a bandpass filter at an excitatio-      30 min, the coverslips were removed, and the slides were
n/emission wavelength of 585/42 nm, whereas DCF and HPF           incubated in freshly prepared lysis solution (in mmol/L:
fluorescence were analyzed through 530/30 nm. Finally, the         2500 NaCl, 100 EDTA, 10 Tris, and 34 N-lauroylsarcosine
results were reported as the median fluorescence intensity         sodium, adjusted to pH 10.0-10.5, using freshly added 1%
(MFI).                                                            Triton X-100 and 10% DMSO) for 1 hour at 4°C. Then, the
                                                                  slides were placed in an electrophoresis chamber filled with
2.7. Cell Viability. This protocol was analyzed through propi-    freshly prepared alkaline buffer (in mmol/L: 300 NaOH and
dium iodide (PI) as previously described [29]. A total of one     1 EDTA, pH >13) for 40 min at 4°C and conducted at
million cells were exposed to PI (2 μL) in the medium (5 min      300 mA and 32 V (1 V/cm) for 20 min. Afterwards, the slides
at 25°C in the dark).                                             were neutralized with a 0.4 mol/L Tris buffer (pH 7.5) for
    After the washing step with PBS, the blood cells were sub-    5 min (3 times) and finally dried with cold pure methanol
mitted to flow cytometry using a FACSCanto II Flow Cyt-            (-20°C) for fixation. Migration of DNA fragments towards
ometer (BD Biosciences). For viability analysis, samples          the anode creates a comet “tail,” visualized by staining with
were obtained in triplicate. A total of 10,000 events were ana-   ethidium bromide (20 μg/mL, Sigma-Aldrich). Immediately
lyzed for each experiment at 488 nm excitation whereas PI         afterwards, images were obtained at a magnification of 20x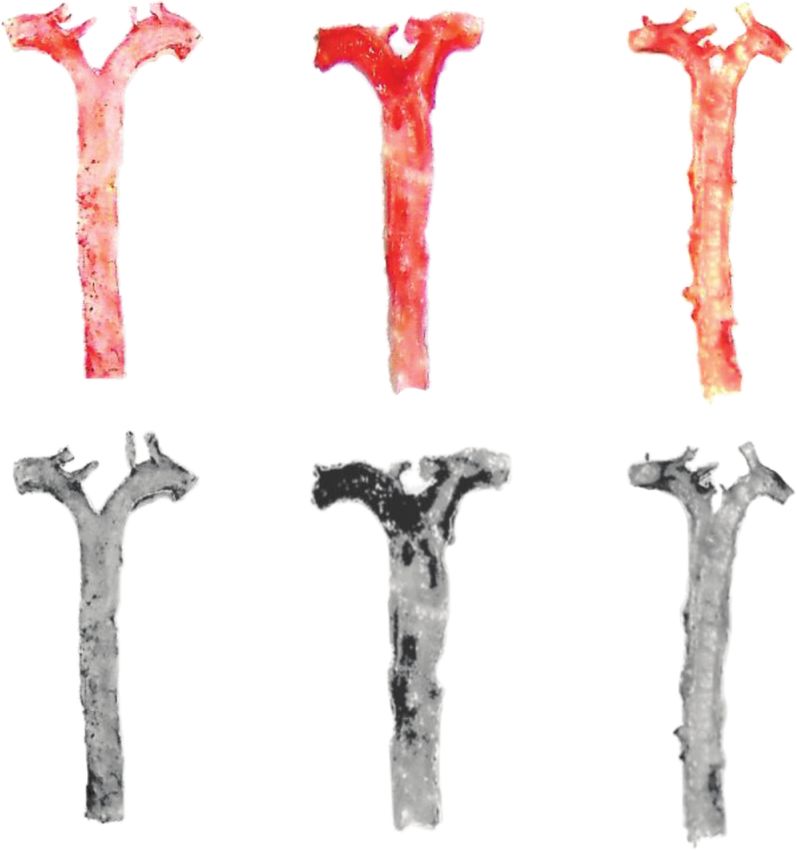
4 Oxidative Medicine and Cellular Longevity
5 20
⁎#
Average daily liquid consumed
Average daily food consumed # ⁎#
4 # # ⁎#
# # # # 15 ⁎# ⁎#
⁎ # ⁎# ⁎#
(mL/day)
3
(g/day)
10 ⁎#
2 ⁎ ⁎ ⁎
⁎ ⁎ ⁎
⁎
5
1
0 0
1 2 3 4 5 6 7 8 1 2 3 4 5 6 7 8
Weeks of study Weeks of study
Control Control
GSD GSD
Z-GSD Z-GSD
(a) (b)
20 30
18
Average kcal consumed
16 28
14
Body weight (g)
(kcal/day)
12 26
10
8 24
6
4 22
2
0 20
1 2 3 4 5 6 7 8 0 1 2 3 4 5 6 7 8
Weeks of study Weeks of study
Control Control
GSD GSD
Z-GSD Z-GSD
(c) (d)
Figure 1: Variation in nutrient intake and body weight of LDLr-/- mice after treatment with guarana soft drinks (normal and zero) for 8
consecutive weeks. (a) GSD mice consumed less food on average daily than control or Z-GSD-fed mice during 8 consecutive weeks
(∗ p < 0 05). (b) On the other hand, the GSD group presented polydipsia compared to the control (∗ p < 0 05) and Z-GSD groups (#p < 0 05).
(c) There were no differences in caloric intake between groups. (d) During this period, transient changes in body weight in response to
GSD or Z-GSD intake were not observed (two-way ANOVA with repeated measures).
using a fluorescence optical microscope (Eclipse TI, Nikon 2 days. The samples were cross-sectioned at 8 μm thicknesses
Instruments Inc., Melville, NY, USA) equipped with excita- in a -25°C cryostat (Jung CM1860; Leica, Wetzlar, Germany).
tion (420-490 nm) and barrier (520 nm) filters. The coded Sections were then mounted on gelatin-coated slides and col-
images were acquired using a CCD camera (Nikon) and were ored with Oil Red O or hematoxylin-eosin (Sigma-Aldrich).
analyzed with the CASP 98beta program (public domain). Finally, all images were captured using a camera (AxioCam
Among the several parameters provided by the CASP ERc 5 s, Carl Zeiss, Germany) coupled to an optical micro-
program, we used the percentage of DNA in the tail and scope (AX70, Olympus Corporation, Japan) with a 40x
the tail moment for analysis of DNA damage. The images objective and quantified using ImageJ software (NIH, USA).
of 50 randomly selected nucleoids from each sample were For each analysis, 10 distinct fields per animal were randomly
analyzed for each animal. During the image analysis, nucle- used to calculate the average percentage of the red area. All
oids without clearly identifiable heads, showing overlap, or analyses were performed by a “blind” researcher.
containing an artifact were excluded as a quality control
measure. 2.11. Statistical Analysis. All data are expressed as the mean
± SEM (standard error of the mean). For the statistical anal-
2.10. Liver and Stomach Histology. For detection of neutral ysis, two-way ANOVA was performed to analyze differences
lipids for morphometric analyses, the organs were isolated in biometric parameters and chow, liquid, and caloric intake.
and fixed in buffered formaldehyde solution (4%) for at least For the other analyses, we used one-way ANOVA followed
Oxidative Medicine and Cellular Longevity                                                                                                                 5

                                          400

                                                                                      ⁎

                                                                                                     10 mm
                  Lipid profile (mg/dL)   300

                                                                                          #
                                          200

                                          100

                                            0
                                                Control GSD Z-GSD           Control GSD Z-GSD
                                                TG
                                                Non-HDL
                                                HDL
                                                                 (a)                                                (b)

Figure 2: Plasma lipoprotein profiles in the three experimental groups of LDLr-/- mice showing that guarana soft drinks (GSD) increase non-
HDL cholesterol (~30%) and vascular lipid deposition (~60%) compared with the control and zero guarana soft drink (Z-GSD) diets. (a) Bar
graphs show the lipid profile between groups. (b) Representative aorta en face images of Oil Red O staining and their respective densitometry
analyses. Bar graph depicting average vascular lipid deposition areas. Values are presented as the mean ± SEM for n = 6‐9 animals per group.
∗
  p < 0 05 vs. the control group and #p < 0 05 vs. the GSD group (one-way ANOVA).

                                                 Table 1: Serum biochemical parameters in experimental groups of LDLr-/- mice.

                                                                                                    Groups
Parameters                                                                                                                                            p
                                                                         Control                    GSD                         Z-GSD
Glucose (mg/dL)                                                          206 ± 12                  211 ± 19                 196 ± 20               0.2856
                                                                                                                ∗                         ∗
OGTT (AUC0-120)                                                        28476 ± 2159           20170 ± 1962                20830 ± 1552             0.0154
Uric acid (mg/dL)                                                        2 8±0 2                   2 9±0 2                  3 0±0 7                0.9577
Blood urea (mg/dL)                                                        57 ± 4                    57 ± 4                      58 ± 4             0.9651
Serum creatinine (mg/dL)                                                0 20 ± 0 01               0 21 ± 0 02             0 33 ± 0 05∗ #           0.0082
GGT/urinary creatinine (100 U/g)                                        1 66 ± 0 34               2 00 ± 0 46              3 34 ± 0 46∗            0.0323
ALT (U/L)                                                                 37 ± 3                    41 ± 6                      39 ± 8             0.8829
AST (U/L)                                                                168 ± 29                  250 ± 52                 371 ± 134              0.2626
AST/ALT ratio                                                            3 9±0 5                   4 4±0 5                  4 5±0 6                0.7576
CRP (mg/L)                                                              0 29 ± 0 03               0 39 ± 0 09              0 31 ± 0 04             0.4656
                                                                                              ∗
Note: the values are presented as the mean ± SEM for n = 7 to 13 animals per group. p < 0 05 vs. the control group and p < 0 05 vs. GSD (guarana soft drink
                                                                                                                            #

group). Z-GSD: zero guarana soft drink.

by post hoc Tukey’s test using Prism software (Prism 6.0,                                 3.2. Lipid Profile and En Face Analysis. Figure 2 represents
GraphPad Software Inc., San Diego, CA, USA). A value of                                   the serum lipid profile and lipid deposition in the aortas of
p < 0 05 was considered statistically significant.                                         all groups studied. We observed an augmentation in non-
                                                                                          HDL cholesterol in GSD mice (252 ± 16 mg/dL, n = 10, p <
3. Results                                                                                0 05) compared with the control and Z-GSD groups
                                                                                          (168 ± 8, n = 9, and 174 ± 11 mg/dL, n = 10, respectively)
3.1. Biometric Parameters and Chow, Liquid, and Caloric                                   without a difference in the level of HDL and triglycerides
Intake. Figure 1 summarizes the general parameters of food                                (Figure 2(a)). Figure 2(b) summarizes the results of typical
and liquid intake, caloric consumption, and body weight dur-                              analyses of the aorta, showing that GSD mice had signifi-
ing the 8-week follow-up period. The GSD group exhibited                                  cantly increased lipid deposition, by ~60% (p < 0 05), com-
hypophagia (~50%, p < 0 05, Figure 1(a)) and polydipsia                                   pared with the control group (3 5 ± 0 5%). On the other
(~2.5-fold, p < 0 05, Figure 1(b)) when compared to the con-                              hand, in the aortas obtained from Z-GSD mice, the lipid
trol and Z-GSD groups, without a difference in caloric con-                                deposition was similar to that under control conditions
sumption and body weight between groups.                                                  (4 4 ± 0 4%, p > 0 05).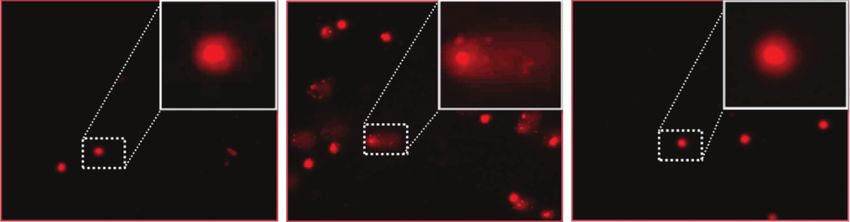
6                                                                                    Oxidative Medicine and Cellular Longevity

                     20             ⁎         ⁎       ⁎             H2O2: 1, 038 ± 48), producing levels similar to that in the
                                                                    control group (H2O2: 1, 140 ± 41, p > 0 05). In relation to
                                         ⁎
                                                           ⁎
                                                                    hROS, we did not detect differences between groups (control:
                     10                                             831 ± 41, GSD: 897 ± 30, Z-GSD: 792 ± 29 a u , p > 0 05).
    Changes in BP

                                                                    Concerning other serum biomarkers of oxidative stress, we
      (mmHg)

                                                                    demonstrated that the GSD group had increased plasma
                      0
                                                                    homocysteine (~3-fold, Figure 4(b)) and AOPP levels
                                                                    (~2.5-fold, Figure 4(c)) compared to the Z-GSD group
                    −10                                             (p < 0 05).
                                                                    3.6. Genotoxic Effect. The assessment of genotoxic stress by
                    −20                                             the comet assay indicated greater DNA damage in the
                          Control       GSD        Z-GSD            GSD group (8 9 ± 0 9%, p < 0 05) than in control mice
                          MBP                                       (6 2 ± 0 5%), and this damage was significantly reduced
                          SBP                                       in the Z-GSD group (4 5 ± 0 6%) (Figures 4(d) and 4(e)).
                          DBP                                       Another parameter measured was the comet tail moment,
                                                                    the product of the tail length and the portion of total DNA
Figure 3: Variations in hemodynamic parameters of mean, systolic,   in the tail [34, 39]. This analysis demonstrated an increase
and diastolic blood pressure (MBP, SBP, and DBP, respectively)      in DNA fragmentation in the GSD group (2 6 ± 0 35 a u ,
among 3 experimental groups of LDLr-/- mice. The graph
                                                                    p < 0 05) compared with the control and Z-GSD mice
demonstrates that both normal (GSD) and zero (Z-GSD) guarana
soft drinks increase the absolute BP over 8 consecutive weeks.
                                                                    (1 2 ± 0 2 and 0 6 ± 0 2 a u , respectively) (Figure 4(f)).
Values are presented as the mean ± SEM for n = 3‐5 animals per      3.7. Cell Viability and Apoptosis in Blood Cells. Apoptosis was
group. ∗ p < 0 05 vs. the control group (one-way ANOVA).
                                                                    investigated in the same blood cells using PI and annexin V
                                                                    staining and flow cytometry analysis. Figure 5(a) shows typical
                                                                    dot plots for each group. Our results in Figure 5(b) indicate
3.3. Other Serum Biochemical Parameters. Table 1 shows the
                                                                    that GSD increased the number of apoptotic cells (Q2 + Q4)
results of other relevant biochemical analyses of the 3 groups
                                                                    by 80% (p < 0 05) compared with that of control mice
studied after 8 weeks of the diets. Interestingly, we
                                                                    (5 1 ± 0 7). On the other hand, the Z-GSD group showed
highlighted that the nonfasting glycemic level was not differ-
                                                                    a profile similar to that of the control mice (3 3 ± 1 2%,
ent between the groups. Surprisingly, in the OGTT, the GSD
                                                                    p < 0 05). Concerning cell viability (Figure 5(c)), the GSD
and Z-GSD groups showed augmented sensitivity to insulin
                                                                    group showed impaired cell viability (86 ± 1 6%) compared
(~30%) compared with control mice (p < 0 05). In parallel,
                                                                    with that of the other groups (control: 91 ± 0 7% and Z-GSD:
the renal biomarkers worsened due to Z-GSD supplementa-
                                                                    95 ± 1 8%, p < 0 05).
tion: serum creatinine increased significantly (~65%, p <
0 05) in the Z-GSD group compared to the control and                3.8. Oxidized Protein and Histological Analysis in Liver and
GSD groups. Moreover, the GGT/urinary creatinine was also           Stomach. We also investigated the impact of chronic guarana
higher in the Z-GSD group than in the control and GSD               consumption on oxidative damage in the liver and stomach
groups (~100 and 65%, respectively, p < 0 05). No differences        of LDLr-/- mice. The levels of oxidized proteins were
were observed between hepatic (ALT and AST) and nonspe-             increased in the GSD group compared to control animals,
cific inflammatory (CRP) biomarkers.                                  in both the liver (25%, p < 0 05, Figure 6(a)) and stomach
                                                                    (75%, p < 0 05, Figure 6(c)). Interestingly, the Z-GSD group
3.4. Blood Pressure Determination. As shown in Figure 3,            and the control mice had similar profiles (p > 0 05) in both
the GSD group exhibited significant increases in mean, sys-          organs (Figures 6(a) and 6(c)). Moreover, the GSD group
tolic, and diastolic BP (+19, 22, and 24 mmHg, respectively,        showed greater lipid deposition (120%, p < 0 05) in liver
p < 0 05) compared with the control group. On the other             cells (Figure 6(b)) compared with that of the control group.
hand, the Z-GSD mice showed increases in only systolic              The Z-GSD group showed no difference compared to the
and diastolic BP (18 and 17 mmHg, respectively, p < 0 05).          other groups (p > 0 05). In regard to stomach damage
No change in heart rate was observed between groups (data           (Figure 6(d)), we observed that only the GSD group devel-
not shown).                                                         oped atrophy and degeneration in gastric glands.

3.5. Oxidative Stress Biomarkers in Blood Cells. Based on pre-      4. Discussion
vious data showing that high levels of ROS are crucial for ath-
erosclerosis [19, 21, 35–37] and hypertension [38], we              In the present study, we showed for the first time that long-
evaluated the intracellular ROS levels in white blood cells in      term consumption of the regular classic guarana beverage
all groups studied. As illustrated in Figure 4(a), we showed        (GSD) by adult dyslipidemic mice resulted in an increase in
that GSD supplementation increased •O2- production by               hypercholesterolemia, aortic lipid deposition, BP, oxidative
~50% (2, 333 ± 135 a u ) compared to that in the control            stress, and DNA fragmentation, as well as apoptosis in
mice (•O2-: 1, 544 ± 85 a u , p < 0 05). Interestingly, Z-GSD       mononuclear cells, and greater hepatic and gastric injuries
prevented the overproduction of ROS (•O2-: 1, 388 ± 79,             (even without weight gain or hyperglycemia). Interestingly,
Oxidative Medicine and Cellular Longevity                                                                                                                                             7

                                 5000                                                                        8
                                                                                                                                        ⁎

                                                                                    Homocysteine (휇mol/L)
          ROS production         4000                               OONO−
                                                                                                             6
                                                    OONO−            H2O2
            (median)
                                 3000                                 ⁎     OONO−
                                                                              #
                                                     H2O2                    H2O2                            4
                                 2000                                                                                                                 #
                                                                              #
                                 1000                                •O2−                                    2
                                                     •O2−                    •O2−
                                               0                                                             0
                                                    Control          GSD    Z-GSD                                    Control       GSD          Z-GSD
                                                    HPF
                                                    DCF
                                                    DHE
                                                              (a)                                                                (b)
                 (휇M cloramin-T/mg protein)

                                                6
                                                                                                                 Control                        GSD             Z-GSD
                                                4
                            AOPP

                                                                              #
                                                2

                                                0
                                                    Control          GSD    Z-GSD
                                                               (c)                                                                              (d)
                                               15                                                                4
                                                                                                                                            ⁎
                                                                      ⁎                                          3
                DNA damage
                (% in the tail)

                                                                                    Tail moment

                                               10
                                                                                        (a.u)

                                                                                                                 2
                                                                              #
                                                5
                                                                                                                 1                                        #

                                                0                                                                0
                                                    Control          GSD    Z-GSD                                      Control          GSD           Z-GSD
                                                               (e)                                                                (f)

Figure 4: ROS overproduction and genotoxic effects are associated with normal guarana soft drink (GSD) but not in zero guarana soft drink
(Z-GSD) intake. (a) ROS production was assessed by DHE, DCF, and HPF and measured by flow cytometry. (b) Quantification of
homocysteine and (c) protein oxidation (AOPP) in the serum of the 3 groups. (d) Detection of DNA damage in blood is assessed by an
alkaline comet assay. Typical comets show greater DNA fragmentation only in the GSD group compared to that in the control group,
which contrasts with the Z-GSD group, quantified and represented in the graph in (e). Bar graph in (f) shows the percentage of DNA tail
moments (~2-fold higher in the GSD group). Values are presented as the mean ± SEM for n = 6‐7 animals per group. ∗ p < 0 05 vs. the
control group and #p < 0 05 vs. the GSD group (one-way ANOVA).

the zero guarana soft drinks (Z-GSD) did not cause most of                                                             consumption of nonnutritive sweeteners may increase appe-
the described negative effects, except those on hemodynamic                                                             tite [10, 44, 45], our results using zero guarana SD do not
and renal parameters.                                                                                                  show modified food intake or body weight. Therefore, our
     First, although several clinical studies have indicated a                                                         data reinforce recent experimental findings using diet cola,
positive association between sugar-sweetened beverage con-                                                             which had similar results [10–12], and suggest that an
sumption and the risk of obesity [40–42], our results, as well                                                         increase in food consumption associated with aspartame-
as other related experimental findings [1, 12, 43], have not                                                            sweetened drinks in humans might be related to psychologi-
confirmed the clinical hypothesis that the regular consump-                                                             cal influences (eating in excess) that apparently did not occur
tion of sugar-sweetened beverages could induce weight gain.                                                            in our experimental animals.
It is important to emphasize that, contrary to rational human                                                               It is well documented that consumption of SD is linked to
behavior, the animals exposed to classic guarana halved their                                                          cardiometabolic risk factors [46–48]. However, the parame-
consumption of food, thereby normalizing their caloric                                                                 ters of the traditional serum biochemical profile (e.g., glyce-
intake, as previously described by Otero-Losada et al. [12],                                                           mia, triglycerides, and cholesterol) under SD exposure are
who investigated cola beverage consumption in the same                                                                 still conflicting in experimental [1, 10, 12] and clinical studies
exposure period. Though some researchers suggest that                                                                  [45–51]. Our results showed that GSD, but not Z-GSD,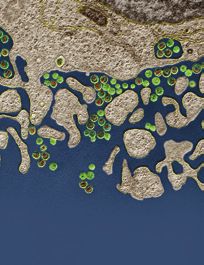
8                                                                                                                                       Oxidative Medicine and Cellular Longevity

                                                       Control                                   GSD                                                         Z-GSD

                                     105                                     105                                                              105

                                     104                                     104                                                              104
              PI

                                                                       PI

                                                                                                                                        PI
                                     103                                     103                                                              103

                                     102                                     102                                                              102
                                    −102                                    −102                                                             −102

                                           −102 102 103    104 105                 −102 102   103   104 105                                         −102 102  103   104 105
                                                 Annexin-V/FITC                           Annexin-V/FITC                                                  Annexin-V/FITC
                                                                                          (a)
                                    100                                                                                  15
                                                                                   #
                                                                                                                                                      ⁎

                                                                                                Apoptosis (% of cells)
                                     95
           Viability (% of cells)

                                                                                                                         10

                                     90
                                                                  ⁎
                                                                                                                          5                                          #
                                     85

                                     80                                                                                   0
                                             Control             GSD          Z-GSD                                           Control                GSD          Z-GSD
                                                                                          (b)

Figure 5: Normal (GSD) but not zero (Z-GSD) guarana soft drink intake increases apoptosis and compromises cell viability in blood cells. (a)
Dot plots showing the apoptosis ratios from the control, GSD, and Z-GSD groups (n = 5). (b) The apoptosis and cell viability ratios were
determined using propidium iodide (PI) and FITC-annexin V. The Q2 + Q4 quadrants represent the cells that are in apoptosis. Note the
remarkable decrease in the number of apoptotic cells (Q2 + Q4) in the Z-GSD group. Values are presented as the mean ± SEM. ∗ p < 0 05
vs. the control group and #p < 0 05 vs. the GSD group (one-way ANOVA).

increased only non-HDL cholesterol, maintaining triglycer-                                         exposure to carbohydrate-rich beverages, verified by hemo-
ide and glycemic control. A possible explanation for the                                           dynamic parameters, redox homeostasis, and cellular/tissue
euglycemic control is that drinks containing a moderate                                            losses, as detected in our study.
amount of caffeine [1, 8, 52] and/or acesulfame K [12, 53]                                              Concerning hemodynamic parameters, several reports
might stimulate insulin secretion and/or upregulate glucose                                        have shown that hypertension is a major contributor to the
transporters, which is partially corroborated by the improve-                                      development of cardiovascular diseases, which are associated
ment of the OGTT profile detected in our study. Despite the                                         with endothelial dysfunction and altered contractility [27, 56,
discrete metabolic impact observed, we demonstrated several                                        57]. For the first time, our study demonstrated an increase in
consequences of long-term nonzero guarana consumption,                                             BP due to chronic guarana SD consumption, which could be
described as follows.                                                                              involved in the development of hypertension. Although we
    The exact influence of chronic SD consumption on                                                and others have not yet explored the vascular reactivity of
atherosclerosis is poorly known. Until now, experimental                                           animals exposed to classic SD, some studies have previously
data have been collected only for cola beverages [12, 54].                                         shown abnormal reactivity in animals fed a high fructose diet
Therefore, the proatherogenic effect observed with GSD                                              [58, 59], justified at least in part by an increase in angiotensin
(but not with Z-GSD) opens new perspectives about this                                             II and downregulation of eNOS [60]. On account of the pres-
issue, justified by the following points: (1) it is possible to                                     ent data, we suggest that other substances may be involved in
induce significant aortic lipid deposition in aged female                                           the potential development of hypertension because the group
LDLr-/- mice under only sugar-sweetened beverage exposure                                          treated with an artificially sweetened drink (Z-GSD) also
without a high-fat diet, which opposes the classical method-                                       showed a rise in BP. Among them, we cannot discard the role
ology [21, 55]; (2) the atherogenesis might be more related                                        of aspartame (which contains 50% phenylalanine), a relevant
to the excessive exposure to free sugars than other sub-                                           precursor of highly vasoactive substances (i.e., dopamine,
stances (nonnutritive sweeteners) in these SD, as observed                                         noradrenaline, and adrenaline) [61], and caffeine, an
in a study using cola beverages that detected atherogenesis                                        enhancer of adrenergic activity [10].
after exposure to even light cola drinks [54]; and (3) glycemia                                        It is well established that oxidative stress is a central phe-
per se may not be sufficient to evaluate the impact of chronic                                       nomenon in the progression of cardiovascular [19, 21, 23,
Oxidative Medicine and Cellular Longevity 9
Liver Stomach
(휇M cloramin-T/mg protein)
(휇M cloramin-T/mg protein)
200 200
⁎
⁎
150 150
AOPP
AOPP
#
100 100 #
50 50
0 0
Control GSD Z-GSD Control GSD Z-GSD
(a) (c)
C G GZ
C G GZ
3
⁎
(X-fold variation)
Lipid deposition
2
1 (d)
0
Control GSD Z-GSD
(b)
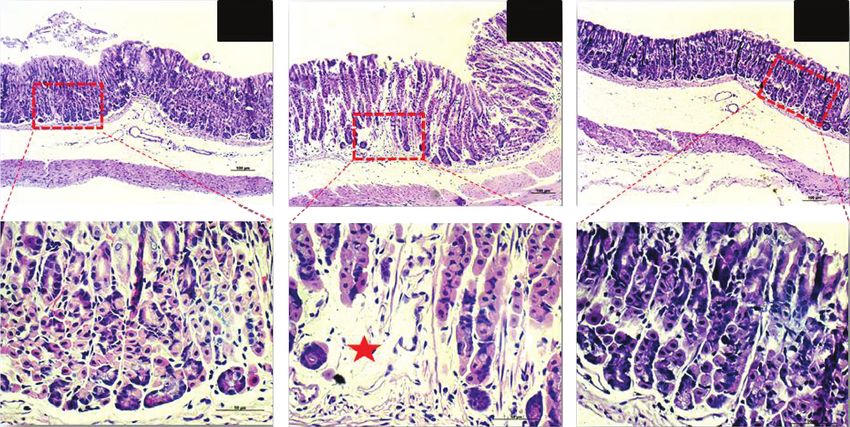
Figure 6: Chronic normal (GSD) but not zero (Z-GSD) guarana soft drink intake increases liver and stomach damage. (a) GSD intake
augments advanced oxidation protein products (AOPP) and (b) lipid deposition in liver, illustrated through representative images in the
top panel. (c) Similarly, GSD increases AOPP formation in the stomach. (d) Only the GSD group developed atrophy and degeneration in
gastric glands. The values are presented as the mean ± SEM for n = 4 − 6 animals per group. ∗ p < 0 05 vs. the control group and #p < 0 05
vs. the GSD group.
27, 35, 62] and other age-related diseases [63, 64]. At the same Until the present study, there was no evidence that gua-
time, several studies have shown that hyperglycemia increases rana SD could contribute to liver or gastric damage. In paral-
ROS production mainly via mitochondrial dysfunction and lel, only a few studies have demonstrated a potential risk of
endoplasmic reticulum stress [28, 65–67]. Therefore, we hepatotoxicity under chronic exposure to aspartame [76,
decided to investigate the impact of ROS generation and pos- 77] or acesulfame K [12]. Thus, our data clarify this question
sible cell/tissue oxidative damage under exposure to guarana by demonstrating that the excessive consumption of carbo-
drinks. For the first time, we showed that classic guarana soft hydrates (but not guarana per se) is the main contributor to
drinks (GSD) present a prooxidative effect by both direct (flow steatosis and oxidative stress in the liver. These data are
cytometry) and indirect (homocysteine, AOPP, and DNA supported by previous research showing that fructose and
fragmentation) detection and that all these factors may influ- glucose are important inducers of de novo lipogenesis and
ence, at least in part, the increase in BP and the lipid deposi- ROS production [78, 79]. A similar pattern of impacts was
tion observed in our study [35, 68–70]. Additionally, we observed for the stomach, revealing that the greatest damage
previously showed that oxidative damage had major conse- occurs in relation to carbohydrates (fructose, glucose, and
quences, such as elevation of apoptosis and decrease of blood sucrose) rather than to artificial sweeteners (acesulfame K
cell viability, whose mechanisms may be through established or aspartame). It is important to emphasize that all damages
pathways (e.g., chromosomal cleavage, telomere shortening, previously described were generated in normoglycemic con-
and/or activation of caspases) [71–73]. Moreover, we cannot ditions, even in the case of chronic exposure to classic SD
exclude the possibility that hyperhomocysteinemia observed (rich in carbohydrates). Thus, it is suggested that before clas-
under exposure to guarana might be another direct contribu- sical metabolic alterations are observed clinically, several
tor to hypertension [64], DNA damage, and apoptosis activa- types of oxidative damage by SD may occur. This should be
tion, as observed by others [74, 75]. considered an alert relevant to public health policies.
10                                                                                    Oxidative Medicine and Cellular Longevity

    Last, but not least, the only organ that showed greater         SD:        Soft drinks
damage from zero guarana SD was the kidney, with possible           SEM:       Standard error of the mean
loss of glomerular filtration and tubular injury, demonstrated       UVV:       Vila Velha University.
by creatininemia and increased enzymuria, respectively,
according to previous reports [26, 80]. In this case, we suggest    Data Availability
that the renal damage might have been generated by
aspartame. Recently, some studies have demonstrated that            All data used to support the findings of this study are
long-term intake of aspartame may develop oxidative                 included within the article.
stress in the rat kidney through the dysregulation of gluta-
thione homeostasis [81]. However, future investigations             Ethical Approval
will be necessary to explore the impact of acesulfame K
or other substances.                                                All experimental procedures were performed in accordance
    Some limitations of our investigation should be consid-         with the guidelines for the care and handling of laboratory
ered. First, the lack of monitoring the estrous cycle in adult      animals as recommended by the National Institutes of Health
female mice does not allow us to speculate about the influ-          (NIH), and all protocols were approved by the Institutional
ence of sex hormones on the present results. Second, since          Animal Care Committee (Protocol # 375/2016).
this study with SD was carried out for the first time with
LDLr-/- mice, the comparison with the ApoE-/- mouse model           Conflicts of Interest
would not be appropriate. Third, we do not yet know if all
parameters would be normalized after washout for months,            The authors disclosed no conflict of interest.
indicating the need for more investigations to confirm or rule
out the existence of nonreversible, chronic effects after pro-       Authors’ Contributions
longed consumption of these beverages.
                                                                    LAC contributed to the design of the study and carried out
                                                                    the experimental analysis, acquisition of data, and interpreta-
5. Conclusions                                                      tion of the data. BPP contributed to the experimental analysis
                                                                    and acquisition of data. MLP and SSM made it possible to
Our results demonstrate that long-term administration of the
                                                                    perform flow cytometry analysis for the evaluation of ROS
classic guarana beverage causes adverse prooxidant outcomes
                                                                    and apoptosis/cell viability. TUA participated in the design
at serum, vascular, hepatic, and gastric levels, at least in part
                                                                    of the study and supervised the care and treatment of the
due to free sugar exposure but not to guarana extract per se.
                                                                    groups of animals. JPO, ALEMA, and BVN carried out the
This experimental investigation may provide a basis for fur-
                                                                    experimental histological analysis and acquisition of data.
ther experimental and clinical studies to better explore the
                                                                    MCT participated in the critical revision of the manuscript.
association between the consumption of soft drinks and met-
                                                                    ECV made it possible to perform flow cytometry analysis
abolic diseases.
                                                                    and participated in the critical revision of the manuscript.
                                                                    BPC contributed to the comet assay analysis and critical revi-
Abbreviations                                                       sion of the manuscript. TMCP was the supervisor of the first
                                                                    author, and he designed the study, carried out the experi-
ALT:       Alanine aminotransferase
                                                                    mental analysis, and drafted and critically reviewed the man-
ANOVA:     Analysis of variance
                                                                    uscript. All authors read and approved the final version of the
AOPP:      Advanced oxidation protein products
                                                                    manuscript. All authors consented to the publication of the
AST:       Aspartate aminotransferase
                                                                    manuscript.
AUC:       Area under the curve
BP:        Blood pressure
FITC:      Fluorescein isothiocyanate                               Acknowledgments
GGT:       Glutamyl transpeptidase                                  The authors are grateful to the Tommasi Laboratory for use
GSD:       Normal/classic guarana soft drink                        of their facilities. The authors also acknowledge the support
Z-GSD:     Zero guarana soft drink                                  provided by the National Council for Scientific and Techno-
HDL:       High-density lipoprotein                                 logical Development (Grants CNPq-445080/2014-0 and
i.p.:      Intraperitoneal                                          CNPq-445736/2014-3) and the State Agency for the Devel-
kcal:      Kilocalories                                             opment of Science and Technology (Grants FAPES-
LDLr-/-:   Low-density lipoprotein receptor knockout mice           239/2016 and FAPES-0606/2015).
MFI:       Median fluorescence intensity
min:       Minutes                                                  References
NIH:       National Institutes of Health
OGTT:      Oral glucose tolerance test                               [1] H. Jürgens, W. Haass, T. R. Castañeda et al., “Consuming
PBS:       Phosphate-buffered saline                                      fructose-sweetened beverages increases body adiposity in
CRP:       C-reactive protein                                            mice,” Obesity Research, vol. 13, no. 7, pp. 1146–1156, 2005.
PI:        Propidium iodide                                          [2] A. Narain, C. S. Kwok, and M. A. Mamas, “Soft drink intake
ROS:       Reactive oxygen species                                       and the risk of metabolic syndrome: a systematic review and
Oxidative Medicine and Cellular Longevity 11
meta-analysis,” International Journal of Clinical Practice, [18] S. S. Meyrelles, V. A. Peotta, T. M. Pereira, and E. C. Vasquez,
vol. 71, no. 2, 2017. “Endothelial dysfunction in the apolipoprotein E-deficient
[3] M. A. Pereira, “Sugar-sweetened and artificially-sweetened mouse: insights into the influence of diet, gender and aging,”
beverages in relation to obesity risk,” Advances in Nutrition, Lipids in Health and Disease, vol. 10, no. 1, p. 211, 2011.
vol. 5, no. 6, pp. 797–808, 2014. [19] E. C. Vasquez, V. A. Peotta, A. L. Gava, T. M. C. Pereira, and
[4] L. D. Silver, S. W. Ng, S. Ryan-Ibarra et al., “Changes in prices, S. S. Meyrelles, “Cardiac and vascular phenotypes in the apoli-
sales, consumer spending, and beverage consumption one year poprotein E-deficient mouse,” Journal of Biomedical Science,
after a tax on sugar-sweetened beverages in Berkeley, California, vol. 19, no. 1, p. 22, 2012.
US: a before-and-after study,” PLoS Medicine, vol. 14, no. 4, [20] A. F. Santanna, P. F. Filete, E. M. Lima et al., “Chronic admin-
article e1002283, 2017. istration of the soluble, nonbacterial fraction of kefir attenuates
[5] M. Otero-Losada, G. Cao, J. González et al., “Functional and lipid deposition in LDLr (-/-) mice,” Nutrition, vol. 35, no. 1,
morphological changes in endocrine pancreas following cola pp. 100–105, 2017.
drink consumption in rats,” PLoS One, vol. 10, no. 3, article [21] P. N. Coutinho, B. P. Pereira, A. C. Hertel Pereira et al.,
e0118700, 2015. “Chronic administration of antioxidant resin from Virola olei-
[6] L. R. Vartanian, M. B. Schwartz, and K. D. Brownell, “Effects of fera attenuates atherogenesis in LDLr (-/-) mice,” Journal of
soft drink consumption on nutrition and health: a systematic Ethnopharmacology, vol. 206, no. 1, pp. 65–72, 2017.
review and meta-analysis,” American Journal of Public Health, [22] K. Hartvigsen, C. J. Binder, L. F. Hansen et al., “A diet-induced
vol. 97, no. 4, pp. 667–675, 2007. hypercholesterolemic murine model to study atherogenesis
[7] E. Mantzari, G. J. Hollands, R. Pechey, S. Jebb, and T. M. without obesity and metabolic syndrome,” Arteriosclerosis,
Marteau, “Impact of bottle size on in-home consumption of Thrombosis, and Vascular Biology, vol. 27, no. 4, pp. 878–
sugar-sweetened beverages: a feasibility and acceptability 885, 2007.
study,” BMC Public Health, vol. 17, no. 1, p. 304, 2017. [23] Y. T. Lee, H. Y. Lin, Y. W. F. Chan et al., “Mouse models of ath-
[8] P. Celec, R. Pálffy, R. Gardlík et al., “Renal and metabolic erosclerosis: a historical perspective and recent advances,”
effects of three months of decarbonated cola beverages in rats,” Lipids in Health and Disease, vol. 16, no. 1, p. 12, 2017.
Experimental Biology and Medicine, vol. 235, no. 11, pp. 1321– [24] S. Andrikopoulos, A. R. Blair, N. Deluca, B. C. Fam, and
1327, 2010. J. Proietto, “Evaluating the glucose tolerance test in mice,”
[9] J. D. Botezelli, R. A. Dalia, I. M. Reis et al., “Chronic consump- American Journal of Physiology-Endocrinology and Metabo-
tion of fructose rich soft drinks alters tissue lipids of rats,” Dia- lism, vol. 295, no. 6, pp. E1323–E1332, 2008.
betology & Metabolic Syndrome, vol. 2, no. 1, 2010. [25] J. E. Ayala, V. T. Samuel, G. J. Morton et al., “Standard operat-
[10] J. Milei, M. Otero Losada, H. Gómez Llambí et al., “Chronic ing procedures for describing and performing metabolic tests
cola drinking induces metabolic and cardiac alterations in of glucose homeostasis in mice,” Disease Models & Mecha-
rats,” World Journal of Cardiology, vol. 3, no. 4, pp. 111–116, nisms, vol. 3, no. 9-10, pp. 525–534, 2010.
2011. [26] H. C. Fang, P. T. Lee, P. J. Lu et al., “Mechanisms of star fruit-
[11] M. E. Otero-Losada, D. R. Grana, A. Müller, G. Ottaviano, induced acute renal failure,” Food and Chemical Toxicology,
G. Ambrosio, and J. Milei, “Lipid profile and plasma antioxi- vol. 46, no. 5, pp. 1744–1752, 2008.
dant status in sweet carbonated beverage-induced metabolic [27] M. Leal, C. Balarini, A. Dias et al., “Mechanisms of enhanced
syndrome in rat,” International Journal of Cardiology, vasoconstriction in the mouse model of atherosclerosis: the
vol. 146, no. 1, pp. 106–109, 2011. beneficial effects of sildenafil,” Current Pharmaceutical Bio-
[12] M. E. Otero-Losada, S. Mc Loughlin, G. Rodríguez-Granillo technology, vol. 16, no. 6, pp. 517–530, 2015.
et al., “Metabolic disturbances and worsening of atheroscle- [28] M. L. Porto, L. M. Lírio, A. T. Dias et al., “Increased oxidative
rotic lesions in ApoE-/- mice after cola beverages drinking,” stress and apoptosis in peripheral blood mononuclear cells of
Cardiovascular Diabetology, vol. 12, no. 1, 2013. fructose-fed rats,” Toxicology In Vitro, vol. 29, no. 8,
[13] G. Cao, J. González, A. Müller et al., “Beneficial effect of mod- pp. 1977–1981, 2015.
erate exercise in kidney of rat after chronic consumption of [29] I. S. F. Bôa, M. L. Porto, A. C. H. Pereira et al., “Resin from Vir-
cola drinks,” PLoS One, vol. 11, no. 3, p. e0152461, 2016. ola oleifera protects against radiocontrast-induced nephropa-
[14] Brazilian Amazon Consortium for Genomic Research (REAL- thy in mice,” PLoS One, vol. 10, no. 12, p. e0144329, 2015.
GENE), P. C. S. Ângelo, C. G. Nunes-Silva et al., “Guarana [30] V. Witko-Sarsat, M. Friedlander, C. Capeillère-Blandin et al.,
(Paullinia cupana var. sorbilis), an anciently consumed stimu- “Advanced oxidation protein products as a novel marker of
lant from the Amazon rain forest: the seeded-fruit tran- oxidative stress in uremia,” Kidney International, vol. 49,
scriptome,” Plant Cell Reports, vol. 27, no. 1, pp. 117–124, no. 5, pp. 1304–1313, 1996.
2008. [31] M. M. Bradford, “A rapid and sensitive method for the quan-
[15] R. d. L. Portella, R. P. Barcelos, E. J. F. da Rosa et al., “Guaraná titation of microgram quantities of protein utilizing the princi-
(Paullinia cupana Kunth) effects on LDL oxidation in elderly ple of protein-dye binding,” Analytical Biochemistry, vol. 72,
people: an in vitro and in vivo study,” Lipids in Health and Dis- no. 1-2, pp. 248–254, 1976.
ease, vol. 12, no. 1, p. 12, 2013. [32] N. P. Singh, M. T. McCoy, R. R. Tice, and E. L. Schneider, “A
[16] Ambev, “Guaraná Antarctica,” Febuary 2018, http://www. simple technique for quantitation of low levels of DNA dam-
guarana-antarctica.net/product. age in individual cells,” Experimental Cell Research, vol. 175,
[17] V. Poitout, J. Amyot, M. Semache, B. Zarrouki, D. Hagman, no. 1, pp. 184–191, 1988.
and G. Fontés, “Glucolipotoxicity of the pancreatic beta cell,” [33] C. Tonini, B. Campagnaro, L. Louro, T. Pereira, E. Vasquez,
Biochimica et Biophysica Acta, vol. 1801, no. 3, pp. 289–298, and S. Meyrelles, “Effects of aging and hypercholesterolemia
2010. on oxidative stress and DNA damage in bone marrow12 Oxidative Medicine and Cellular Longevity
mononuclear cells in apolipoprotein E-deficient mice,” Inter- [48] M. P. Pase, J. J. Himali, A. S. Beiser et al., “Sugar- and artifi-
national Journal of Molecular Sciences, vol. 14, no. 2, cially sweetened beverages and the risks of incident stroke
pp. 3325–3342, 2013. and dementia: a prospective cohort study,” Stroke, vol. 48,
[34] B. P. Rodrigues, B. P. Campagnaro, C. M. Balarini, T. M. C. no. 5, pp. 1139–1146, 2017.
Pereira, S. S. Meyrelles, and E. C. Vasquez, “Sildenafil amelio- [49] M. I. Van Rompay, N. M. McKeown, E. Goodman et al.,
rates biomarkers of genotoxicity in an experimental model of “Sugar-sweetened beverage intake is positively associated
spontaneous atherosclerosis,” Lipids in Health and Disease, with baseline triglyceride concentrations, and changes in
vol. 12, no. 1, p. 128, 2013. intake are inversely associated with changes in HDL
[35] T. M. Pereira, B. V. Nogueira, L. C. Lima et al., “Cardiac and cholesterol over 12 months in a multi-ethnic sample of chil-
vascular changes in elderly atherosclerotic mice: the influence dren,” Journal of Nutrition, vol. 145, no. 10, pp. 2389–2395,
of gender,” Lipids in Health and Disease, vol. 9, no. 1, p. 87, 2015.
2010. [50] J. B. Smith, B. E. Niven, and J. I. Mann, “The effect of
[36] C. M. Balarini, M. A. Leal, I. B. S. Gomes et al., “Sildenafil reduced extrinsic sucrose intake on plasma triglyceride levels,”
restores endothelial function in the apolipoprotein E knockout European Journal of Clinical Nutrition, vol. 50, no. 8, pp. 498–
mouse,” Journal of Translational Medicine, vol. 11, no. 1, p. 3, 504, 1996.
2013. [51] R. S. Surwit, M. N. Feinglos, C. C. McCaskill et al., “Metabolic
[37] Y. Fu, X. Wang, and W. Kong, “Hyperhomocysteinaemia and and behavioral effects of a high-sucrose diet during weight
vascular injury: advances in mechanisms and drug targets,” loss,” American Journal of Clinical Nutrition, vol. 65, no. 4,
British Journal of Pharmacology, vol. 175, no. 8, pp. 1173– pp. 908–915, 1997.
1189, 2018. [52] S. Park, J. S. Jang, and S. M. Hong, “Long-term consumption of
[38] W. G. McMaster, A. Kirabo, M. S. Madhur, and D. G. Harrison, caffeine improves glucose homeostasis by enhancing insulino-
“Inflammation, immunity, and hypertensive end-organ dam- tropic action through islet insulin/insulin-like growth factor 1
age,” Circulation Research, vol. 116, no. 6, pp. 1022–1033, signaling in diabetic rats,” Metabolism, vol. 56, no. 5, pp. 599–
2015. 607, 2007.
[39] Y. L. Lin, S. Sengupta, K. Gurdziel, G. W. Bell, T. Jacks, and [53] M. Y. Pepino and C. Bourne, “Non-nutritive sweeteners,
E. R. Flores, “p63 and p73 transcriptionally regulate genes energy balance, and glucose homeostasis,” Current Opinion
involved in DNA repair,” PLoS Genetics, vol. 5, no. 10, 2009. in Clinical Nutrition and Metabolic Care, vol. 14, no. 4,
[40] S. B. D. Torre, A. Keller, J. L. Depeyre, and M. Kruseman, pp. 391–395, 2011.
“Sugar-sweetened beverages and obesity risk in children and [54] M. Otero-Losada, G. Cao, S. Mc Loughlin, G. Rodríguez-
adolescents: a systematic analysis on how methodological Granillo, G. Ottaviano, and J. Milei, “Rate of atherosclerosis
quality may influence conclusions,” Journal of the Academy progression in ApoE-/- mice long after discontinuation of
of Nutrition and Dietetics, vol. 116, no. 4, pp. 638–659, 2016. cola beverage drinking,” PLoS One, vol. 9, no. 3, 2014.
[41] V. S. Malik, M. B. Schulze, and F. B. Hu, “Intake of sugar- [55] G. S. Getz and C. A. Reardon, “Animal models of atherosclero-
sweetened beverages and weight gain: a systematic review,” sis,” Arteriosclerosis, Thrombosis, and Vascular Biology, vol. 32,
American Journal of Clinical Nutrition, vol. 84, no. 2, no. 5, pp. 1104–1115, 2012.
pp. 274–288, 2006. [56] A. M. Briones and R. M. Touyz, “Oxidative stress and hyper-
[42] T. A. Marshall, J. M. van Buren, J. J. Warren, J. E. Cavanaugh, tension: current concepts,” Current Hypertension Reports,
and S. M. Levy, “Beverage consumption patterns at age 13 to vol. 12, no. 2, pp. 135–142, 2010.
17 years are associated with weight, height, and body mass [57] A. C. Montezano, M. Dulak-Lis, S. Tsiropoulou, A. Harvey,
index at age 17 years,” Journal of the Academy of Nutrition A. M. Briones, and R. M. Touyz, “Oxidative stress and human
and Dietetics, vol. 117, no. 5, pp. 698–706, 2017. hypertension: vascular mechanisms, biomarkers, and novel
[43] A. M. Meyers, D. Mourra, and J. A. Beeler, “High fructose corn therapies,” Canadian Journal of Cardiology, vol. 31, no. 5,
syrup induces metabolic dysregulation and altered dopamine pp. 631–641, 2015.
signaling in the absence of obesity,” PLoS One, vol. 12, [58] T. Nakagawa, H. Hu, S. Zharikov et al., “A causal role for uric
no. 12, article e0190206, 2017. acid in fructose-induced metabolic syndrome,” American
[44] R. D. Mattes and B. M. Popkin, “Nonnutritive sweetener con- Journal of Physiology-Renal Physiology, vol. 290, no. 3,
sumption in humans: effects on appetite and food intake and pp. F625–F631, 2006.
their putative mechanisms,” American Journal of Clinical [59] N. Wiernsperger, P. Nivoit, L. G. K. de Aguiar, and
Nutrition, vol. 89, no. 1, pp. 1–14, 2009. E. Bouskela, “Microcirculation and the metabolic syndrome,”
[45] S. E. Swithers, “Artificial sweeteners produce the counterintu- Microcirculation, vol. 14, no. 4-5, pp. 403–438, 2007.
itive effect of inducing metabolic derangements,” Trends in [60] L. T. Tran, K. M. MacLeod, and J. H. McNeill, “Chronic eta-
Endocrinology & Metabolism, vol. 24, no. 9, pp. 431–441, 2013. nercept treatment prevents the development of hypertension
[46] R. Dhingra, L. Sullivan, P. F. Jacques et al., “Soft drink in fructose-fed rats,” Molecular and Cellular Biochemistry,
consumption and risk of developing cardiometabolic risk vol. 330, no. 1-2, pp. 219–228, 2009.
factors and the metabolic syndrome in middle-aged adults [61] M. L. Porto, B. P. Rodrigues, T. N. Menezes et al., “Reactive
in the community,” Circulation, vol. 116, no. 5, pp. 480– oxygen species contribute to dysfunction of bone marrow
488, 2007. hematopoietic stem cells in aged C57BL/6 J mice,” Journal of
[47] T. T. Fung, V. Malik, K. M. Rexrode, J. A. E. Manson, W. C. Biomedical Science, vol. 22, no. 1, 2015.
Willett, and F. B. Hu, “Sweetened beverage consumption and [62] P. Libby and G. K. Hansson, “Inflammation and immunity in
risk of coronary heart disease in women,” American Journal diseases of the arterial tree: players and layers,” Circulation
of Clinical Nutrition, vol. 89, no. 4, pp. 1037–1042, 2009. Research, vol. 116, no. 2, pp. 307–311, 2015.You can also read