UBS House View Monthly Base December 2018
←
→
Page content transcription
If your browser does not render page correctly, please read the page content below
UBS House View
Monthly Base December 2018

Chief Investment Office GWM

                              This report was prepared by UBS AG.
                              Please see the important disclaimer at the end of the document.
                              This document is a snapshot view. We update the tactical asset allocation
                              as changes occur and resend it to subscribers. For all other forecasts and
Published                     information, we advise you to check the Investment Views section in your E-
Nov 15 2018                   Banking or in Quotes.                                                         1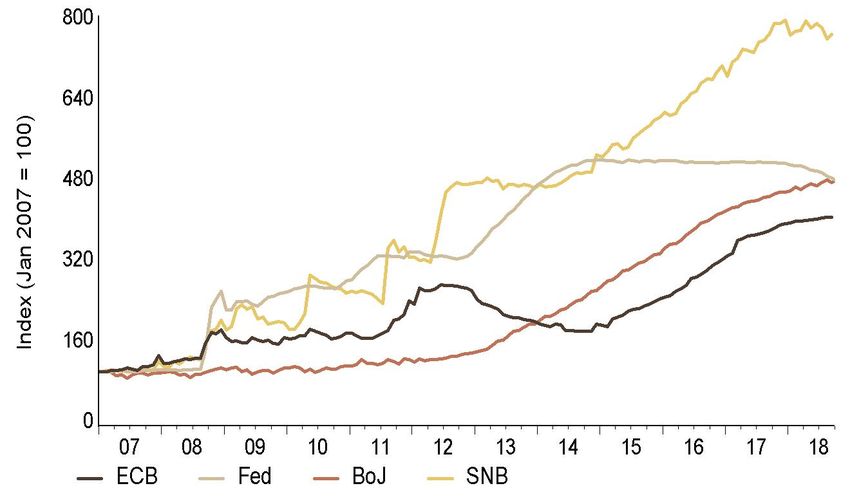
Financial Market Outlook – short term
Equity valuation more attractive after                                     Global Tactical Asset Allocation
recent drop
Price-to-earnings (P/E) ratio for MSCI index
20                                                                         •   Asset allocation
                                                                               Global equities fell about 7% in October, representing one of the worst performing months since the global financial crisis. Still, global leading
15                                                                             indicators – especially for the service sector – point at robust economic growth. The labor market in the US remains robust, and US earnings
                                                                               delivered slightly more than 25% year-over-year growth in the third quarter. This will slow in 2019 as the year-over-year lift from corporate tax
10                                                                             cuts rolls off, but we continue to expect earnings growth to be positive at 4% in the US. In Europe we look for mid-single-digits growth, and in
                                                                               the emerging markets 8%. Against this benign fundamental backdrop we recently added back to global equities versus high grade bonds – a
 5                                                                             position which we reduced in summer.

 0                                                                         •   Equities
                                                                               Volatility picked up in October with US, EM, EMU and Japanese equities falling 6-9%. The defensive Swiss market held up better. Global leading
          P/E based on 12m trailing EPS     10y average of trailing P/E        indicators continue to signal robust economic growth. In the current 3Q earnings season, US companies delivered slightly more than 25%
          20y average of trailing P/E                                          earnings growth. As earnings improved globally valuations became more attractive. We keep our preference for Canadian stocks over Australian
Source: Thomson Reuters, UBS, as of 13 November 2018                           equities due to more compelling valuations. Earnings dynamics are also stronger in Canada than in Australia.

Yield on EM sovereign bonds in USD is                                      •   Bonds
attractive                                                                     We hold an overweight on emerging market (EM) sovereign bonds in USD against HG bonds. EM fundamentals and the bonds' attractive yield
Yield-to-maturity (in %)                                                       of 6.9% support the position. We are overweight 2-year Italian government bonds against EUR cash. Short-term Italian rates look appealing
13
                                                                               (with yields 1.5% above those of similar maturity Bunds), given the low likelihood in our view of Italy defaulting over the coming years, and the
12

11
                                                                               attractive carry and roll-down. We are overweight 10-year US Treasuries versus USD cash as we think this part of the curve has largely priced in
10                                                                             the rate-hiking cycle, and the carry is attractive. We are underweight 10-year Japanese government bonds versus JPY cash. We believe the Bank
 9
                                                                               of Japan will allow yields to move further upwards as inflation picks up.
 8

 7
 6
 5
                                                                           •   Foreign exchange
 4
                                                                               We are overweight the Japanese yen (JPY) versus the Taiwan dollar (TWD). The long JPY position should benefit from either rising Japanese inflation
 Jan-07        Jan-09       Jan-11        Jan-13      Jan-15     Jan-17
                                EM sovereign bonds YTM (%)                     prompting the Bank of Japan to allow yields to move further upwards, or a downturn in global financial markets creating demand for the JPY's
Source: Thomson Reuters, UBS, as of 13 November 2018                           safe-haven function. Meanwhile, Taiwan is exposed to risks arising from US trade policy disputes.

                                                                          For further information please contact Head CIO Global Asset Allocation Andreas J Koester, andreas.koester@ubs.com or CIO asset class specialists Philipp Schöttler,   2
                                                                                                                                                              philipp.schoettler@ubs.com or Carolina Corvalan, carolina.corvalan@ubs.com.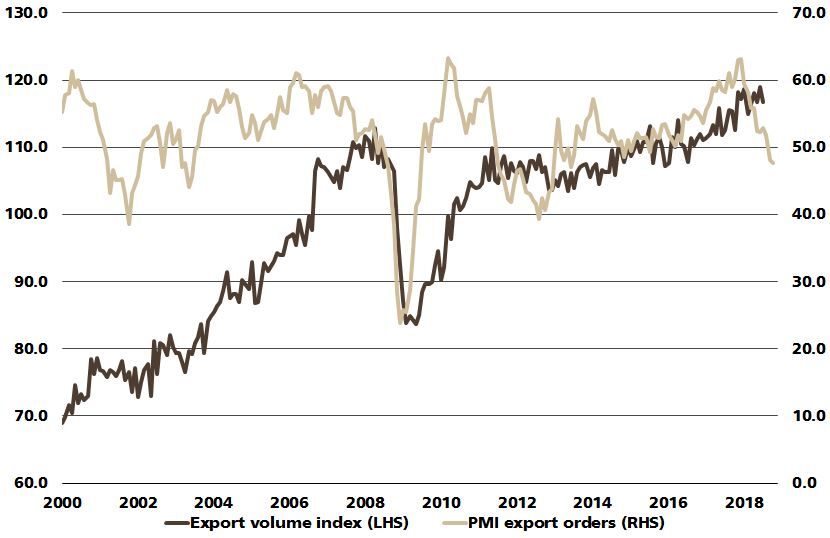
Cross-asset preferences
We like... We don't like... Model portfolios (EUR & USD)*
Risk Parity Liquidity
• Global equities • Australian equities 2% 5% High grade
bonds
• Canadian equities
Hedge Funds 7.5%
18% US TIPS 2%
Equities • Global quality stocks
Inv. grade
• "Buy-write" strategy on US equities corporate
bonds 8%
• US smart beta
• Some protection via US equity put options
Equities US
12%
EUR High yield
bonds
5%
• EM sovereign bonds in USD • Developed market high grade bonds EM bonds
7.5%
• Selected EM bonds • 10-year Japanese govt. bonds vs. JPY cash
Equities others
5%
• 10-year US Treasuries vs. USD cash • "Well-worn" bonds Equities Europe Equities EM
Bonds 24%
• Long-dated USD high grade bonds 4%
• European leveraged loans Risk Parity Liquidity
2% 5% High grade
• 2-year Italian government bonds vs. EUR Hedge Funds bonds
cash 18% 5.5%US TIPS
4%
Foreign exchange • Japanese yen vs... • ...Taiwan dollar Inv. grade
corporate
bonds
Hedge Funds • Navigating rising US rates with hedge 8%
funds USD High yield
bonds
5%
Precious Metals Equities US
& Commodities 21% EM bonds
7.5%
Equities others
6%
Equities EM
Equities Europe
Recent upgrades Recent downgrades 5%
13%
Source: UBS, as of 15 November 2018; * Additionally, the portfolios include
overweight positions in 2-year Italian government bonds, 10-year US Treasuries and
an underweight in 10-year Japanese government bonds (via overlays)
Note: Portfolio weightings are for a EUR model portfolio and a
USD model portfolio, with a balanced risk profile (including TAA).
We expect the EUR balanced portfolio (excluding TAA) to have
an average total return of 3.5% p.a. and a volatility of 8% p.a.
over the next seven years. We expect the USD balanced portfolio
(excl. TAA) to have an average total return of 5.2% p.a. and a
volatility of 7.9% p.a. over the next seven years.
3Global tactical asset allocation
Tactical asset allocation deviations from benchmark*
Currency allocation
underweight neutral overweight
underweight neutral overweight
Liquidity
Equities total** USD
Global
US EUR
Eurozone
UK GBP
Switzerland
Canada*** JPY
Japan
Emerging markets (EM) CHF
Australia***
Bonds total SEK
High grade bonds
Corporate bonds (IG) NOK
High yield bonds
EM sovereign bonds (USD) CAD
EM corporate bonds (USD)
EM local currency bonds NZD
US TIPS
Italian 2-year govt bond overlay AUD
Duration overlay (USD)
Duration overlay (JPY) TWD
new old
new old
Source: UBS, as of 15 November 2018
Source: UBS, as of 15 November 2018
*Please note that the bar charts show total portfolio preferences, which can be interpreted as the
recommended deviation from the relevant portfolio benchmark for any given asset class and sub-asset class.
**We are holding a put option on the S&P 500 to partly protect the tactical asset allocation.
***Note: Equity risk profile only.
4CIO themes in focus
Equities
• US smart beta
Certain stock characteristics (momentum, quality, small capitalization, risk-weighting, value, and yield) have been shown to deliver long-term investment outperformance relative to a market-
capitalization-weighted index. Combining these characteristics, known in the industry as smart beta, makes the investment less cyclical and creates a "passive-plus" solution. Smart beta's
compelling value proposition has resulted in considerable growth in assets. Smart beta ETF assets have risen to over USD 650bn and are growing by more than 30% a year.
• Generate yield: "Buy-write" on US equities
An equity buy-write strategy involves the purchase of equities (the "buy" part) while systematically selling (or "writing") call options that cover the position, typically on a monthly schedule. In
exchange for giving a counterparty the right, but not the obligation, to buy the underlying asset at a predetermined price, the buy-writer receives a premium. Over an economic cycle, equity
buy-write strategies generate attractive risk-adjusted returns as they capture both the equity and volatility risk premium. They are most appealing when equity returns moderate and market
momentum decreases and, historically, perform strongly during periods of rising rates.
• Global quality matters
The quality factor aims to reflect the performance of companies with durable business models and sustainable competitive advantages. It therefore targets companies with a high return
on equity, stable earnings, and low financial leverage. In the mid-to-late stages of the business cycle, when monetary policy is less accommodative and volatility rises, quality matters. With
increasing trade tensions, a global sector-neutral quality strategy can also offer added downside protection in a relative context.
Bonds
• Time to be more selective in EM credit
With this theme, we provide advice on how to build diversified exposure to emerging market (EM) credit, drawing from our top-down view on the asset class, as well as the bottom-up insights
of our credit analysts. Emerging market credit should benefit from resilient global growth, sound credit fundamentals, as well as its relative attractiveness against other credit market segments.
While emerging economies are on aggregate at an earlier stage in the business cycle than developed markets, there are big differences between countries and market sectors. Exposure to global
risks vary from country to country as well. We think it is becoming increasingly important to invest in the right credits, and to actively adjust exposure toward the most promising opportunities.
• Replacing well-worn bonds
Risk-free yields in some major developed markets are near or below zero. Even if rates stay unchanged, many short- to medium-term bonds would deliver negative total returns. We think
investors can preserve wealth by taking profits on assets that will deliver negative returns (exceeding switching-out costs) in most likely scenarios. More attractive alternatives can be found
on CIO's bond recommendation lists.
• Opportunities in European leveraged loans
Financial market volatility has risen from last year's lows, while attractive fixed income investments in Europe remain hard to find. We think European leveraged loans offer an appealing risk-
reward profile due to their attractive yield and generally low volatility, and our outlook for low default rates. European leveraged loans are offering a yield around 4%, which compares favorably
with other bond alternatives. We expect 12-month total returns of 3–4% in EUR and 6–7% hedged into USD. Following the outperformance of US loans since the beginning of the year, we are
starting to see better investment opportunities in European loans. We recommend investors in US loans to hold onto their investments, but for new investments to be made in European loans.
• Long-dated USD high grade bonds: Buy now or never
Within a portfolio of equities and bonds, long-dated high grade bonds, in addition to their carry yield, can buffer losses from risk assets. Investors should use the current level of long-term
US dollar yields, which we think are close to the highs of this cycle, to align the portfolio share and average tenor of high grade bonds with a strategic asset allocation reflecting their risk
profile, for example by deploying excess cash or reducing potential over-allocations to lower-quality bonds.
5CIO themes in focus
Alternative investments
• Navigating rising US rates with hedge funds
The US Federal Reserve has started to hike interest rates. Historically, most hedge fund strategies have been resilient to rising rates, while high grade bonds have performed poorly. Investors
looking for an alternative to their high grade bond exposure should consider a diversified hedge fund portfolio characterized by low directional exposure to both fixed income and equities.
This selection of themes is a subset of a larger theme universe. It represents the highest conviction themes of the UBS Chief Investment Office GWM, taking into account the current market environment and risk-return
characteristics.
6CIO longer term investment themes in focus
Equities
• Space
The sharp decline in launch costs is lowering entry barriers to space. We forecast the space economy will likely grow from USD 340bn currently to almost USD 1trn in the next couple of
decades, catalyzed by sustained capital investment by new-economy billionaires. Investment exposure at this early stage is best gained via existing listed companies in the aerospace, satellite
and communications segments. New space start-ups may offer investment opportunities in private markets.
• Medical devices
The aging population and growth of the over-65 age group will create more opportunities for companies selling medical products and devices. Other drivers of the medical device industry
include better penetration in emerging markets due to improved infrastructure, new innovative treatments, increased affordability due to rising per-capita GDP, and a growing prevalence of
"lifestyle diseases" like obesity due to urbanization. We expect sustainable mid-single-digit revenue growth.
• EM tourism
Urbanization and income growth are driving demand growth for emerging market tourism and global aviation infrastructure. Already, the number of emerging market air passengers carried
globally exceed that of developed markets. Airbus forecasts that two-thirds of new plane orders will come from emerging markets in the next 20 years. The growth of EM tourism is further
supported by government policy, particularly economic diversification away from commodity exports and rising visa openness to draw visitors and attract foreign-currency receipts.
• Fintech
Driven by rapid urbanization, strong demand from millennials, and favorable regulations, the global fintech industry is at an inflection point and set to drive a major digital transformation in
the financial services industry. We expect global fintech revenues to grow from USD 120bn in 2017 to USD 265bn in 2025, implying an average annual growth rate about three times faster
than the broader financial sector's.
• Silver spending
The aging of the global population provides investment opportunities. Compared with younger age groups, "silver spenders" allocate more of their disposable income to leisure and tourism
(particularly cruises), as well as consumer personal care and beauty products (specifically anti-aging products). These markets are estimated to grow by 8% and 6% a year, respectively, well
above the average consumer spending growth of less than 2% in G7 nations.
This selection of themes is a subset of a larger theme universe. It represents the highest conviction themes of the UBS Chief Investment Office GWM, taking into account the current market environment and risk-return
characteristics. The Longer Term Investment (LTI) theme series focuses on inevitable global trends, such as population growth, aging, and urbanization, that create a variety of opportunities, with certain companies and
subsectors experiencing a higher-than-GDP rate of revenue growth. Here, we include a subset of a larger universe of LTI themes expected to offer good entry points for theme-oriented investors in the coming months,
and highlight our preference for a diversified approach to themes.
UBS Chief Investment Office GWM considers the highlighted themes as fitting the sustainability framework. 7Key investment risks
Selected Scenarios Scenario Description Expected market performance for select asset classes
US equities +0 5% due to solid economic activity supported by government spending,
Positive outlook Global economic performance remains solid, but business confidence and capital access
Base case with increased ongoing trade tensions and uncertainty about Eurozone equities +0 5% amid political uncertainty surrounding Italy, Brexit and the
volatility Eurozone growth keep the volatility high. ongoing trade conflict
EURUSD between 1.15 and 1.20 as monetary policy normalizes
US equities down 5 10% composed of a 5% hit to our EPS estimates coupled with
US-China trade disputes induce a slowdown in P/Es contracting 0 5%
Trade: Further China, considerable uncertainty and a rerouting Chinese equities down 20 25% as sentiment tanks further with worse-than-expected
US sanctions of global trade. More countries start to feel pain economic consequences
via disrupted supply chains.
USD appreciates to around EURUSD 1.10 as US tariffs support the USD
Crude oil spikes to USD 120/bbl
Escalating tensions disrupt energy exports,
Key Oil: Escalating
causing oil prices to spike sustainably to USD US energy equities +15 20% as they are in gereneral closely correlated to oil prices
downside tensions disrupt
120/bbl a level that would hurt the global
scenarios energy exports NOK appreciates, bringing USDNOK down 15-20% as higher oil prices lift the revenue
economy.
of Norway's oil export sector (around 15% of GDP)
US equities down 10 15% as valuations fall 5 10% as fears about the end of the cycle
As US inflation rises rapidly, the Fed is forced to
rise and earnings do not grow in 2019
Fed ends the hike rates at each FOMC meeting. This leads to
US high yield down 6 9% as spreads widen towards recession levels, while mid- to
business cycle a flat or inverted US Treasury yield curve toward
longer-term US Treasury yields fall
sooner mid-2019, followed by an equity bear market. A
US recession starts in early 2020. USD appreciates, bringing EURUSD to or below 1.10 as the USD strengthens due to
contractionary monetary policy
US equities +10 15% as increased confidence in the cycle allows P/Es to expand to
Trade: Negotiations between the US and China restart, 17.5 18x and 2019 EPS estimates hold in the mid-USD 170s
Negotiations leading to actual progress and a reduction of Chinese equities +10 15% due to a strong recovery on risk sentiment and better-than-
avert additional trade barriers. Although tensions remain high, expected fundamentals
sanctions both countries agree on a trade truce.
USD depreciates to EURUSD 1.20 1.25
Key upside
scenarios Chinese equities +15 20% due to a recovery on valuation as growth beats consensus
expectations
Chinese GDP growth remains in a 6.6 6.8%
China: Stable EMBIGD bonds return 6 7% as spreads tighten to around 310bps due to improving EM
range as the current account balance goes back
GDP growth growth prospects
above USD 100bn.
CNY appreciates to USDCNY 6.50 as strong Chinese growth supports the domestic
equity market, preventing outflows and supporting inflows of capital
Expected total returns over a 6-month horizon
Note: Upside and downside scenarios are possible events outside of CIO's base case expectations.
Please refer to the last published Global Risk Radar edition for further details on the risk scenarios and investment implications
For further information please contact CIO strategist Dirk Effenberger, dirk.effenberger@ubs.com
Source: UBS, as of November 2018
8Key financial market driver 1 - Central bank policy
Consumer borrowing costs barely matching income
Key points
growth
• Investors expect the Federal Reserve to stick to the rhythm of "hike, pause, hike, pause." This would suggest a December rate increase.
Interest rates on US fixed rate mortgages, less personal
Fed bond holdings, a form of liquidity supply, should continue to decline to hopefully match the reduction in liquidity demand in
income growth
the economy.
12.0%
• The European Central Bank (ECB) is still expected to end its bond-buying program at the end of this year. Markets expect the ECB to
10.0%
raise interest rates in 2019.
8.0%
• The Swiss National Bank (SNB) is unlikely to raise interest rates until 2H19, given the increased global uncertainty (and the potential
6.0%
for safe-haven flows). The Bank of England governor will stay in office for longer than expected, to provide stability as the UK and
4.0%
the EU separate.
2.0%
0.0%
CIO view (Probability: 75%*) Policies tighten gradually
-2.0%
• The rate rise in September demonstrated the regular rhythm of the Fed's tightening schedule, and markets view a December
-4.0%
rate hike as a very high-probability event. Investor discussion has now shifted to the number of rate hikes in 2019. Trade tariffs
-6.0%
are a tax hike, and like other tax hikes will slow the US economy. The inflation consequences of trade protectionism are likely to
-8.0%
be less of a concern than the growth consequences. The Fed continues to reduce liquidity supply to match a decline in liquidity 2004 2006 2008 2010 2012 2014 2016 2018
demand in the economy. A deficit-financed fiscal stimulus by the US government at a time of full employment is a concern for 15 year mortgage rate less income growth 30 year mortgage rate less income growth
the medium-term interest rate outlook. Source: Haver, UBS, as of 12 November 2018
• The ECB's general message is that its quantitative easing (QE) program will conclude at the end of this year in the absence of a
more substantial negative economic shock. The program's EUR 30bn worth of asset purchases per month fell to EUR 15bn in
October. Liquidity supply declining as demand for liquidity
• Central banks have expressed a clearer bias toward tightening rather than easing; this coincidence of views probably reflects fades
the general improvement in global growth rather than an overt coordination. Most central banks are being very clear in their Central bank balance sheets as a share of GDP
intentions, meaning that markets are rarely surprised by policy moves. 140%
• The tightening of central bank policy represents a shift from past cycles. This time, central banks have no desire to temper 120%
economic growth or inflation; the aim is to maintain them around current levels. Past episodes of policy tightening had
deliberately sought to reduce company pricing power and inflation. 100%
80%
Positive scenario (Probability: 10%*) Policy easing as macro backdrop worsens
• The Fed falls further behind the curve as US inflation surprises higher, with real interest rates slipping more rapidly. The ECB 60%
reverses its tone and puts a stronger emphasis on the potential to ease policy further. 40%
Negative scenario (Probability: 15%*) Central banks seek to reduce pricing power as macro risks 20%
fade
• The inflationary effect of a tighter US labor market and fiscal stimulus leads to a stronger Fed response and a combination of tight 0%
Fed ECB SNB BoJ BoE
monetary policy and loose fiscal policy. Increased labor costs and commodity price pressures lead to higher European inflation, 2007 High Latest
signaling a more rapid monetary policy tightening. Source: Haver, UBS calculations, as of 12 November 2018
*Scenario probabilities are based on qualitative assessment
Key dates
Dec 19 US Federal Reserve meeting
For further information please contact US economist Brian Rose, brian.rose@ubs.com, European economist Ricardo Garcia, ricardo-za.garcia@ubs.com or UBS GWM Global Chief Economist 9
Paul Donovan, paul.donovan@ubs.comKey financial market driver 2 - Political risks
US political polarisation (I)
Key points
Breakdown of mid-term voting by age group
• A lot of political noise that dominates the news has little relevance for economics, and so there has been little need for markets to
80
react. The ongoing Mueller investigation in the US is an example of political noise with few direct economic implications. The Italian
budget disagreement with the EU has some direct economic consequences, but markets have priced in a lot. 70
• Negotiations on the UK's exit from the EU continue with conflicting signals – the question is whether any deal will pass the UK 60
Parliament. The change in leadership in the German CDU, which is likely to be decided in December, is of interest to investors as a 50
signal as to where domestic policy may head.
40
• The world is not yet in a trade war (defined as global trade falling as a share of global GDP, in real terms). The risks of a Sino-US
trade war remain, with investors keen to see the outcome of talks on the fringes of the G20 meeting in Buenos Aires. 30
20
CIO view (Probability: 70%*)
10
• Markets have seemingly developed some immunity to political rhetoric. The ongoing Mueller investigation in the United States
would only impact financial markets if it were seen as changing policy outcomes. The US mid-term elections produced the result 0
18-29 30-44 45-64 65+
markets had expected. US political polarisation is considerable. Investors will watch the reaction of the White House to a likely
Democrat Republican
gridlock in Washington, and to the likelihood of increased investigations by Congress. Source: Pew Research Center, UBS, as of 12 November 2018
• US trade taxes to-date have not generally impacted the overall volume of global trade, although imports may have accelerated
to beat tariff increases. Companies do seem to be finding ways of evading the trade taxes. Extending trade protectionism into a
trade war would be a more obvious tax on US consumers.
US political polarisation (II)
• Our base case is that a deal will be done for the separation of the UK and the EU. However, the necessity of UK parliamentary Breakdown of mid-term voting by gender and race
approval is likely to add uncertainty. 100
• Italy's budget disagreements with the EU highlight some of the tensions on the European political scene. Nationalist and anti- 90
politics have been gaining ground in some areas. However, Italy remains an extremely wealthy country, and should be capable of 80
funding its debt. Germany's governing CDU is in focus in December with leadership elections expected. 70
60
Positive scenario (Probability: 10%*) 50
• Better labor market conditions for low-skilled workers lead to faster wage hikes; this eases income and consumption inequality. 40
The costs of trade protection are made more apparent to US voters through the actions of corporations, and the US retreats from 30
its isolationist agenda. 20
10
Negative scenario (Probability: 20%*) 0
• Nationalist tendencies are encouraged by single-issue politics and social media. Traditional party structures fail to address the Men (all race) Women (all White Black Hispanic Asian
race)
demands of large sections of the electorate. Political outcomes are increasingly unpredictable as opinion polls offer even less Democrat Republican
guidance. Trade protectionism escalates. Lower-income groups' standards of living are hurt by populist policies and rising prices, Source: Pew Research Center, UBS, as of 12 November 2018
fueling further demands for radical and unpredictable change.
*Scenario probabilities are based on qualitative assessment.
Key dates
Nov 30 G20 leaders' summit in Buenos Aires
Dec 6 German CDU Party Conference
For further information please contact Global Chief Economist, UBS WM Paul Donovan, paul.donovan@ubs.com 10Key financial market driver 3 - Solid US profit growth, but
deceleration ahead
Strong earnings growth continues
Key points
S&P 500 EPS growth, year-on-year; impact of lower tax
• A solid economy and tax reform are driving strong earnings growth this year.
rate in light brown
• However, growth will slow in 2019 to 4%, partly due to tariffs.
• A further escalation in trade frictions cannot be ruled out. 30%
26%
22%
CIO view (Probability: 60%*) Earnings are strong for now 18%
14%
• The US earnings growth outlook remains relatively healthy, driven by solid consumer spending, secular growth in tech, and 10%
robust capital spending. Leading indicators such as bank lending standards and capital spending intentions also remain 6%
supportive. However, the outlook has softened due to some weakness in non-US economies and rising trade frictions. 2%
-2%
• But the US-China trade dispute is intensifying. The direct impact of the tariffs now in place will likely trim annual S&P 500 profit -6%
3Q18E
3Q13
4Q13
1Q14
2Q14
3Q14
4Q14
1Q15
2Q15
3Q15
4Q15
1Q16
2Q16
3Q16
4Q16
1Q17
2Q17
3Q17
4Q17
1Q18
2Q18
growth by 2–3%. If the US expands tariffs to all Chinese imports, the impact could rise to about 4–5%.
• For full-year 2018, we expect S&P 500 EPS of USD 161 (21% growth). Growth should slow in 2019 as the one-time benefit from
a lower tax rate falls off. We also include a tariff-related drag of 2–3%. Our 2019 EPS estimate is USD 168 (4% growth). Source: FactSet, UBS, as of 7 November 2018
• The 3Q earnings season is nearly complete. EPS growth is tracking at 27%, much stronger than our initial estimates. Although
the lower tax rate is providing an 8% boost to earnings, fundamentals are still strong, with revenues growing over 8%.
• While consensus estimates for the fourth quarter are being revised down due to some cost pressures, currency headwinds, and 4Q EPS estimates are falling, but no more than
pockets of weakness in the global economy, estimates are not falling any more than they historically do. Further, bottom-up they usually do
consensus estimates still imply strong earnings growth of 16% for 4Q. Change in bottom-up S&P 500 EPS est. from the
• Fears that high profit margins will decline in the near term appear overblown. Excluding the tech sector, margins are not beginning of the quarter through reporting season,
excessive. The tech sector's high margins are supported by companies with dominant market shares. Other structural factors, indexed
such as industry consolidation and a secular decline in tax rates, support higher-than-average profit margins. In addition, margins 101
typically only decline in a recession. Finally, the prospect of higher wages is unlikely to dent the outlook. Labor cost inflation has
100
virtually no correlation with earnings growth as higher consumer income is usually recycled into faster consumer spending.
99
Positive scenario (Probability: 20%*) Fiscal policy boosts earnings more than expected 98
• Corporate tax reform and increased government spending generate even faster-than-expected profit growth. Deregulation further
boost financial sector earnings. Investment spending picks up. 97
96
Negative scenario (Probability: 20%*) Downturn in sentiment
• Trade and geopolitical tensions flare up, depressing business and consumer sentiment. Wage pressures, without improving 95
consumer and business demand, crimp profit margins and earnings growth rates. Declines in long-term interest rates pressure -3 mo -2 mo -1 mo Qtr end +1 mo +2 mo
financial sector earnings. 1Q11-2Q18 Average 4Q18
*Scenario probabilities are based on qualitative assessment. Source: FactSet, UBS, as of 7 November 2018
Key dates
Dec 12 Results from fourth quarter "early" reporters
For further information please contact CIO strategists Jeremy Zirin, jeremy.zirin@ubs.com, David Lefkowitz, david.lefkowitz@ubs.com or Edmund Tran, edmund.tran@ubs.com. 11Global economic outlook - Summary
Key points
• Global growth continues to be reasonable. There have been some signs of a modest slowdown in the second half of this year. This Trend-like growth, normal inflation
was expected, in particular as the impact of US tax cuts fades. However, overall growth remains around trend. UBS estimates and forecasts
Real GDP growth in % Inflation in %
• Companies are finding it easier to hike prices. The producer price index (PPI) excluding energy is high in the US and the UK. 2015 2016 2017 2018F 2019F 2015 2016 2017 2018F 2019F
Americas US 2.9 1.6 2.2 2.8 2.4 0.1 1.3 2.1 2.4 2.0
Consumer prices are noisy, but almost every US and European consumer price index (CPI) is around its 20-year average. Canada 1.0 1.4 3.0 2.1 2.5 1.1 1.4 1.6 2.3 2.2
Brazil -3.5 -3.5 1.0 1.5 3.0 9.0 8.7 3.4 3.7 4.3
• Domestic demand remains firm in most major economies, with the strength of the labor markets an important support. Global Asia/Pacific Japan
Australia
1.4
2.5
1.0
2.6
1.7
2.2
1.0
3.3
1.7
2.8
0.8
1.5
-0.1
1.3
0.5
1.9
1.0
2.0
1.7
2.1
trade is threatened by US action, but it is important to stress that this is US-focused and not a general trade dispute. China
India
6.9
8.2
6.7
7.1
6.9
6.7
6.5
7.3
6.0
7.3
1.4
4.9
2.0
4.5
1.6
3.6
2.2
4.2
2.0
4.6
Europe Eurozone 2.0 1.9 2.5 1.9 1.6 0.0 0.2 1.5 1.8 1.7
Germany 1.5 2.2 2.5 1.7 1.6 0.1 0.4 1.7 1.9 1.8
France 1.0 1.1 2.3 1.6 1.6 0.1 0.3 1.2 2.1 1.6
CIO view (Probability: 70%*) Global growth firm, around trend Italy 0.8 1.3 1.6 1.0 1.0 0.1 0.0 1.3 1.3 1.1
Spain 3.6 3.2 3.0 2.5 2.2 -0.6 -0.3 2.0 1.9 1.6
• The world economy continues to perform well. Economic trends suggest that growth this year will match last year. Labor UK
Switzerland
2.3
1.3
1.8
1.6
1.7
1.7
1.2
2.9
1.8
1.6
0.0
-1.1
0.7
-0.4
2.7
0.5
2.5
1.0
2.1
1.0
markets remain very strong in most developed economies. There is evidence in the data that this is now lifting household World
Russia -2.5
3.6
-0.2
3.2
1.5
3.9
1.6
3.8
1.5
3.6
15.5
2.6
7.0
2.7
3.7
2.7
2.9
3.1
5.4
3.2
incomes. Income growth is being spent. In the US and the UK, retail sales volumes are growing faster than last year. In Europe, Source: UBS, as of 15 November 2018
volume growth rates are generally slightly slower, with Germany and Spain somewhat weaker. The German economy seems Forecasts and estimates are current only as of the date of this
likely to recover quickly from the temporary problems of the auto sector. publication, and may change without notice.
• US investment is reportedly being delayed by trade tensions, and trade issues may slow US growth later this year. To date, trade
tensions have affected sentiment, but do not appear to be having a significant impact on trading activity. Global trade has Trade tensions hurting sentiment more than trade
remained stable as a share of the world economy (in real terms). Most of the US trade tariffs (tax increases) to date are likely to German export volumes have not fallen in the way
redistribute, rather than reduce, global trade. German sentiment data suggested
• Companies are finding it easier to raise prices. PPI is generally higher than in the recent past. Wage growth in both the US
and Europe is consistent with some modest rise in price inflation. Labor costs typically make up about 70% of a developed
economy's inflation.
Positive scenario (Probability: 15%*) Growth exceeds expectations
• European economic growth surprises positively, with better labor markets and stronger domestic demand. US economic growth
data continue to be revised higher, and labor market shortages increase household incomes and consumer demand at a faster
pace than expected. Fiscal stimulus adds to the pace of economic activity, and taxes on trade are reversed.
• Emerging markets see stable domestic demand. Those markets that have experienced volatility pursue market-friendly policies.
Pro-business forces guide the US policy agenda and produce growth-supportive regulatory and legislative changes.
Negative scenario (Probability: 15%*) Political damage to growth
• Additional US fiscal stimulus at a time of full employment produces economic overheating, which in turn provokes an economic
recession in 2019. A full trade war (where trade policies produce a declining real-trade-to-GDP ratio) reduces US consumer Source: Haver, UBS, as of 12 November 2018
spending and increases unemployment in 2019. Slower US growth translates into slower global demand, and emerging market
weakness becomes more widespread.
• European growth fades as domestic demand falters. Bank lending falters and the European Central Bank fails to respond quickly.
*Scenario probabilities are based on qualitative assessment.
Key dates
Dec 13 European Central Bank meeting
Dec 19 US Federal Reserve meeting
For further information please contact UBS WM Global Chief Economist Paul Donovan, paul.donovan@ubs.com 12US economy - Moderate growth in the US
Key points Inflation is near the Fed's 2% target
• Economic growth should slow over the next 12 months as fiscal and monetary stimulus fades. PCE and core PCE inflation rate, in %
• Inflation should gradually trend higher along with wage growth. 5
• The Fed will likely continue to hike interest rates and shrink its balance sheet gradually. 4
3
CIO view (Probability: 60%*) Moderate expansion 2
• The strong labor market and income tax cuts should support robust consumer spending. 1
• Business investment should continue to increase, encouraged by strong profits and labor shortages, although trade disputes will 0
likely act as a constraint. (1)
• Manufacturing output should rise at a moderate pace. (2)
2008 2010 2012 2014 2016 2018
• Recent housing data suggest that higher interest rates are restraining growth, but we still expect housing starts and home prices PCE price index y/y Core PCE price index y/y
to trend modestly higher over time. Source: Bloomberg, UBS, as of 9 November 2018
• Tax cuts and increased government spending are providing a substantial stimulus to growth that will start to fade in 2019.
Deregulation should provide some economic benefit over time. PCE = personal consumption expenditures
• Trade disputes are negative for growth. Tariffs on USD 200 bn of Chinese goods are set to rise from 10% up to 25% on 1
January 2019. Tight labor market pushing wages higher
• Inflation has risen to the Fed's 2% target and is likely to move somewhat higher as the US economy begins to overheat and Average hourly earnings, year-over-year change, and
tariffs raise import prices. However, we expect core inflation to remain within the limits that the Fed will tolerate. unemployment rate, in %
• We expect the Fed to continue hiking interest rates and shrinking its balance sheet at a gradual pace, reaching a neutral stance 4.0 11.0
by the end of 2019. 3.5 10.0
3.0 9.0
• Risks to the recovery may increase toward the end of 2019 as fiscal and monetary policy offer less support. 2.5 8.0
2.0 7.0
Positive scenario (Probability: 20%*) Strong expansion 1.5 6.0
1.0 5.0
• US real GDP grows above 3%, propelled by an accommodative monetary policy, looser fiscal policy, strong household spending, 0.5 4.0
and breakthroughs in trade negotiations. Inflation overshoots the Fed's 2% target, potentially leading the central bank to raise 0.0 3.0
rates at a faster pace. 2007 2009 2011 2013 2015 2017
Average hourly earnings (lhs)
Negative scenario (Probability: 20%*) Growth recession
Unemployment rate (rhs)
• US growth stumbles. Trade disputes, political uncertainty, and tighter financial conditions weigh on business investment and
Source: Bloomberg, UBS, as of 9 November 2018
consumer spending. The Fed stays on hold.
*Scenario probabilities are based on qualitative assessment.
Key dates
Nov 29 Personal income and spending, PCE deflator for October
Dec 3 ISM Manufacturing for November
Dec 5 ISM Non-manufacturing for November
Dec 7 Labor report for November
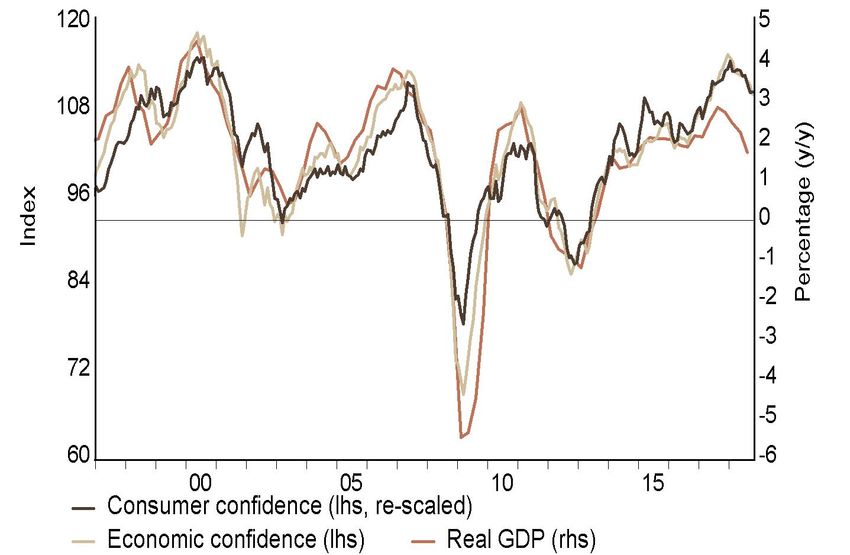
For further information please contact US economist Brian Rose, brian.rose@ubs.com 13Eurozone economy - Growth to pick up after summer soft
patch
Key points Eurozone growth consolidating in 2018
• We expect economic growth to normalize after the summer lull. Business and consumer surveys
• Inflation is set to hover around the ECB's target.
• We expect the ECB to start raising rates in December 2019.
CIO view (Probability: 60%*) Growth to stabilize at solid levels
• Following the hit to car production in the summer on the back of new emission standards, activity is set to normalize by the end
of the first quarter. The ECB remains in wait-and-see mode as inflation hovers around its target and until key risks fade. We think
the central bank may start raising rates in December 2019.
• In Germany fundamentals such as consumer confidence, wage increases, and construction remain robust, mitigating the impact
from global protectionism. In France, President Emmanuel Macron's reforms should start to support GDP growth.
• Fiscal stimulus in Italy should be partly offset by tightening financial conditions. Spain is still growing strongly, but the momentum
is likely to continue to normalize.
Positive scenario (Probability: 20%*) Better-than-expected growth
Source: Haver Analytics, UBS, as of October 2018
• The global economy accelerates again and the euro weakens. Eurozone loan demand and the economy recover faster than
envisaged. Political risks fade.
Negative scenario (Probability: 20%*) Disinflationary setback
• The Eurozone suffers a disinflationary setback as markets lose faith in Italy's debt sustainability, trade tensions escalate sharply, ECB balance sheet topping out
Brexit talks fail, or the Chinese economy suffers a severe downturn. Total assets in national currency (index: 2007=100)
*Scenario probabilities are based on qualitative assessment.
Key dates
Nov 23 PMI flash for November
Nov 30 Inflation estimate for November
Nov 30 Unemployment for October
Dec 13 ECB press conference
Source: Haver, UBS, as of October 2018 (SNB and ECB data as of September 2018)
For further information please contact CIO Chief Economist Eurozone Ricardo Garcia, ricardo-za.garcia@ubs.com 14Chinese economy - Policy easing continues
Key points 3Q GDP growth moderated on slower investment
• GDP growth is on track for moderation. and consumption
• Policy easing will continue to cushion external trade tension and internal headwinds. Quarterly GDP growth and decomposition's share to
• The Sino-US relationship enters a "new normal" with cycles of talk-fight-talk for years. GDP growth
8.2 9.5
CIO view (Probability: 80%*) On track for moderation 8.0
8.5
• 3Q GDP growth moderated to 6.5% y/y from 6.75% y/y in 1H due to a slowdown in investment and consumption. 3Q FAI growth 7.5
7.8
decelerated further to 4.6% y/y from 5.2% y/y in 2Q18, and retail sales growth remained at 9.0% y/y, similar to 2Q18. GDP growth 6.5
is on track for moderation, likely to reach 6.5% in 2018 and 6% in 2019 on rising trade pressure. 7.6
5.5
• September CPI inflation edged up to a seven-month high of 2.5% y/y on higher food prices. CPI inflation is set to stay mild; we 7.4 4.5
expect it to average 2.2% and 1.9% respectively in 2018 and 2019. 7.2 3.5
• Policy easing will continue to shield against internal and external headwinds. Monetary policy stance turned "stable" with 7.0
2.5
"reasonably ample" liquidity with expectation of another 100-200 bps of RRR cuts within six to 12 months, and fiscal policy should 1.5
become more active with support for infrastructure projects. China has also further deepened its market openness and actively 6.8
0.5
promoted its strategic partnership with non-US economies, especially Japan. 6.6
(0.5)
• Facing escalating US tariff pressure, China will continue to retaliate with a mix of measures as well as policy easing. The Sino-US 6.4 (1.5)
1Q12 1Q13 1Q14 1Q15 1Q16 1Q17 1Q18
relationship is entering a "new normal" in our view. We believe this will be a long-term tension with cycles of talk-fight-talk. The Final consumption (% y/y, ytd, RHS) Gross capital formation (% y/y, ytd, RHS)
second-round effects on global supply chains should also be closely monitored. The trade spat is likely to splinter supply chains, Net exports (% y/y, ytd, RHS) Quarterly real GDP(% y/y, LHS)
with the US's benefiting from core high technology and innovation output and China's from its large, skilled labor force, superior Source: CEIC, UBS, as of 3Q18
infrastructure, and high degree of industrialization. The rest of the world will leverage both, benefiting their own interests.
Positive scenario (Probability: 5%*) Growth acceleration Local government bond issuance accelerated on
• Annual GDP growth accelerates above 6.8% on easing trade tensions and cyclical global growth. Aggregate debt-to-GDP ratio fiscal support
stabilizes. Annual current account surplus increases over USD 100bn. Net new issuance of corporate and local government
Negative scenario (Probability: 15%*) Escalating China-US trade tension bonds
• The US makes good on its threat to impose investment restrictions and tariffs on most Chinese products, introducing a sweeping 1600
25% tariff on some USD 500bn of Chinese imports before 2020. In 2019, China experiences a sharp growth slowdown (5% real 1400
GDP growth for two quarters), and its current account deteriorates fast and turns into a deficit. The CNY slides to 7.5 or even 1200
weaker per USD within a quarter, China's FX reserves fall dramatically, and authorities tighten capital controls. Asian and emerging
1000
market assets sell off.
800
* Scenario probabilities are based on qualitative assessments.
600
Key dates 400
Nov 30 Manufacturing and non-manufacturing PMI for November
200
Dec 8 Trade data for November
0
Dec 9 CPI and PPI data for November
Dec 14 Fixed asset investment, industrial production and retail sales for November -200
Jan-15 Jul-15 Jan-16 Jul-16 Jan-17 Jul-17 Jan-18 Jul-18
Corporate bonds Local government bonds
Source: CEIC, UBS, as of October 2018
For further information please contact CIO China economist Yifan Hu, yifan.hu@ubs.com or CIO analyst Kathy Li, kathy.li@ubs.com 15Swiss economy - 2019 economic outlook weakens
Key points Stronger Swiss growth and inflation ahead
• Switzerland grew by a very solid 0.7% q/q in 2Q18 due to strong net exports. GDP growth for 1Q18 was revised up to 1% q/q. On GDP growth and CPI inflation, with UBS forecasts
the back of these strong 1H18 numbers we expect Swiss GDP to grow by 2.9% this year. 3.5%
• The 2019 outlook for the Swiss economy has deteriorated somewhat, however. Global political risks, a stronger Swiss franc, slower 3.0%
growth in the Eurozone and the lack of catch-up potential may slow GDP growth next year to 1.6%. 2.5%
• Given these risks, we expect a first SNB rate hike in 4Q19 when the ECB is set to increase its target rate. 2.0%
1.5%
CIO view (Probability: 60%*) Robust recovery 1.0%
• Swiss GDP accelerated in 1H18, benefiting from an improvement in foreign trade and investments. This was in turn reflected by 0.5%
stronger labor markets and the output gap was closed.
0.0%
• The outlook for the Swiss economy has clouded somewhat. Political risks (trade tensions, Italian budget discussion and emerging -0.5%
market turmoil), the recent appreciation of the Swiss franc and slower than expected growth in the Eurozone are likely to slow -1.0%
Swiss GDP growth in 2H18 and 2019. We forecast GDP to grow by 1.6% in 2019.
-1.5%
• After strong growth in 1H18 the Swiss economy lacks further catch-up potential, additionally weighing on the 2019 outlook. 14 15 16 17 18E 19E 14 15 16 17 18E 19E
GDP growth Inflation
• Swiss manufacturing PMI fell further in Oct. from 59.7 to 57.4, reflecting the recent appreciation of the Swiss franc and Source: Macrobond, UBS, as of 8 November 2018
heightened uncertainty in the global economy.
• Inflation advanced by 1.1% y/y in October We expect inflation at 1% this year and next year, underpinned by a weaker franc
and higher oil prices.
Output gap was closed in 1H18
• With risks having increased notably in recent months, we don’t see a first rate hike by the SNB before 4Q19 when we also Output gap in % of GDP
expect the ECB to lift its target rate. We only expect FX interventions from the SNB in case the EURCHF exchange rate should fall
3
below the 1.10 mark.
2.5
2
Positive scenario (Probability: 10%*) Eurozone and weaker Swiss franc boost Swiss growth
1.5
• A further drop in Eurozone unemployment leads to a rebound in Europe and shores up domestic demand, which in turn supports
1
Swiss exports.
0.5
Negative scenario (Probability: 30%*) Trade disruptions hurt Swiss growth
0
• Protectionist measures by the Trump administration lead to a global downturn, which would hurt Swiss exports. In addition,
-0.5
increased uncertainty about Italian politics and emerging markets could cause the franc to appreciate.
* Scenario probabilities are based on qualitative assessment. -1
-1.5
Key dates -2
Nov 29 GDP (3Q18) -2.5
Dec 3 PMI manufacturing (Nov) 00 01 02 03 04 05 06 07 08 09 10 11 12 13 14 15 16 17 18
Dec 4 CPI (Nov) Source: Macrobond, UBS, as of 8 November 2018
Nov 13 SNB monetary policy assessment (4Q18)
For further information please contact CIO Swiss economists Alessandro Bee, alessandro.bee@ubs.com or Sibille Duss, sibille.duss@ubs.com. 16Contact List
Global Chief Investment Officer GWM
Mark Haefele
mark.haefele@ubs.com
UBS CIO GWM Global Investment Office
Global Asset Allocation UHNW & Alternatives Investment Themes
Andreas Koester Simon Smiles Philippe G. Müller
andreas.koester@ubs.com simon.smiles@ubs.com philippe-g.mueller@ubs.com
UBS CIO GWM Regional Chief Investment Offices
US APAC EMEA Switzerland Emerging Markets
Mike Ryan Min Lan Tan Themis Themistocleous Daniel Kalt Jorge Mariscal
mike.ryan@ubs.com min-lan.tan@ubs.com themis.themistocleous@ubs.com daniel.kalt@ubs.com jorge.mariscal@ubs.com
17Disclaimer
Generic investment research – Risk information: UBS Chief Investment Office's investment views are prepared and published by Global Wealth Management, a Business Division of UBS Switzerland AG (regulated by FINMA in Switzerland), its subsidiaries or affiliates ("UBS").
The investment views have been prepared in accordance with legal requirements designed to promote the independence of investment research.
This material is for your information only and is not intended as an offer, or a solicitation of an offer, to buy or sell any investment or other specific product. Certain services and products are subject to legal restrictions and cannot be offered worldwide on an unrestricted basis
and/or may not be eligible for sale to all investors. All information and opinions expressed in this material were obtained from sources believed to be reliable and in good faith, but no representation or warranty, express or implied, is made as to its accuracy or completeness (other
than disclosures relating to UBS). All information and opinions as well as any forecasts, estimates and prices indicated are current as of the date of this report, and are subject to change without notice. The market prices provided in performance charts and tables are closing
prices on the respective principal stock exchange. The analysis contained herein is based on numerous assumptions. Different assumptions could result in materially different results. Opinions expressed herein may differ or be contrary to those expressed by other business areas
or divisions of UBS as a result of using different assumptions and/or criteria. In no circumstances may this document or any of the information (including any forecast, value, index or other calculated amount ("Values")) be used for any of the following purposes (i) valuation
or accounting purposes; (ii) to determine the amounts due or payable, the price or the value of any financial instrument or financial contract; or (iii) to measure the performance of any financial instrument including, without limitation, for the purpose of tracking the return or
performance of any Value or of defining the asset allocation of portfolio or of computing performance fees. By receiving this document and the information you will be deemed to represent and warrant to UBS that you will not use this document or otherwise rely on any of
the Information for any of the above purposes. UBS and any of its directors or employees may be entitled at any time to hold long or short positions in investment instruments referred to herein, carry out transactions involving relevant investment instruments in the capacity of
principal or agent, or provide any other services or have officers, who serve as directors, either to/for the issuer, the investment instrument itself or to/for any company commercially or financially affiliated to such issuers. At any time, investment decisions (including whether to
buy, sell or hold securities) made by UBS and its employees may differ from or be contrary to the opinions expressed in UBS research publications. Some investments may not be readily realizable since the market in the securities is illiquid and therefore valuing the investment
and identifying the risk to which you are exposed may be difficult to quantify. UBS relies on information barriers to control the flow of information contained in one or more areas within UBS, into other areas, units, divisions or affiliates of UBS. Futures and Options trading is not
suitable for every investor as there is a substantial risk of loss, and losses in excess of an initial investment may occur. Past performance of an investment is no guarantee for its future performance. Additional information will be made available upon request. Some investments may
be subject to sudden and large falls in value and on realization you may receive back less than you invested or may be required to pay more. Changes in foreign exchange rates may have an adverse effect on the price, value or income of an investment. The analyst(s) responsible
for the preparation of this report may interact with trading desk personnel, sales personnel and other constituencies for the purpose of gathering, synthesizing and interpreting market information. Tax treatment depends on the individual circumstances and may be subject to
change in the future. UBS does not provide legal or tax advice and makes no representations as to the tax treatment of assets or the investment returns thereon both in general or with reference to specific client's circumstances and needs. We are of necessity unable to take into
account the particular investment objectives, financial situation and needs of our individual clients and we would recommend that you take financial and/or tax advice as to the implications (including tax) of investing in any of the products mentioned herein. This material may
not be reproduced or copies circulated without prior authority of UBS. Unless otherwise agreed in writing UBS expressly prohibits the distribution and transfer of this material to third parties for any reason. UBS accepts no liability whatsoever for any claims or lawsuits from any
third parties arising from the use or distribution of this material. This report is for distribution only under such circumstances as may be permitted by applicable law. Forecasts and estimates are current only as of the date of this publication and may change without notice. For
information on the ways in which UBS CIO WM manages conflicts and maintains independence of its investment views and publication offering, and research and rating methodologies, please visit www.ubs.com/research. Additional information on the relevant authors of this
publication and other CIO publication(s) referenced in this report; and copies of any past reports on this topic; are available upon request from your client advisor.
External Asset Managers / External Financial Consultants: In case this research or publication is provided to an External Asset Manager or an External Financial Consultant, UBS expressly prohibits that it is redistributed by the External Asset Manager or the External Financial
Consultant and is made available to their clients and/or third parties. Austria: This publication is not intended to constitute a public offer under Austrian law, but might be made available for information purposes to clients of UBS Europe SE, Niederlassung Österreich, with place
of business at Wächtergasse 1, A-1010 Wien. UBS Europe SE, Niederlassung Österreich is a branch of UBS Europe SE, a credit institution constituted under German Law in the form of a Societas Europaea, duly authorized by the German Federal Financial Services Supervisory
Authority (Bundesanstalt für Finanzdienstleistungsaufsicht, BaFin), and is subject to the joint supervision of BaFin, the central bank of Germany (Deutsche Bundesbank), as well as of the Austrian supervisory authority (Finanzmarktaufsicht, FMA), to which this publication has not
been submitted for approval. Bahrain: UBS is a Swiss bank not licensed, supervised or regulated in Bahrain by the Central Bank of Bahrain and does not undertake banking or investment business activities in Bahrain. Therefore, Clients have no protection under local banking and
investment services laws and regulations. Brazil: Prepared by UBS Brasil Administradora de Valores Mobiliários Ltda, entity regulated by Comissão de Valores Mobiliários ("CVM"). Canada: In Canada, this publication is distributed to clients of UBS Wealth Management Canada by
UBS Investment Management Canada Inc.. China: This report is prepared by UBS AG or its offshore subsidiary or affiliate (collectively as "UBS Offshore"), an entity incorporated outside of China and not licensed, supervised or regulated in China to carry out banking or securities
business or to provide securities investment advice in China. This report shall not be regarded as specific securities related analysis provided by UBS Offshore. The recipient shall not contact the analysts or UBS Offshore for investment advice and should not use this document or
otherwise rely on any information contained in this report in making investment decisions and UBS assumes no responsibility in this regard.Czech Republic: UBS is not a licensed bank in the Czech Republic and thus is not allowed to provide regulated banking or investment
services in the Czech Republic. This material is distributed for marketing purposes. Denmark: This publication is not intended to constitute a public offer under Danish law, but might be distributed by UBS Europe SE, Denmark Branch, filial af UBS Europe SE, with place of business
at Sankt Annae Plads 13, 1250 Copenhagen, Denmark, registered with the Danish Commerce and Companies Agency, under the No. 38 17 24 33. UBS Europe SE, Denmark Branch, filial af UBS Europe SE is a branch of UBS Europe SE, a credit institution constituted under German
Law in the form of a Societas Europaea, duly authorized by the German Federal Financial Supervisory Authority (Bundesanstalt für Finanzdienstleistungsaufsicht, BaFin). UBS Europe SE, Denmark Branch, filial af UBS Europe SE is subject to the joint supervision of the BaFin, the
central bank of Germany (Deutsche Bundesbank) and the Danish Financial Supervisory Authority (DFSA) (Finanstilsynet), to which this document has not been submitted for approval. France: This publication is distributed by UBS (France) S.A., French "société anonyme" with share
capital of € 132.975.556, 69, boulevard Haussmann F-75008 Paris, R.C.S. Paris B 421 255 670, to its clients and prospects. UBS (France) S.A. is a provider of investment services duly authorized according to the terms of the "Code Monétaire et Financier", regulated by French
banking and financial authorities as the "Autorité de Contrôle Prudentiel et de Résolution". Germany: The issuer under German Law is UBS Europe SE, Bockenheimer Landstrasse 2-4, 60306 Frankfurt am Main. UBS Europe SE is authorized and regulated by the "Bundesanstalt für
Finanzdienstleistungsaufsicht". Hong Kong: This publication is distributed to clients of UBS AG Hong Kong Branch by UBS AG Hong Kong Branch, a licensed bank under the Hong Kong Banking Ordinance and a registered institution under the Securities and Futures Ordinance.
Israel: UBS Switzerland AG is registered as a Foreign Dealer in cooperation with UBS Wealth Management Israel Ltd, a wholly owned UBS subsidiary. UBS Wealth Management Israel Ltd is a licensed Portfolio Manager which engages also in Investment Marketing and is regulated
by the Israel Securities Authority. This publication shall not replace any investment advice and/or investment marketing provided by a relevant licensee which is adjusted to your personal needs. Italy: This publication is distributed to the clients of UBS Europe SE, Succursale Italia, Via
del Vecchio Politecnico, 3 - 20121 Milano, the branch of a German bank duly authorized by the “Bundesanstalt für Finanzdienstleistungsaufsicht” to the provision of financial services and supervised by "Consob". Jersey: UBS AG, Jersey Branch, is regulated and authorized by the
Jersey Financial Services Commission for the conduct of banking, funds and investment business. Where services are provided from outside Jersey, they will not be covered by the Jersey regulatory regime. UBS AG, Jersey Branch is a branch of UBS AG a public company limited by
shares, incorporated in Switzerland whose registered offices are at Aeschenvorstadt 1, CH-4051 Basel and Bahnhofstrasse 45, CH 8001 Zurich. UBS AG, Jersey Branch's principal place business is 1, IFC Jersey, St Helier, Jersey, JE2 3BX. Luxembourg: This publication is not intended
to constitute a public offer under Luxembourg law, but might be made available for information purposes to clients of UBS Europe SE, Luxembourg Branch, with place of business at 33A, Avenue J. F. Kennedy, L-1855 Luxembourg. UBS Europe SE, Luxembourg Branch is a branch
of UBS Europe SE, a credit institution constituted under German Law in the form of a Societas Europaea, duly authorized by the German Federal Financial Services Supervisory Authority (Bundesanstalt für Finanzdienstleistungsaufsicht, BaFin), and is subject to the joint supervision
of BaFin, the central bank of Germany (Deutsche Bundesbank), as well as of the Luxembourg supervisory authority, the Commission de Surveillance du Secteur Financier (the "CSSF"), to which this publication has not been submitted for approval. Mexico: This document has been
distributed by UBS Asesores México, S.A. de C.V., a company which is not part of UBS Grupo Financiero, S.A. de C.V. or of any other Mexican financial group and whose obligations are not guaranteed by any third party. UBS Asesores México, S.A. de C.V. does not guarantee any
yield whatsoever. Saudi Arabia: This publication has been approved by UBS Saudi Arabia (a subsidiary of UBS AG), a Saudi Arabian closed joint stock company incorporated in the Kingdom of Saudi Arabia under commercial register number 1010257812 having its registered office
at Tatweer Towers, P.O. Box 75724, Riyadh 11588, Kingdom of Saudi Arabia. UBS Saudi Arabia is authorized and regulated by the Capital Market Authority of Saudi Arabia. Singapore: Please contact UBS AG Singapore branch, an exempt financial adviser under the Singapore
Financial Advisers Act (Cap. 110) and a wholesale bank licensed under the Singapore Banking Act (Cap. 19) regulated by the Monetary Authority of Singapore, in respect of any matters arising from, or in connection with, the analysis or report. Spain: This publication is distributed
to its clients by UBS Europe SE, Sucursal en España, with registered office at Calle María de Molina 4, C.P. 28006, Madrid, entity supervised by Banco de España and the Bundesanstalt für Finanzdienstleistungsaufsicht. UBS Europe SE, Sucursal en España is a branch of UBS Europe
SE, a credit institution constituted in the form of a Societas Europaea authorized and regulated by the Bundesanstalt für Finanzdienstleistungsaufsicht. Sweden: This publication is not intended to constitute a public offer under Swedish law, but might be distributed by UBS
Europe SE, Sweden Bankfilial with place of business at Regeringsgatan 38, 11153 Stockholm, Sweden, registered with the Swedish Companies Registration Office under the Reg. No 516406-1011. UBS Europe SE, Sweden Bankfilial is a branch of UBS Europe SE, a credit institution
constituted under German Law in the form of a Societas Europaea, duly authorized by the German Federal Financial Supervisory Authority (Bundesanstalt für Finanzdienstleistungsaufsicht, BaFin). UBS Europe SE, Sweden Bankfilial is subject to the joint supervision of the BaFin, the
central bank of Germany (Deutsche Bundesbank) and the Swedish financial supervisory authority (Finansinspektionen), to which this document has not been submitted for approval. Taiwan: This material is provided by UBS AG, Taipei Branch in accordance with laws of Taiwan,
in agreement with or at the request of clients/prospects. Thailand: This material was provided to you as a result of a request received by UBS from you and/or persons entitled to make the request on your behalf. Should you have received the material erroneously, UBS asks that
you kindly delete the e-mail and inform UBS immediately. The material may not have been reviewed, approved, disapproved or endorsed by any financial or regulatory authority in your jurisdiction. The relevant investments will be subject to restrictions and obligations on transfer
as set forth in the material, and by receiving the material you undertake to comply fully with such restrictions and obligations. You should carefully study and ensure that you understand and exercise due care and discretion in considering your investment objective, risk appetite
and personal circumstances against the risk of the investment. You are advised to seek independent professional advice in case of doubt. UK: Approved by UBS AG, authorised and regulated by the Financial Market Supervisory Authority in Switzerland. In the United Kingdom,
UBS AG is authorised by the Prudential Regulation Authority and subject to regulation by the Financial Conduct Authority and limited regulation by the Prudential Regulation Authority. Details about the extent of our regulation by the Prudential Regulation Authority are available
from us on request. A member of the London Stock Exchange. This publication is distributed to private clients of UBS London in the UK. Where products or services are provided from outside the UK, they will not be covered by the UK regulatory regime or the Financial Services
Compensation Scheme. USA: This document is not intended for distribution into the US, to US persons, or by US-based UBS personnel. UBS Securities LLC is a subsidiary of UBS AG and an affiliate of UBS Financial Services Inc., UBS Financial Services Inc. is a subsidiary of UBS AG.
18You can also read