Hawaiian Electric Industries, Inc - Financial Community Meetings March 1-2, 2021
←
→
Page content transcription
If your browser does not render page correctly, please read the page content below

Hawaiian Electric Industries, Inc.
Financial Community Meetings
March 1-2, 2021

Forward looking statements

Cautionary statements and risk factors that may affect future results

This presentation includes forward-looking statements within the meaning of
the federal securities laws. Actual results could differ materially from such
forward-looking statements. The factors that could cause actual results to
differ are discussed in the appendix that follows this presentation and in HEI’s
SEC filings.

                                                                                   2
HAWAIIAN ELECTRIC INDUSTRIES
Catalyst for a better Hawaii

HEI overview
Hawaii's largest corporation with a diversified platform supplying energy, providing
financial services and investing in a sustainable future

                                                                                                       Kauai       2
                                                                                                                          Oahu 29

                                                                                                               1                   4
                                                                                                                                         Molokai 1
                                                                                                                                              Maui
                                                                                                           Utility               Lanai               6
                                                                                                          service
                                                                                                          territory
                                                                                                                                               1         Hawaii
                                                                                                           Bank                                                   4
                                                                                                         branches1
                                                                                                                                                                  1
                                                                                                          Pacific
                                                                                                          Current
                                                                                                          projects

                                                                                         75% (Utility)                     3,702
                                                                    8%                                                                             Hawaii-
            $3.8B                       3.9%                                             25% (Bank)
                                                                                                                       Full time employees
                                                             5-year total return                                         (Including 2,579          focused
      Market   capitalization2      Dividend   yield2       (CAGR%) for period
                                                                                            Subsidiary                utility employees and
                                                              ending 12/31/20                                                                 Serving the full state
                                                                                        contributions to net                 1,074 bank
                                                                                              income3                        employees)

  Data above as of 12/31/20 unless otherwise indicated.
  1 Bank branches as of 2/15/21.
  2 Market capitalization and dividend yield are based on the closing price of $34.96 on 2/26/21.
  3 Based on LTM 12/31/20 earnings to common shareholders and excludes other companies’ net loss.
                                                                                                                                                                       4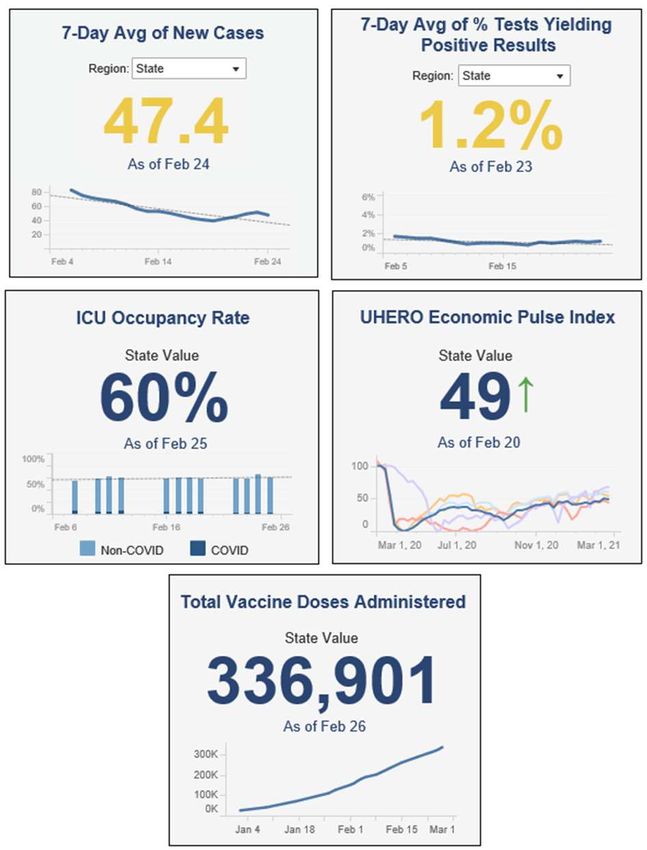
ESG is in our DNA
Strength of our companies is inextricably linked to the health of our
environment, economy and communities
Focused on achieving state’s 100% renewable energy and carbon
neutrality goals in a way that is safe, reliable, resilient and affordable for
customers
Embedded
in Core Investing in Hawaii’s economic growth; fostering innovation and
Strategies entrepreneurship to diversify and expand state economy; advancing
affordability and financial fitness
Advancing Hawaii’s sustainability goals through investment in clean
energy, water, wastewater and agriculture
Integrating ESG even further into our governance structures, decision-making
processes and reporting
Published first SASB-aligned ESG report Sept. 2020
Deepening
ESG Future reporting to include ESG materiality assessment and TCFD-aligned
Integration disclosures
Deepening ESG integration into business, processes and governance
Focused on ESG topics that drive long-term value creation
5
2020 highlights
WHAT WE ACCOMPLISHED
Financial stability enabled HEI companies to serve as a source of strength for
customers and communities during pandemic
Record charitable commitments of $5.5 million ($3.5 million related to COVID),
more than double typical annual giving
Development of constructive performance-based regulation (PBR) framework in
collaboration with stakeholders, providing stable financial foundation for utility
and incentive-based alignment on priorities
Robust efficiency initiatives at utility to deliver customer savings
Aggressively advanced utility-scale renewable procurements and integrated more
customer-sited resources; exceeded 2020 30% RPS milestone
Bank supported customers with PPP loans, fee waivers and loan deferrals while
maintaining strong liquidity, capital and credit risk management
Achieved record deposit growth, residential mortgage production, and mortgage
banking income; cost of funds at all-time low of 9 bps in 4Q20
Pacific Current portfolio continues to grow and reflect sustainability focus
Issued first consolidated HEI ESG report, aligned with SASB
6
2020 utility achievements

                                • Nation-leading residential rooftop solar penetration
                                   − 20% of all residential customers; ~36% of Oahu single family homes
 Cost-effective
                                • Aggressively advanced utility-scale renewable procurements
 clean energy
 portfolio                         − Stage 1 and Stage 2 projects filed or pending filing have potential to add ~657 MW
                                     of solar and ~3GWh of storage by ~2023
                                • Exceeded 2020 statutory renewable portfolio milestone of 30%
                                • Recognized by Electric Power Research Institute for leadership and innovation in
                                  power delivery and utilization and generation technology1
 Customer                       • Advanced expansion of 235 MW Community Based Renewable Energy program with
 experience &                     proposed RFPs for LMI customers and large projects
 innovative
 energy                         • Filed innovative “green tariff” supporting University of Hawaii net-zero goal and
 solutions                        increasing renewable energy for the state
                                • Launched Quick Connect program to accelerate pace of customer solar and storage
                                  interconnections
                                • Pledged an all-electric utility light-duty fleet by 2035
 Modern grid &                  • Proposed eBus and commercial EV make-ready infrastructure pilot projects
 technology                     • Progressed deployment of advanced meters
 platform
                                • PUC approved company’s 50-year contract to own, operate and maintain electric
                                  distribution system serving the U.S. Army’s 12 installations on Oahu

                                                                                                                          7
1 2020 Technology Transfer Awards, Electric Power Research Institute.
2020 utility achievements (cont’d)

                  • Intensive stakeholder engagement is core to Integrated Grid Planning process;
Stakeholder
                    focused on developing recommendations and identifying investment priorities for
engagement
                    resilience, grid and resource needs

                  • Collaborated with stakeholders on development of Performance-based Regulation
Regulatory          (PBR) framework
transformation    • Final PBR order aims to balance range of interests to enhance customer experience,
                    improve utility performance and advance societal outcomes

Strengthen        • Implemented comprehensive COVID-19 protocols to keep employees, customers
safety and          and community safe
culture           • Increased employee engagement and continued focus on One Company approach

Maintain          • Improved utility return on equity included impact of strong cost efficiency program
financial         • Sustainable cost efficiencies achieved through improved planning/coordination of
strength            work, managed staffing reductions, process improvements and strategic sourcing

        Developed new 2021-25 strategic plan to advance decarbonized and resilient system,
 drive economic and societal change, strengthen company culture, be a trusted energy partner and
                                   enhance financial strength

                                                                                                          8
2020 bank achievements:
Executing well in a tough environment
                 • Operated 70% of branches during height of pandemic (most among peers)
                 • Timely PPP origination and funding supporting 4,100 businesses and 40,000+ jobs
Delivering for   • Extensive customer accommodations, including deferments and fee waivers
customers        • Deployed new full function ATMs (complete 1Q21) and contactless debit cards
                 • Adoption of non-branch transactions rose from 19% pre-COVID to 40% at Dec. 2020
                 • Consolidated 8 branches; 3 others temporarily closed

                 • Information security and infrastructure reliability; enabling remote work environment
Investing in     • Upgrades and improvements critical to future Anytime Anywhere Banking model
technology         – Website; online / mobile capabilities; marketing automation; online mortgage applications
                 • Additional deployments for 2021

                 • Strong capital and liquidity position
Maintaining      • Record deposit growth (18%), residential mortgage origination ($1.2B); mortgage banking
financial          income ($24M), and low cost of funds (9 bps)
strength         • Conservative credit risk management and strong provisioning; Low net charge-offs and
                   delinquencies

Protecting our   • American Banker Best Banks to Work For (only Hawaii bank listed)
teammates &      • Hawaii Business Best Places to Work (12th consecutive year)
ASB culture      • WELL Health & Safety Rating for ASB Campus facility (1st in Hawaii)

Supporting our   • Support of community “Kahiau” partners
island           • Enabled successful Hawaii Restaurant Card program to deploy CARES funds
community        • Launched innovative Parks for People program with Trust for Public Lands
                                                                                                                 9
Transition to Anytime, Anywhere banking
Accelerating digital transformation to make banking even easier for customers
•                  Customers adopted digital options at accelerated pace during pandemic
•                  High levels of customer satisfaction with digital offerings
•                  Refocusing branch footprint to enhance multi-channel options for customers
                   −   Consolidated branch network to 42 branches, 8 closures
                   −   Opening Digital Centers this spring

                                ATM & Online Self-Service Rise                               Net Promoter Score
               105,000                                                        100
                   95,000                                          93,310      95
                                                                               90
                   85,000
                                                                               85
    ATM & Online

                   75,000                                                      80
                   65,000                                                      75
                   55,000                                         51,861
                                                                               70
                                                                               65
                   45,000
                                                                               60
                   35,000                                                      55
                   25,000                                                      50
                            Jan Feb Mar Apr May Jun Jul Aug Sep Oct Nov Dec         2Q19     3Q19   4Q19   1Q20   3Q20    4Q20
                                             2020       2019                               Branches      CBC       eBanking

                                                                                                                                 10
Performance-based Regulation (PBR)
PBR: Constructive framework designed to balance
range of interests
    Guiding              Regulatory             Priority
                                                                                  Balancing of Interests
   Principles              Goals               Outcomes

                                           • Affordability      •   Cost control and affordability – Annual Revenue
                                           • Reliability            Adjustment (ARA) and shared-savings mechanisms
  A customer-            Enhance
                                           • Interconnection        (SSMs)
centric approach,        customer
                         experience          experience         •   Customer equity – Low-to-moderate income (LMI)
 including day 1
     savings                               • Customer               energy efficiency PIM
                                             engagement
                                                                •   Interconnection experience and customer
                                                                    engagement -- Interconnection PIM
                                                                •   GHG reduction and accelerated renewable energy
  Administrative
                                           • Cost control           additions – RPS-A PIM
    efficiency
     to reduce           Improve           • DER asset
                         utility             effectiveness
                                                                •   Innovation – Streamlined pilot approval and recovery
regulatory burdens
                         performance                                process
   for utility and                         • Grid investment
   stakeholders                              efficiency         •   Grid investment efficiency – Grid services PIM,
                                                                    exceptional project interim recovery mechanism (EPRM)
                                                                •   Administrative efficiency – 5-year rate period

  Utility financial                                             •   Utility financial integrity --
       integrity                       •    Capital formation       − Eliminates elements of structural regulatory lag
 to maintain utility’s   Advance       •    Customer equity
                         societal                                   − Establishes new revenue opportunities via PIMs,
   financial health,                   •    GHG reduction
including access to      outcomes                                       SSMs, pilot process, opportunity to recover both
                                       •    EoT                         capital and O&M projects under EPRM
   low-cost capital
                                       •    Resilience
                                                                    − Provides safeguards against extreme results

                                                                                                                           12
New PBR framework
Retains or enhances many existing mechanisms
Pre-PBR mechanisms Change under PBR
3-year rate plan 5-year rate plan
Revenue Annual revenue adjustment (ARA)
adjustment Accounts for inflation, productivity improvements (set at zero), material events outside
mechanism (RAM) utility control, customer dividend. Jan. 1 accrual begins 2022, removing former RAM lag
Major project Exceptional Project Recovery Mechanism (EPRM)
interim recovery Continues to provide recovery for extraordinary projects; expanded to cover O&M
expense projects and programs (not just capex). Provides for pro-rated full project
(MPIR) cost recovery first year project in service
Remain in place
Existing cost Includes purchased power adjustment clause; energy cost recovery clause; renewable
trackers energy infrastructure, demand side management, demand response recovery
surcharges, pension tracker
Performance
incentive Additional PIMs added
New PIMs designed to drive progress on priority outcomes in addition to previous PIMs
mechanisms (PIMs)
Symmetrical earnings sharing mechanism
Earnings sharing No earnings sharing within +/-300bps deadband of allowed ROE of 9.5%; 50-50 sharing
above allowed ROE within +/-150bps outside of deadband, 90-10 sharing thereafter
Decoupling Remains in place
Pilot projects New pilot process
Encourages innovation with expedited approval process and up to $10M annual cost
(ad hoc approval) 13
recoveryAnnual revenue adjustment mechanism formula
Annual target revenues set with ARA during 5-year MRP
Annual revenue adjustment formula:
i-factor x-factor z-factor customer dividend
Accounts for Productivity Ex post Two components:
annual inflation factor opportunity to
recover costs for (i) 0.22% adjustment
• Measured by • Initially set at 0% exogenous
Gross ~$2.1M in annual revenues
events
Domestic beginning 20211 and
Product Price • Review and compounds over time
Index (GDPPI) approval
+
determined on
case-by-case (ii) management audit
basis savings commitment
made in Hawaiian Electric
2020 rate case, approved by
PUC at $6.6M/yr through
2025
1 Year one (2021) $2.1M based on 2020 target revenues.
14Efficiency remains a core focus
• Accelerated delivery of management audit savings in 2021
• Ongoing efficiencies needed under ARA
− Focus on keeping O&M growth below inflation and offsetting costs that rise faster than inflation (i.e., audit
fees, insurance premiums, healthcare benefits)
• Utility cost savings plan:
− Reduced overtime through improved scheduling, coordination
− Managed reductions in workforce (3% reduction in 2020; first year in 3-year plan)
− Process improvements
− Strategic sourcing
− Reduction of office footprint
O&M excluding pension, 2019 – 2021E
($ millions)
$422
$414
~$409
2019 2020 2021E 15Performance incentive mechanisms (PIMs)
incentivize performance on key outcomes
Maximum PIM rewards / (penalties) in $mm—Annual unless otherwise specified
Existing PIMs (pre-PBR) PBR-established PIMs
$8.0
See next
$6.0
page for
$4.0 RPS-A
$6.5 PIM
$2.0 $3.7 $3.0
$1.4 $1.5 $2.0 $2.0
$0.0 $0.5
($1.4) ($0.9)
($2.0) ($3.4) ($3.4) ($3.7)
($4.0)
($6.0) Fuel cost LMI
Call Demand RFP stage Inter- Grid AMI
SAIDI SAIFI risk energy
center response I1 connection services2 utilization
sharing efficiency2
• Additional PIMs to be developed, including in other dockets, with potential target of 150-200
PIMs and bps upside3
SSMs under • Non-wires alternative shared savings mechanism (SSM): Will allow utility to share in 20-30% of
development savings from utilization of non-wires alternatives
• Renewable procurement SSM: Commission will continue to provide renewable energy procurement
rewards (similar to previous RFP PIMs). May be available for utility self-build projects
1 RFP Stage 2 excluded due to immaterial potential reward in 2021.
2 Amount shown is amount that can be earned over two years.
3 As stated in PUC’s PBR D&O, PUC set initial new PIMs at “conservative” level relative to Phase 1 Staff Proposal’s 150-250 bps potential PIM portfolio to
provide ”room” for future PIMs and/or SSMs to be developed. 16RPS-A PIM rewards accelerated renewable
energy growth
RPS-A PIM potential grows as Stage 1 & Stage 2 RFP projects come online
• Projects filed or pending filing have potential to add ~657 MW of solar and ~3 GWh of
storage by ~2023
Statutory RPS1 PBR RPS-A3 ($ millions)
$16.0 Estimated ranges for RPS-
Annual targets interpolated between A PIM4
statutory RPS milestone dates and % $14.0
Measured as % of sales represented
• 31% in 2021, 32% in 2022, ..., 39%
by renewable energy
in 2029 $12.0
• 40% in 2030, 43% in 2031, …, 67% $7 - $14
in 2039 $10.0
• Etc.
Grid Scale RE + Customer Grid Scale RE + Customer $8.0
Sited RE RPS- Sited RE
RPS = $6.0
A= Total Net Generation +
Utility Sales
Customer RE $4.0
Rewards for outperformance: $0.1 - $5
Penalty for underperformance:
$2.0
2021-22: $20/MWh
$20/MWh penalty for every MWh
2023: $15/MWh $0 - $0.8
deficient under RPS milestone2 $0.0
2024+: $10/MWh
2021 2022 2023
1 Legislative mandate under HRS §269-92. RPS-A4 RPS-A4 RPS-A4
2 Penalty may be reduced at PUC discretion.
3 PIM established in Order No. 37507 of PBR Docket.
4 RPS-A PIM ranges shown are approximations based on current assumptions on renewables project commercial operation dates and total generation 17
and may change as project completion timelines shift.2021 reflects PBR transition
• Earnings opportunities increase as PBR mechanisms fully implemented, utility achieves accelerated customer savings
commitment, projects are approved under EPRM and new pilot program, and RPS-A PIM potential grows with addition of
Stage 1 & 2 RFP projects
• In Final PBR D&O, Commission stated: “….while the Phase 1 Staff Proposal had indicated a potential PIM Portfolio of
approximately 150-200 basis points…the value of the initial portfolio approved in this D&O is more conservative, to provide
‘room’ to accommodate future PIMs and/or SSMs that may be developed in the Post-D&O Working Group and/or in other
proceedings.”
2020
2020 • Dec. 23 PUC Phase 2 PBR D&O
2021 • Jan. 1 Elements of PBR effective:
− EPRM (broadened to include both capital and O&M investment) Ongoing
− RPS-A, grid services and interconnection PIMs
• Jan. 15 PUC decision clarifying management audit savings delivery
• Jan – May Working group to develop detailed tariffs, finalize
scorecards, reporting metrics • Evaluation
and
• Jun. 1 Additional PBR elements and tariffs effective, including:
development
− ARA
of additional
− AMI utilization and LMI energy efficiency PIMs
PIMs
− Pilot project approval process
− Symmetrical earnings sharing
• Review of
− Scorecards, reporting metrics
PBR
2022 • Jan. 1 Former RAM lag eliminated with ARA accrual framework
2024 Comprehensive review of PBR framework
18COVID Response
Hawaii COVID case update
                                                                                                      Hawaii Daily New Cases (statewide total)
                                                                               400

                                                                               350

                                                                               300

                                                                               250

                                                                               200
                                                                                                             New cases
                                                                               150

                                                                               100

                                                                                50              7-day average

                                                                                  0
                                                                                   3/26        4/26   5/26    6/26   7/26     8/26    9/26 10/26 11/26 12/26 1/26   2/26

                                                                                               Average daily case rate in last 7 days, per 100K residents
                                                                                                                            (as of 2/26/21)

                                                                                              0 – 5.5
                                                                                              8 – 12.9
                                                                                              14 – 16.7
                                                                                              17.1 – 19.7
                                                                                              20.2 – 26.6
                                                                                              27.6 – 46.4

                                                                                   Guam (lowest): 1.6
                                                                                   National average: 20.2
                                                                                   New York City (highest): 46.4

Sources: Centers for Disease Control and Prevention, CovidPau.org, Honolulu Star Advertiser
                                                                                                                                                                    20
Hawaii economy on path to recovery
Dec. 2020 vs Full year 2020 vs
Dec. 2019 full year 2019
Total arrivals -75.2% -73.8%
Tourism 15,000 Reopening of 9,565
Tourism 10/15/201
10,000
5,000
-
10/20 11/20 12/20 01/21 02/21
• Dec. 2020 – Hawaii: 9.3%; U.S.: 6.7%
Unemployment • Hawaii unemployment peaked Apr. 2020 at 23.8%
• 2021 UHERO unemployment forecast: 10.9%
Median price Jan. 2021 vs Oahu sales volume Jan.
Jan. 2020 Jan. 2020 2021 vs Jan. 2020
Real Estate Single family homes $883,000 14.7% 9.8%
Condominiums $452,000 5.4% 3.4%
2019A 2020E 2021E 2022E
Real State GDP
1.2% -10.2% 0.1% 5.2%
400 Hawaii Daily New Cases (statewide total)
• Statewide 7-day average: 300
44
COVID-192 • Daily new cases 47 200 7-day average
• Positivity rate 1.2%; 8.9% nationwide 100
• ~14.1% of state population vaccinated 0
3/26 4/26 5/26 6/26 7/26 8/26 9/26 10/26 11/26 12/26 1/26 2/26
Sources: University of Hawaii Economic Research Organization (UHERO), U.S. Bureau of Labor Statistics, State of Hawaii Dept. of Business, Economic Development and Tourism,
Dept. of Labor and Industrial Relations, Title Guaranty Hawaii.
1 Pre-travel testing program implemented 10/15/20. 21
2 As of 2/26/21. Sources: Center for Disease Control, State of Hawaii Dept. of Health, Johns Hopkins University.Financial update
HEI is well positioned to weather COVID impacts

• Consolidated enterprise comprised of stable operating subsidiaries in
  essential industries

• Robust liquidity position enterprise-wide

• Our financial strength enables us to help our customers and community
  through challenging period

• Focused on protecting our employees, assisting our customers and
  supporting our community

• Uninterrupted dividends through every business cycle since 1901, including
  through 2008 – 09 Great Recession

• Dedicated and experienced management team

                                                                               23
Full year 2020 financial performance
Net Income (GAAP) Diluted EPS (GAAP) Consolidated LTM ROE
($ in millions)
$217.9 $1.99
$197.8 $1.81 9.8%
$89.0 $57.6 $0.81 $0.53
Full
year 8.6%
$156.8 $169.3 $1.43 $1.55
($27.9) ($29.1) ($0.26) ($0.27)
$66.3 $0.61
$50.5 $0.46
$28.2 $0.26
Q4 $15.7 $0.14
$45.4 $43.0 $0.41 $0.39 2019 2020
Utility 7.8% 8.1%
($7.3) ($8.2) ($0.07) ($0.08)
2019 2020 2019 2020 Bank1 13.5% 8.1%
Utility Bank Holding Co. & Other
Note: Columns may not foot due to rounding.
1 Bank ROE based on daily weighted average common equity. 24Hawaiian Electric: A source of strength as
Hawaii recovers
CONSISTENTLY POWERING OUR STATE FOR OVER 129 YEARS
Well positioned to serve as a source of strength, supporting Hawaii’s recovery
Fully decoupled, with revenues adjusted for load decline impacts
Good recovery mechanisms
Deferral of COVID-related costs
Multi-year efficiency program underway
Continued progress during COVID
• Final PBR decision issued Dec. 2020
• Stage 2 renewable RFP process advancing
Leader in clean energy, addressing
aggressive climate goals
25Full year 2020 utility financial highlights
($ in millions)
UTILITY NET INCOME KEY UTILITY EARNINGS DRIVERS,
AFTER-TAX FAV/(UNFAV)
2020
vs
2019
Rate adjustment mechanism revenues 17
Operations and maintenance1 6
$169.3 Interest expense 3
$156.8
Major Project Interim Recovery mechanism
2
revenues
Depreciation (5)
2019 2020 Enterprise Resource Planning system benefits to
(4)
be returned to customers
Allowance for funds used during construction (4)
Fuel handling and fuel related, net of Energy Cost
(2)
Recovery Clause recovery
1 Includes pension related expenses
26American Savings Bank: Conservatively
managed bank with strong financial position
SERVING HAWAII THROUGH OVER 95 YEARS OF ECONOMIC CYCLES
Prudent risk management is foundation of our management approach
Earning assets 100% funded by
core and low-cost deposits
Diverse, high quality loan portfolio with active
relationship monitoring and management
Loan portfolio predominantly (~79%/84% excl. PPP)1 secured
by or with recourse to stable Hawaii real estate at conservative loan-to-value
Oahu property value resilience protects the downside; tested through
the Great Recession
Healthy capital and liquidity positions, regularly tested against adverse
stress scenarios
Modest exposure to industries most impacted by COVID
Efficiency a core focus
27
1 For quarter ending 12/31/20.Full year 2020 bank financial highlights
($ in millions)
BANK NET INCOME
KEY BANK EARNINGS DRIVERS,
AFTER-TAX FAV/(UNFAV)
$5.51 2020
vs
2019
$89.0
Net interest income (11)
$5.22
Provision for credit losses3 (20)
$57.6
Noninterest income 4
Noninterest expense (5)
2019 2020
Key components of year-over-year earnings drivers:
• Noninterest income increased 7% year over year primarily due to record residential mortgage production
• Noninterest expense increased 3% year over year primarily due to $5.1 million of COVID-19 related expenses
1 Includes impact of after-tax gain of $5.5 million related to sales of properties, net of exit costs to transition to new campus. For full year 2019, the net gain on sale was comprised
of after-tax gain on sales of properties of $7.9 million and after-tax campus transition costs of $2.4 million.
2 Includes impact of after-tax gain of $5.2 million related to the sale of Visa Class B shares in 2Q20.
3 2020 includes $38.5M in COVID-19 related reserves (pre-tax). 28Lower funding cost and recognition of PPP fees
partially soften the impact of lower rate environment
YIELD ON EARNING ASSETS (%) NET INTEREST MARGIN (%)
5.00 5.00 4.50
ASB
ASB
4.50 4.50 4.00 Avg Top 3 HI Peers
Avg Top 3 HI Peers
4.00 4.00 3.85
4.14 3.50
3.50 3.50 3.12
3.22
3.77
3.00 3.20
3.00 3.00
2.99 2.84
2.50 2.50 2.50
2.00 2.00 2.00
2019 3/31/2020 6/30/2020 9/30/2020 12/31/2020 2019 3/31/2020 6/30/2020 9/30/2020 12/31/2020
COST OF FUNDS (%) Actual PPP Ex. PPP
0.70 0.70 3Q20 Reported NIM 3.12% 2.89 3.14
0.60 ASB 0.60 Impact of lower rate
0.50 Avg Top 3 HI Peers 0.50 environment and (0.13%) -- (0.15%)
portfolio mix
0.40 0.49 0.40
Amortization of PPP
0.07% 1.73% -
0.30 0.30 processing fees
0.20 0.29 0.20 Decrease in interest
0.10 bearing liability funding 0.06% -- 0.06%
0.10 0.10 cost
0.09
0.00 0.00 4Q20 Reported NIM
2019 3/31/2020 6/30/2020 9/30/2020 12/31/2020
3.12% 4.62% 3.05% 29Significant ACL coverage increase reflects
elevated credit risk from COVID…not yet realized
ALLOWANCE FOR CREDIT LOSSES (ACL)1
($ in millions)
ACL: 1.90%
$105
$95
$85 $101.2
$75 $49.8
$65 $19.4 $21.4
ACL: 1.04%
$55
$45
$35 $53.4
$25
$15
ACL - 12/31/19 Day 1 CECL 2020 NCOs 2020 Provision for ACL - 12/31/20
adjustment Credit Losses
2019 2020 Change
Beginning ACL balance $52.1 $53.4 $1.3
DAY 1 CECL adjustment $0.0 $19.4 $19.4
Provision $23.5 $49.8 $26.3
Less: NCOs ($22.2) ($21.4) $0.8 NCOs lower than in 2019
Ending ACL balance $53.4 $101.2 $47.8
1 Excludes provision for unfunded loan commitments; reserve for unfunded loan commitments is classified in other liabilities on balance sheet and excluded from ACL.
30Bank loan portfolio: Conservative profile,
concentrated in real estate-secured
($ in millions)
Loan portfolio characteristics
2.9% 2.3% 0.3%
~79% of portfolio secured by real estate (84% excl. PPP)
3.2%
C&I represent ~14% of total loans (9% excl. PPP)
14.3%
Personal unsecured loans represent ~3% of loans
40.6%
As of 12/31/20, 1% of portfolio on active deferral
$5,345 $ in millions December 31,**2020
% of total
loans
Residential mortgage 2,171 40.6%
18.4% Home equity 963 18.0%
Commercial real estate 984 18.4%
Commercial construction 121 2.3%
Real Estate Secured 4,239 79.3%
18.0%
Commercial & industrial 766 14.3%
Residential mortgage Home Equity National syndications 171 3.2%
Commercial Real estate Commercial & Industrial Total Commercial 937 17.5%
Personal unsecured loans 155 2.9%
National Syndications Personal Unsecured Loans
Other consumer 14 0.3%
Commercial Construction Other Consumer Total Consumer 169 3.2%
Total Loans 5,345
31Bank liquidity and capital remain strong
ASB is not expected to require capital from HEI
Access to large amounts of secured ASB has over $273M of excess equity
funding above the “well capitalized” level
Secured funding available ($ in millions)
$3,686 Capital Ratio1 Tier 1 leverage2
$3,000 As of 12/31/20 8.38%
$1,576
**
$704
“Well capitalized” 5.00%
Minimum requirements 4.00%
$2,266
$2,068
12/31/2019 12/31/2020
FHLB line Unencumbered securities FRB Discount window
1 Effective with the March 2020 Call Report, elected to delay the impact of CECL on regulatory capital for two years followed by a three-year transition period.
2 Effective with the June 2020 Call Report, under the CARES Act provision and the Community Bank Leverage Ratio (CBLR) framework, capital adequacy is measured solely through
the Tier 1 leverage ratio. Under the interim rules, the minimum CBLR will be 8% through 2020, 8.5% for 2021 and 9% thereafter.
32HEI financing outlook 2021
(as of February 16, 2021)
2021 HOLDING COMPANY SOURCES & USES OF CAPITAL
($ in millions)
~$245 ~$245
Both bank and utility
remain net cash flow HC Expense,
providers to holding ~$30
company; Bank Debt Issuance,
dividend increases HEI Investments ~$95
in Utility, ~$65
No external equity
required in 2021
Utility
Balance sheet remains Dividends,
Investment grade Shareholder ~$110
Dividends ~$150
ASB Dividends,
~$40
Uses Sources
Note: Numbers in chart are rounded to nearest multiple of 5 million.
33HEI 2021 EPS guidance
(as of February 16, 2021)
HEI EPS: $1.75 - $1.95 PER SHARE
UTILITY EPS: $1.53 - $1.61 BANK EPS: $0.52 - $0.62
KEY ASSUMPTIONS: KEY ASSUMPTIONS:
• With limited exception, PBR changes effective • Flat to low single digit earning asset growth
Jun. 1, 2021 • NIM: ~2.90% to 3.15%
• Existing cost trackers remain in place • Provision expense: $17 million to $25 million
• Full recovery of COVID19-related expenses • ROA: >0.70%
• Capex of $335 to $355 million • Resuming dividends to HEI of $35 to $45
• Conservative initial implementation of new million
PIMs and no meaningful PIMs contribution • Noninterest expense flat to down
• O&M excluding pension1 down ~1% • Guidance does not assume any release of
−
Assumes accelerated achievement of loan loss reserves
management audit savings
• Equity capitalization at approved rate case
levels
No new equity issuances in 2021
Targeting consistent dividend growth in line with earnings growth
Long-term dividend payout ratio target of 60-70%
Note: Holding company and other net loss estimated at $0.28 - $0.30.
1 Alsoexcludes O&M expenses covered by surcharges or by third parties that are neutral to net income.
Reference the cautionary note regarding forward-looking statements (FLS) accompanying this presentation which provides additional information on important factors that could
cause results to differ. The company undertakes no obligation to publicly update or revise FLS, including EPS guidance, whether as a result of new information, future events, or 34
otherwise. See also the FLS and risk factors in HEI’s SEC form 10-K for the year ended December 31, 2019 and HEI’s other periodic reports.Advancing Hawaii’s sustainable future
Committed to ambitious climate goals

Hawaii’s goals of 100% RPS and carbon                                                       Exceeded 2020 RPS milestone of 30%
neutrality by 2045 are among most                                                                                2020 RPS = 34.5%
ambitious in the nation                                                                     40%

                                                                                            35%                                                                  35%

                                                                                            30%
                                                                                                                                                             28%(1)
                                                                                                                                                   27% 27%
                                                                                                                                             26%
                                                                                            25%
                                                                                                                                       23%
                                                                                                                                   21%
                                                                                            20%
                                                                                                                             18%

                                                                                            15%
                                                                                                                        14%
                                                                                                                  12%

                                                                                            10%     9% 10%10%

                                                                                             5%

                                                                                             0%
                                                                                                   2008 2009 2010 2011 2012 2013 2014 2015 2016 2017 2018 2019 2020

1 2018 and 2019 RPS achievement impacted by outage of Hawaii Island’s geothermal resource, third-party owned Puna Geothermal Venture (PGV), beginning in May 2018 due to
  Kilauea volcanic eruption. 2018 and 2019 RPS achievement would have been 29% and more than 31%, respectively, had PGV produced at same level as 2017.

                                                                                                                                                                           36
Path to a 100% renewable, carbon neutral future
Leading a community-wide transformation
• Advancing Hawaii’s largest-ever renewable energy and storage
Aggressively procuring procurements
renewable energy & storage • Helping enable end of coal in Hawaii in 2022, additional fossil
plant retirement in 2024
• Core to achieving our goals
Growing distributed energy • Integrating nation’s highest percentage of rooftop solar and
resources (DER) seeking to add more
• Broadening access with community-based renewable energy
• Committed to 100% light duty fleet by 2035
Accelerating electrification of
• Proposed make-ready infrastructure pilots, continuing public
transportation (EoT) charging deployment, evolving EV rate design
• Implementing Grid Modernization Strategy to integrate more
Modernizing our grid renewables and DER, provide customer options and enhance
reliability and resilience
Evolving our regulatory • New PBR framework intended to facilitate energy transition,
framework align regulatory framework with customer interests, policy goals
• Engaging stakeholders in Integrated Grid Planning, combining
Long-range planning for clean, planning and procurement for generation and T&D
resilient, reliable energy • Resilience a key focus
37Aggressively pursuing clean energy additions
• Procurements underway to increase future RPS achievement
− Procurements significant given system peak load:
Oahu: ~1200 MW, Hawaii Island: ~200 MW, Maui County: ~200 MW
− Stage 1 and Stage 2 RFP projects filed or pending have potential to add ~657 MW of
solar and ~3 GWh of storage by 2023
Stage 1 &
Stage 1: 8 PPAs approved by PUC
2 RFPs
Stage 2: 3 PPAs approved Dec. 2020; 6 PPAs and 2 self-build projects pending
approval
− Filed and revising draft tariffs and draft RFPs for over 235 MW of renewables, with
CBRE
options for LMI customers; Utility able to develop projects, recruit subscribers
− Resumed delivering power to grid under existing PPA; PUC approval of amended and
PGV
restated PPA pending
− PPA with 180 MW coal plant expires Sept. 2022
Fossil
− 37.6 MW Kahului oil-fired plant planned for retirement in 2024
retirements
− Honolulu Power Plant deactivated Jan. 2014
38Encouraging rooftop PV, customer-sited resources
Providing programs and infrastructure to integrate and incentivize DER
Nation’s highest penetration of rooftop solar Cumulative residential PV installations
(in megawatts)
• 20% of all residential customers
Net Energy Metering New DER programs
• 36% of Oahu single family homes
Distributed energy resources (DER) are a key 483.0
element of our plan for achieving 100% RPS 441.6
418.0
• Requires significant investment to modernize the 393.5
grid to ensure reliability 366.2
• Equity a key consideration in program design 309.2
252.1
National leader and innovator in integrating 191.6
high levels of residential rooftop solar
• Managing grid to ensure reliability with high levels
99.2
of variable, intermittent distributed sources
• Using innovative inverter technologies and smart
meters to manage distributed resources
• Expertise routinely sought by other utilities 2012 2013 2014 2015 2016 2017 2018 2019 2020
HECO MECO HELCO
39Renewable energy key to affordability,
bill stability
UTILITY FOSSIL FUEL ENERGY COST CONTRACTED RENEWABLE ENERGY COST
Subject to volatile oil prices Significant reduction in cost of utility-scale renewables
Energy Cost ($/kWh) Pre-2016 PPAs 2016+ PPAs
0.40 Proposed and Approved
0.35
0.30
0.25 12/20111
0.20
0.15 12/2010
12/2020
0.10
0.05
$0.13 - $0.14 $0.19 – $0.23 $0.10 – $0.11 $0.13 - $0.21 $0.11 – $0.27 $0.08 - $0.11 $0.122 $0.08 - $0.13
0.00
Oil Wind Solar Geothermal Solar + Storage
1 The 2011 fuel oil increase was largely driven by the nuclear disaster of the Fukushima power plant in March 2011 which increased the price of oil in
Hawaii as our fuel oil purchases are largely driven by the Asia Pacific market. 40
2 Assumes dispatch at same level as in 2017. Pricing based on amended and restated PPA, which is pending PUC approval.Renewables, reliability and resilience drive
capital investment
CAPITAL EXPENDITURES FORECAST RATE BASE FORECAST
4-Year CAGR ~4-5%
($ millions) ($ millions)
$3,950-
$3,750- $4,100
$450 $400-450 $350- $450 $3,650- $3,900
$411 3,700
$335-355 $3,545
$335 $3,425
$3,212
2018A 2019A 2020A 2021E 2022E 2023E 2018A 2019A 2020A 2021E 2022E 2023E
Actual Forecast Forecast Forecast Recovery
Key Capex Projects 1 2020 2021 2022 2023 Mechanism
Investments drive average base earnings
Grid Modernization Phase I $11 $17 $16 $15 EPRM growth of 4-5% from 2022 as base year
Grid Modernization Phase II $9 $26 EPRM
(excludes potential PIMs rewards)
Army Privatization $21 $4
Contractual • Every dollar spent has identified recovery
(on and of)
Maui and Hawaii Island
mechanism
$7 $54 $16 EPRM
BESS Projects
Waena Switchyard / • Baseline projects recovered through ARA
Kahului Synchronous $3 $24 $4 EPRM
Condensers • EPRM and REIP provide above-ARA
Major Projects ~$7 ~$16 ~$6 EPRM recovery for approved capital and O&M
projects
Baseline Projects $324 ~$300-$320 ~$300-$320 ~$300-$320 ARA
Note: Capital expenditure figures are net of contributions in aid of construction (CIAC).
1 Key projects listed may not sum to capex range shown on bar chart.
41Pacific Current provides non-regulated platform
for sustainable infrastructure investment
Drivers Sectors Criteria
Sustainability is the
Technology Technology driver of value
Renewable Transportation
Power Electrification Long term viability
Climate adaptation ESG-aligned / local
and resilience execution partners
Water & Attractive returns
Agriculture
Waste
Changing consumer
and business usage Community goals &
economic development
42Initial project cash flow funding Pacific Current growth
• Focused on local partnerships and projects consistent with investment grade profile
• Long-term strategy, with modest earnings impact as build Hawaii-based portfolio
− Baseline plan anticipates building to ~$0.03-$0.05 EPS contribution over next 3-4
years
Solar plus battery storage projects at 5
60MW Hamakua Energy Plant, Hawaii Island
campuses in University of Hawaii system
• Critical dispatchable generating resource as island
• 3 campus systems completed; remaining 2 systems
transitions to 100% renewable energy by 2045
scheduled to come online over next few quarters
• Contracted cash flows and non-recourse financing support
investment grade profile • Contracted cash flows and non-recourse financing
support investment grade profile
• Accretive from outset, expected to continue over contract
life • Investment-grade counterparties: University of Hawaii
(off-taker); Johnson Controls (EPC contractor)
• ~20% of fuel supplied by locally produced biodiesel
6MW Solar Facility on Kauai Other renewable investments
• Built and proven project with no construction risk and • Smaller scale renewable energy projects support
contracted cash flows under 20-year PPA (12 years community’s transition to a clean energy future
remaining) • EverCharge partnership focuses on charging
• Non-recourse financing at attractive fixed rate infrastructure in multi-unit dwellings, seeks to further
catalyze EV adoption
• Counterparty (offtaker): Kauai Island Utility Cooperative
• Investments provide tax credits, optimizing HEI’s tax bill
43Appendix
Hawaii economic forecast

•      UHERO forecast (base case) projects meaningful Hawaii economic recovery starting
       mid-2021
•      Recent positive COVID-19 vaccine developments have potential to accelerate recovery
       −      10.8% of Hawaii population vaccinated as of 2/15/21
•      Hawaii to receive at least $1.7 billion from second COVID-19 pandemic relief bill

                                        Hawaii Economic Research Organization (UHERO) forecast2
                                                    2020                                       2021                                2022
    Scenario                        Pessimistic     Base          Optimistic   Pessimistic     Base    Optimistic   Pessimistic    Base    Optimistic

    Real GDP (millions 2019$)       85,769        85,950          85,902       82,649         86,018   89,571       87,300        90,450   93,011
       YoY % change                   -10.4        -10.2           -10.3         -3.7          0.1       4.3           5.6         5.2       3.8
    Total visitor arrivals by air
    (thousands)
                                     2,554         2,667           2,707        2,835          4,410    5,848        6,901        8,152     8,510

       YoY % change                   -75.4        -74.3           -73.9         11.0          65.4     116.0        143.5         84.9      45.5
    Real personal income
    (millions 2019$)
                                    84,054        84,168          84,183       75,402         77,406   79,561       76,688        78,629   80,329

       YoY % change                    4.1          4.3             4.3          -10.3         -8.0      -5.5          1.7         1.6       1.0
    Unemployment rate (%)             12.8          12.7            12.4         14.2          10.9      8.2           8.2         5.6       4.9

1 The Council on Revenues, 1.8.21.
2 UHERO, Mainland COVID-19 Surge Means a Bleak Winter, But Vaccines Promise 2021 Growth, 12/11/20.                                                      45
Debt maturities1 & credit ratings
($ in millions)
HEI Hawaiian Electric Pacific Current
Pacific Current: ~$4 - $6 million debt payment each year
$1,600
Credit Ratings HEI Hawaiian Electric $42
2
Moody’s Unrated/Positive/P-3 Baa2/Positive/P-2
$1,200
3
S&P BBB-/Positive/A-3 BBB-/Positive/A-3
$800 $1,370
4
Fitch BBB/Stable/F3 BBB+/Stable/F2
**
$400
$5
$6
$5 $52 $6
$150 $100 $47 $150
$50 $50 $6 $50
$0
2021 2022 2023 2024 2025 Thereafter
to 2050
Note: Debt balances do not reflect debt issuance costs of ~ $10 million.
1 Debt maturities data as of 12/31/20.
2 Source for ratings: Dec. 2020 (HEI and Hawaiian Electric) Moody’s reports
3 Source for ratings: Feb. 2020 (HEI) & Jul. 2020 (Hawaiian Electric) S&P reports
4 Source for ratings: Aug. 2020 (HEI & Hawaiian Electric) Fitch reports
46Solid enterprise-wide capital and liquidity position
Modest 2021 long-term debt maturities
Liquidity and balance sheet strong
prefunded
($ in millions)
Utility and bank expected to be self-funding in
Liquidity as of 12/31/2020
2020, with strong stand-alone balance sheets HEI HECO
Credit facility capacity $150.0 $275.0
Recent financings demonstrate strong investor CP balance ($65.0) -
demand, further enhance liquidity and prefund Unrestricted cash $0.3 $47.4
Private placement available draw capacity $75.0 $115.0
2021 long-term debt maturities: Liquidity $160.3 $437.4
• HEI: $50M delayed draw private placement
prefunds 1Q21 debt maturity; priced $75M
private placement (upsized from $65M) **
• Hawaiian Electric: Executed $115M
52
delayed draw private placement to finance
capex
Pre-funded
Private placements have early draw features to $100
enhance liquidity $150
Long-term commitment to investment grade 50 $50
ratings
2021 2022 2023
HEI HECO
Note: 2021 maturities also include $65M at HEI and $50M at HECO
from 364-day term loans (not shown above).
47Utility LTM ROE
4Q20 CONSOLIDATED UTILITY ROE
ROE (%)
① ② ③ ④ ⑤ ⑥ ⑦ ⑧
Structural Lagged
48Hawaiian Electric: Current authorized rates
Hawaiian Electric1 Hawaii Electric Light Maui Electric
(Oahu) (Hawaii Island) (Maui County)
Return on Average
9.50% 9.50% 9.50%
Common Equity
Common Equity
57.15% 56.83% 57.02%
Capitalization
Average Rate Base $1,993 million $534 million $454 million
Date Authorized 10/22/20 7/28/20 5/16/19
1 Hawaiian Electric 2020 rate case final D&O received on Oct. 2020: removed 90% cap on Schofield generating station cost recovery; ended 2017 rate
case customer benefit adjustments; enterprise Resource Planning system benefits deemed flowed through to customers.
49New PIMs and shared savings mechanisms (SSMs)
create additional earnings opportunities
Summary Upside / downside
Interconnection Rewards and penalties based on utility ability to reduce +$3M / -$0.9M
approval PIM approval time to interconnect DER systemsRPS-A PIM reward calculation
2021 RPS-A Renewable
2020 RPS 2020 RPS-A 2020 Total 2019 2021 RPS-A
Renewable Generation
(%) (%) Generation Renewable Target
Generation Shortfall
(GWH) Generation (%)
Threshold (GWH)
(GWH)
(GWH)
[F] = [C] x [G] = [F] –
[A] [B] [C] [D] [E]
[E] [D]
34.5% 28.4% 9,851 2,801 31% 3,054 253
Year 2020 RPS (%) 2020 RPS-A (%)
[A] [B]
2016 25.8% 22.7%
2017 26.8% 23.3%
2018 26.7% 23.1%
2019 28.4% 23.9%
2020 34.5% 28.4%
Grid Scale RE + Customer Grid Scale RE + Customer
Sited RE RPS- Sited RE
RPS =
A= Total Net Generation +
Utility Sales
Customer RE 51Status of key open dockets
Subject and description Docket # Latest development Next milestone
Performance-based regulation 2018-0088 PUC issued Phase 2 D&O Dec. 23, 2020 Tariff Development. Post D&O Working Group.
Proceeding to evolve regulatory framework to better align with PUC issued Order granting the Companies’ Motion for Annual Filing Cycle
customer interests and state clean energy policy Partial Clarification and/or Reconsideration on Jan. 15, 2021
Stage 2 RFP 2017-0352 Grid services contracts filed in July. Two self-build Companies to execute and file renewable and
Sought up to ~900 MW of new renewables and over 500 GWh applications and nine renewable and storage contracts filed. storage contract for remaining project, complete
of storage, as well as grid services PUC approved three renewable and storage contracts in PUC proceedings for projects pending approval
Dec. 2020 and complete Interconnection Requirements
Studies for all projects
Integrated Grid Planning (IGP) 2018-0165 Stakeholder and community engagement substantially Grid needs assessment ongoing. IGP inputs
Next phase of long-range planning, combining planning and complete. Filed update on work plan and schedule on Jan. and assumption to be filed by end of 1Q21
procurement of traditional and non-traditional resources 19, 2021
Grid Modernization 2017-0226; PUC reviewing Companies’ proposed changes to meter Company plans to file supplemental application
Plans for implementing new technologies to increase 2018-0141; deployment process for ADMS and deployment of sensors and field
utilization of DER while improving grid reliability and resiliency 2019-0327 devices 1Q21
Electrification of Transportation 2018-0135 Company filed Sch EV-J and EV-P Pilot Program Tariffs Consumer Advocate to file Statement of
Establishes EV-J and EV-P Charging Service to support the 2020-0152 Sept. 2020 Position Feb. 2020
development of EV technology
Community Based Renewable Energy 2015-0389 Filed proposed final tariffs and RFPs for LMI customers in PUC order on proposed tariffs and LMI and
Phase 2 program capacity expanded to 235 MW Sept. and proposed final RFPs for large projects in Dec. Large RFPs pending
2020
E-Bus and Commercial make-ready infrastructure 2020-0098 Company filed reply SOP in E-Bus make-ready proceeding E-Bus make-ready pilot ready for decision
Support make-ready infrastructure, enable and accelerate 2020-0202 in Jan. and Commercial make-ready (Charge Ready Hawaii) making. Parties filing Charge Ready Hawaii
electrification of bus fleets application Dec. 2020 Pilot procedural schedule in Feb. 2020
COVID-19 Deferral Accounting Treatment 2020-0069 In Jun. 2020 PUC approved deferral of costs related to PUC order on extension of cost deferral period
Request to defer costs associated with COVID-19 pandemic pandemic through year end 2020. Filed request for pending. Cost recovery request to be filed as
extension of deferral period through Jun. 2021 separate application
COVID-19 Extending Suspension of Termination or 2020-0209 In Dec. 2020 PUC extended suspension of service Monthly reporting to commence Feb. 2021 in
Disconnection of Regulated Utility Service and disconnection due to non-payment to Mar. 31, 2021 addition to ongoing quarterly reporting
Establishing Reporting Requirements
Extends disconnection of services
DER Policies 2019-0323 Initial Advanced Rate Design proposal filed in Dec. 2020 Final proposals for Advanced Rate Design due
Investigates Distributed Energy Resources (DER) as they Mar. 2021 & Program Track due May 2021
relate to the Hawaiian Electric Companies
52Quality bank balance sheet and loan portfolio
ASB1 Investment Portfolio Sectors
Average yield on earning assets 3.22% Corporates Mortgage Revenue
2% Bonds
Average cost of funds 0.09%
1%
Return on avg. equity2 8.58%
Government
Backed
97%
Core 100% of
ASB Loans
Loans Deposits loans 73%
62% 81% Investment Portfolio Ratings
funded
with low A- or higher Non-rated
cost core 2% 1%
deposits
Equity 13%
Investment Certificates of
Investment Securities 12% Deposit 15%
Securities 26%
Equity 9%
Certificates of AAA
Other 12% Deposit 7% 97%
Other Liabilities 3%
PEER BANKS3
Investment Core Other Median of avg. yield Median of avg.
Loans Other CD’s Equity ROAE
Securities deposits Liabilities on earning assets cost of funds
72% 16% 12% 68% 13% 8% 11% 3.66% 0.50% 10.73%
Source for peer data: SNL Financial (based on data available as of 2/10/21).
Columns may not foot due to rounding.
1 For quarter ending 12/31/20.
2 Bank return on average equity calculated using weighted average daily common equity.
3 For quarter ending 9/30/20. Peer group based on publicly traded banks and thrifts between $4B and $9B in total assets. 53Bank real estate secured portfolio characteristics:
Conservative profile w/ low LTVs
As of 12/31/20 $230 / $121 / ($ in millions)
5% 3%
$754 /
Commercial real estate 18% $2,171 /
51%
Represents 21% of overall loan portfolio
$754M CRE investor & $230M CRE owner
occupied
Wtd avg LTV: 59.1%
97% of CRE portfolio is located in Hawaii
$963 /
23%
Home equity **
Represents 18% of overall loan portfolio Residential mortgage
Home equity
76% Oahu, 10% Maui, 7% Big Island, 7% Kauai Commercial investor
Wtd. avg FICO Score: 763 CRE owner-occupied
Commercial construction
Wtd avg LTV: 55%
% in 1st lien position: 57% / $549M Residential mortgage
% in 2nd lien position: 43% / $414M
Represents 41% of overall loan portfolio
Number of loans: ~17,300
68% Oahu, 20% Maui, 8% Big Island, 4% Kauai
Wtd. avg FICO Score: 763
LTV: 53%
Avg loan size: ~$310,000
Number of loans: ~6,900
54Bank national syndication risk characteristics
Admin & Consumer NR
Healthcare Supp Staples $4 / 2% A-
$7 / 4% $5 / 3% $4 / 3% $13 / 8%
BB+
Retail $9 / $44 / 26%
5%
BBB+
$39 / 23%
$171 $171
Manufacturing
$33 / 19% BBB-
REIT $113 $41 / 24% BBB
/ 66% $30 / 17%
National syndication
Represents ~3% of overall loan portfolio
72% or ~$123M rated investment grade by S&P
66% or $113M to real estate investment trusts
4% or $7M exposure to healthcare
As of 12/31/20 ASB had not received any payment
deferral requests on any national syndication loan
55Bank consumer loan portfolio characteristics
Consumer Portfolio Composition Personal Unsecured Loans
704 ($ in millions) $250
702 $200
700 $150
68% 698 $100
696 $50
694 $-
12/31/2019 3/31/2020 6/30/2020 9/30/2020 12/31/2020
Personal unsecured loans Personal line of credit PUL - Balance PUL - FICO
**
Residential construction Land
Clean energy loans Other consumer Personal unsecured loan risk characteristics
100% Hawaii originated loans
Represent 68% of consumer loan portfolio
Wtd avg. FICO score: 700
Wtd avg. yield: 14.5%
Annualized net charge-off 4Q20: 5.6%
As of 12/31/20, granted payment deferrals of $31MM to
~3,800 personal unsecured customers
56Bank commercial & industrial portfolio:
Modest exposure to highly-impacted industries
($ in millions)
Commercial & Industrial (ex. National
Syndication)
• Commercial portfolio is
Health Care and Social Assistance
well diversified with
highest concentration to
Construction
Health Care & Social
Other Assistance of $90M or
Other Services (except Public 12% of commercial &
Administration) industrial portfolio
Accommodation and Food Services (excluding national
Real Estate Rental and Leasing syndication portfolio)
Professional, Scientific, and **
Technical Services • Accommodation and retail
Transportation and Warehousing most heavily impacted by
COVID-19
Wholesale Trade
Finance and Insurance • As of 12/31/20, active
Administrative and Support and payment deferrals totaled
Waste Management and… $2M to two C&I customers
Retail Trade
$- $20 $40 $60 $80 $100
Low Moderate Elevated
Risk Risk Risk
57Net charge-offs & level of classified loans remain
stable through COVID period
($ in millions)
Provision for Credit Losses1 and Net Charge-Offs
Provision for Credit Losses Net Charge-Offs Net Charge-Offs to Average Loans Stable Credit Trends
$16 $14.5 $14.6 Net charge-offs to average loans
improved from prior year despite
$12 $10.8 negative impacts of COVID; 0.40% in
$9.9 2020 vs 0.45% in 2019
$8.7
$7.7
$8 $6.9 $6.6
0.69% $5.6
$5.3 $5.6 Classified loans totaled $145 million
$4.7 $4.3 $4.9
$3.6 $3.3 as of yearend. ACL to classified loans
$4 70% at YE 2020 vs. 45% at YE 2019
0.29% 0.49%
0.39% 0.41% 0.44%
0.32% 0.36%
$0 Increase in coverage ratio reflects
1Q19 2Q19 3Q19 4Q19 1Q20 2Q20 3Q20 4Q20 additional credit loss risk related to
COVID. ACL increased from 1.4%2
ACL to Classified Loans last year to 1.9% in 2020
$200
Classified Loans ACL to Classified Loans Ratio of allowance for credit losses to
classified loans improved from 45% in
$144 $145
2019 to 70%
$150 $138 $136
$126
$119 $116 $112
$100
73% 70%
66% 67%
1 Excludes provision for unfunded loan
$50
commitments; reserve for unfunded loan
45% commitments is classified in other liabilities on
39% 41% 42%
balance sheet and excluded from ACL.
$0
1Q19 2Q19 3Q19 4Q19 1Q20 2Q20 3Q20 4Q20 2 Includes $19.4 million CECL Day 1 adjustment. 58Loan deferrals declining
• 1% of portfolio on active deferral as of 12/31/20
• Majority of customers on pandemic-related payment deferrals have resumed payments,
with approximately 1% requiring further assistance through repayment modifications
• Previously deferred loan delinquency = 1.1%; overall portfolio delinquency = 0.4%
DEFERRED LOANS
($ in millions)
$725.7
13% of portfolio
Average of 3
largest Hawaii
$309.2 peers =
4.2%
$181.3 $65.2
$416.5 3% of portfolio 1% of portfolio
$79.6
$39.9
$101.7
$25.3
2Q20 3Q20 4Q20
Commercial Consumer 592020 ASB peer group
Bancorp, Inc. TBBK Enterprise Financial Services Corp EFSC Sandy Spring Bancorp, Inc. SASR
FB Financial Corporation FBK Veritex Holdings, Inc. VBTX Financial Institutions, Inc. FISI
Meta Financial Group, Inc. CASH Heritage Financial Corporation HFWA Washington Trust Bancorp, Inc. WASH
First Financial Bankshares, Inc. FFIN Westamerica Bancorporation WABC Tompkins Financial Corporation TMP
W.T.B. Financial Corporation WTBF.B Dime Community Bancshares, Inc. DCOM Central Pacific Financial Corp. CPF
Century Bancorp, Inc. CNBK.A Camden National Corporation CAC Community Trust Bancorp, Inc. CTBI
Carolina Financial Corporation CARO National Bank Holdings Corporation NBHC Allegiance Bancshares, Inc. ABTX
First Bancorp FBNC TrustCo Bank Corp NY TRST Bridge Bancorp, Inc. BDGE
Triumph Bancorp, Inc. TBK ConnectOne Bancorp, Inc. CNOB First of Long Island Corporation FLIC
BancFirst Corporation BANF Lakeland Financial Corporation LKFN Univest Financial Corporation UVSP
First Foundation Inc. FFWM First Commonwealth Financial Corporation FCF Park National Corporation PRK
Seacoast Banking Corporation of Florida SBCF Southside Bancshares, Inc. SBSI Lakeland Bancorp, Inc. LBAI
City Holding Company CHCO QCR Holdings, Inc. QCRH Midland States Bancorp, Inc. MSBI
Great Southern Bancorp, Inc. GSBC Horizon Bancorp, Inc. HBNC Northfield Bancorp, Inc. NFBK
1st Source Corporation SRCE S&T Bancorp, Inc. STBA OceanFirst Financial Corp. OCFC
TriCo Bancshares TCBK Kearny Financial Corp. KRNY Boston Private Financial Holdings, Inc. BPFH
Republic Bancorp, Inc. RBCA.A Brookline Bancorp, Inc. BRKL Flushing Financial Corporation FFIC
HomeStreet, Inc. HMST ServisFirst Bancshares, Inc. SFBS Eagle Bancorp, Inc. EGBN
Meridian Bancorp, Inc. EBSB Peapack-Gladstone Financial Corporation PGC Hanmi Financial Corporation HAFC
TriState Capital Holdings, Inc. TSC Bryn Mawr Bank Corporation BMTC
Note: Based on publicly traded banks, savings and thrifts in the U.S. that have total average assets between $4 billion and $9 billion for the years 2017-2019 (based upon
data available in SNL as of April 3, 2020). Any institution whose business is not directly comparable with ASB or did not have data present for all 3 years was excluded. The
peer group is updated annually and banks that no longer report as a separate entity (e.g. mergers, acquisitions, failed banks, etc.) are not included in the median calculations
from the time of the transaction or failure.
60Cautionary note regarding forward looking statements This presentation made by Hawaiian Electric Industries, Inc. (HEI) and Hawaiian Electric Company, Inc. (Hawaiian Electric) and their subsidiaries contain “forward-looking statements,” which include statements that are predictive in nature, depend upon or refer to future events or conditions and usually include words such as “will,” “expects,” “anticipates,” “intends,” “plans,” “believes,” “predicts,” “estimates” or similar expressions. In addition, any statements concerning future financial performance, ongoing business strategies or prospects or possible future actions are also forward-looking statements. Forward-looking statements are based on current expectations and projections about future events and are subject to risks, uncertainties and the accuracy of assumptions concerning HEI and its subsidiaries (collectively, the Company), the performance of the industries in which they do business and economic, political and market factors, among other things. These forward-looking statements are not guarantees of future performance and actual results and financial condition may differ materially from those indicated in the forward-looking statements. Risks, uncertainties and other important factors that could cause actual results to differ materially from those described in forward-looking statements and from historical results include, but are not limited to, the following: • international, national and local economic and political conditions—including the state of the Hawaii tourism, defense and construction industries; the strength or weakness of the Hawaii and continental U.S. real estate markets (including the fair value and/or the actual performance of collateral underlying loans held by ASB, which could result in higher loan loss provisions and write-offs); decisions concerning the extent of the presence of the federal government and military in Hawaii; the implications and potential impacts of future Federal government shutdowns, including the impact to our customers to pay their electric bills and/or bank loans and the impact on the state of Hawaii economy; the implications and potential impacts of U.S. and foreign capital and credit market conditions and federal, state and international responses to those conditions; the potential impacts of global and local developments (including global economic conditions and uncertainties, unrest, terrorist acts, wars, conflicts, political protests, deadly virus epidemic or other crisis); the effects of changes that have or may occur in U.S. policy, such as with respect to immigration and trade; and pandemics; • the extent of the impact of the COVID-19 pandemic, including the duration, spread, severity and any recurrence of the COVID-19 pandemic, the duration and scope of related government orders and restrictions, the impact on our employees, customers and suppliers, and the impact of the COVID-19 pandemic on the overall demand for the Company’s goods and services, all of which could be affected by the pace of distribution, administration, and efficacy of the COVID-19 vaccine, as well as the proportion of the population vaccinated; • citizen activism, including civil unrest, especially in times of severe economic depression and social divisiveness, which could negatively impact customers and employees, impair the ability of the Company and the Utilities to operate and maintain its facilities in an effective and safe manner, and citizen activism and stakeholder activism could delay the construction, increase project costs or preclude the completion, of third-party or Utility projects that are required to meet electricity demand, reliability objectives and RPS goals; • the effects of future actions or inaction of the U.S. government or related agencies, including those related to the U.S. debt ceiling or budget funding, monetary policy, trade policy and tariffs, energy and environmental policy, and other policy and regulatory changes advanced or proposed by President Biden and his administration; • weather, natural disasters (e.g., hurricanes, earthquakes, tsunamis, lightning strikes, lava flows and the increasing effects of climate change, such as more severe storms, flooding, droughts, heat waves, and rising sea levels) and wildfires, including their impact on the Company’s and Utilities’ operations and the economy; • the timing, speed and extent of changes in interest rates and the shape of the yield curve, which could result in lower portfolio yields and net interest margin; • the ability of the Company and the Utilities to access the credit and capital markets (e.g., to obtain commercial paper and other short-term and long-term debt financing, including lines of credit, and, in the case of HEI, to issue common stock) under volatile and challenging market conditions, and the cost of such financings, if available; • the risks inherent in changes in the value of the Company’s pension and other retirement plan assets and ASB’s securities available for sale, and the risks inherent in changes in the value of the Company’s pension liabilities, including changes driven by interest rates; • changes in laws, regulations (including tax regulations), market conditions, interest rates and other factors that result in changes in assumptions used to calculate retirement benefits costs and funding requirements; • the impact of the Dodd-Frank Wall Street Reform and Consumer Protection Act of 2010 (Dodd-Frank Act) and of the rules and regulations that the Dodd-Frank Act requires to be promulgated, as amended by the Economic Growth, Regulatory Relief and Consumer Protection Act; • increasing competition in the banking industry (e.g., increased price competition for deposits, or an outflow of deposits to alternative investments, which may have an adverse impact on ASB’s cost of funds); • the potential delay by the Public Utilities Commission of the State of Hawaii (PUC) in considering (and potential disapproval of actual or proposed) renewable energy proposals and related costs; reliance by the Utilities on outside parties such as the state, independent power producers (IPPs) and developers; and uncertainties surrounding technologies, solar power, wind power, biofuels, environmental assessments required to meet renewable portfolio standards (RPS) goals and the impacts of implementation of the renewable energy proposals on future costs of electricity; 61
You can also read