HSBC Asia Seminar for Investors and Analysts - Day 3 afternoon presentations - HSBC Group
←
→
Page content transcription
If your browser does not render page correctly, please read the page content below
HSBC Asia Seminar for Investors and Analysts
Day 3 afternoon presentations

Date: 11 April 2018
HSBC Asia Seminar for Investors and Analysts

Important notice and forward-looking statements
 Important notice
 The information, statements and opinions set out in this presentation and subsequent discussion do not constitute a public offer for the purposes of any applicable law or
 an offer to sell or solicitation of any offer to purchase any securities or other financial instruments or any advice or recommendation in respect of such securities or other
 financial instruments.
 The information contained in this presentation and subsequent discussion, which does not purport to be comprehensive nor render any form of financial or other advice,
 has been provided by HSBC Holdings plc and its subsidiaries (the “Group”) and has not been independently verified by any person. No responsibility, liability or
 obligation (whether in tort, contract or otherwise) is accepted by the Group or any member of the Group or any of their affiliates or any of its or their officers, employees,
 agents or advisers (each an “Identified Person”) as to or in relation to this presentation and any subsequent discussions (including the accuracy, completeness or
 sufficiency thereof) or any other written or oral information made available or any errors contained therein or omissions therefrom, and any such liability is expressly
 disclaimed.
 No representations or warranties, express or implied, are given by any Identified Person as to, and no reliance should be placed on the accuracy or completeness of
 any information contained in this presentation, any other written or oral information provided in connection therewith or any data which such information generates. No
 Identified Person undertakes, or is under any obligation, to provide the recipient with access to any additional information, to update, revise or supplement this
 presentation or any additional information or to remedy any inaccuracies in or omissions from this presentation.

 Forward-looking statements
 This presentation and subsequent discussion may contain projections, estimates, forecasts, targets, opinions, prospects, results, returns and forward-looking
 statements with respect to the financial condition, results of operations, capital position and business of the Group (together, “forward-looking statements”). Any such
 forward-looking statements are not a reliable indicator of future performance, as they may involve significant assumptions and subjective judgements which may or may
 not prove to be correct and there can be no assurance that any of the matters set out in forward-looking statements are attainable, will actually occur or will be realised
 or are complete or accurate. Forward-looking statements are statements about the future and are inherently uncertain and generally based on stated or implied
 assumptions. The assumptions may prove to be incorrect and involve known and unknown risks, uncertainties, contingencies and other important factors, many of
 which are outside the control of the Group. Actual achievements, results, performance or other future events or conditions may differ materially from those stated,
 implied and/or reflected in any forward-looking statements due to a variety of risks, uncertainties and other factors (including without limitation those which are referable
 to general market conditions or regulatory changes). Any such forward-looking statements are based on the beliefs, expectations and opinions of the Group at the date
 the statements are made, and the Group does not assume, and hereby disclaims, any obligation or duty to update, revise or supplement them if circumstances or
 management’s beliefs, expectations or opinions should change. For these reasons, recipients should not place reliance on, and are cautioned about relying on, any
 forward-looking statements. No representations or warranties, expressed or implied, are given by or on behalf of the Group as to the achievement or reasonableness of
 any projections, estimates, forecasts, targets, prospects or returns contained herein. Additional detailed information concerning important factors that could cause actual
 results to differ materially is available in our Annual Report and Accounts for the fiscal year ended 31 December 2017 filed with the Securities and Exchange
 Commission on Form 20-F on 20 February 2018 (the “2017 20-F”).
 This presentation contains non-GAAP financial information. The primary non-GAAP financial measure we use is ‘adjusted performance’ which is computed by adjusting
 reported results for the period-on-period effects of foreign currency translation differences and significant items which distort period-on-period comparisons. Significant
 items are those items which management and investors would ordinarily identify and consider separately when assessing performance in order to better understand the
 underlying trends in the business. Reconciliations between non-GAAP financial measurements and the most directly comparable measures under GAAP are provided in
 the 2017 20-F and the Reconciliations of Non-GAAP Financial Measures document which are both available at www.hsbc.com.
 Information in this presentation was prepared as at 6 April 2018.
HSBC Asia Seminar for Investors and Analysts

Day 3 afternoon presentations

 Business Corridors, Belt and Road              03

 ASEAN introduction, panel discussion and Q&A   20

 Sustainable finance                            35

 Closing remarks                                46

 Appendix                                       49

 Glossary                                       52
Business Corridors, Belt and Road
11 April 2018

Mukhtar Hussain
Chief Executive Officer, Malaysia
Business Corridors, Belt and Road

Agenda

 HSBC’s network – strength of the franchise

 Overview of the Belt and Road Initiative

 HSBC’s unique positioning as the “Go to Bank” for BRI
Business Corridors, Belt and Road: HSBC’s network – strength of the franchise

Our global presence allows us access to c.90% of global trade and capital
flows

HSBC footprint
                                               Home       Priority    Network   Rep office

                                                                                             67      countries and territories

                                                                                                     Our network covers

                                                                                             90
                                                                                                     countries accounting for
                                                                                                     more than 90% of global
                                                                                                     GDP, trade and capital
                                                                                                 %   flows

                                                                                                     Our international

                                                                                             50
                                                                                             >   %
                                                                                                     network supports
                                                                                                     more than 50% of our
                                                                                                     client revenue

                                                                                                     Inter-connected global

                                                                                             4       businesses share
                                                                                                     balance sheets and
                                                                                                     liquidity in addition to
                                                                                                     strong commercial links

                                                                                             25       China desks

                                                                                                                                 5
Business Corridors, Belt and Road: HSBC’s network – strength of the franchise
Trade flows increasingly centred around Asia, helped by BRI
Global 20 top trade corridors1 Key takeaways
2010 2030E
3x Further integration in ASEAN,
USD10.0tn RCEP2, as well as the Belt and
Road initiative are expected to
USD6.5tn 14
deliver additional trade growth in
USD4.0tn Asia
USD2.1tn 12
Mainland China expects its annual
Top 20 Asia at No. of Top 20 Asia at No. of trade with the more than 65
corridor value either end corridors corridor value either end corridors
countries along the Belt and Road
routes to surpass USD2.5 trillion
14 of Global 20 top trade corridors by 2030 will have Asia at either end1 in the next decade, up from about
USDbn USD1 trillion in 20153
2010-30 8% 8% 9% 5% 20% 6% 12% 9% 3% 12% 9% 10% 6% 11% Activity arising from these corridors
CAGR:
1,303
to drive urbanisation, which will
1,158 have a material impact on
640
regional economic growth
536 462
321 305 284 279 262 261 249 205 199
UAE
USA
India-
India-
China-
HK
China-
USA
China-
China-
China-
Australia-
China-
China-
USA
China-
USA
Korea-
Germany
China
Japan-
Korea
China-
Japan
India
Malaysia
Singapore
Vietnam
1. Source: Oxford Economics
2. Regional Comprehensive Economic Partnership accord is a mega-regional trade deal covering 16 countries in the Asia-Pacific region
3. Xi Jinping in 2015 Boao Forum, Xinhuanet, 29MAR15 6Business Corridors, Belt and Road: HSBC’s network – strength of the franchise
Majority of Group priority corridors are related to Asia, especially China
Corridor performance in 2017 has grown three times the rate of GDP and Asia-Pacific growth
HSBC Group priority corridors
(not ranked in terms of revenue size)
1. China ↔ Hong Kong Comparison with selected
2. China ↔ United States market growth rates2:
3. China ↔ Germany
Example
on slide 9 4. China ↔ Australia
5.
6.
China ↔
China ↔
India
Singapore
+ 15%1 GDP growth 2017:
7. China ↔ Malaysia The top 17 Asia
8. China ↔ United Kingdom
9. China ↔ United Arab Emirates
corridors have
grown 15% Y-o-Y
+ 11%1 China 6.8%
10. China ↔ Canada vs. 4.4% Asia-
11. China ↔ Saudi Arabia pacific GDP
The top 25 Hong Kong 3.7%
12. China ↔ France growth
corridors have
13. Hong Kong ↔ United States grown 11% Y-o-Y India 6.7%
14. Hong Kong ↔ United Kingdom vs. 2.9% world
15. India ↔ United Kingdom GDP growth
16. India ↔ United Arab Emirates
17. India ↔ United States Real export growth 2017:
18. United Kingdom ↔ United States
19. Canada ↔ United States China 5.6%
20. Mexico ↔ United States
21. Germany ↔ United States Hong Kong 5.3%
22. Germany ↔ United Kingdom
23. France ↔ Germany India 3.4%
24. France ↔ United Kingdom
25. Saudi Arabia ↔ United States
1. Growth rates exclude FIG
2. HSBC Global Research
7Business Corridors, Belt and Road: HSBC’s network – strength of the franchise
BRI is a part of our execution of the business corridors strategy
Asia’s international revenue growth is led by mainland …with top growth areas of China outbound coming
China…. from countries along the Belt and Road
USDbn, 20171
Y-o-Y growth (%) Y-o-Y growth (%), 2017
Asia inbound from
Saudi Arabia 16
other Regions 13%
Vietnam 12
Asia outbound to
other Regions 13% UAE 10
Indonesia 8
Intra-Asia 8%
Singapore 4
BRI Country
Asia-ex China China on one side of the corridor
1. HSBC data
8Business Corridors, Belt and Road: HSBC’s network – strength of the franchise
A business corridor offers multi-faceted opportunities for a universal bank:
a case study – Australia and China
Business corridor: two-way flows Market trends HSBC response / action
Mainland China is Australia’s top trading partner
with c.AUD155 bn trade volume1; however with
tariffs declining for many goods & services due Gaining ground in cross-border transaction
Goods & services to the ChAFTA2 DEC15 banking, especially for the middle-market8
1
trade Mainland China is a major consumer of hard Recently hired an agri-business specialist to
and soft commodities e.g. taking over half of iron target this sector
and aluminium exports where Australia is the
world’s #1 and #4 exporter, respectively3 Supporting recent expansion of Australian
pharma and med-tech companies in China
Mainland China securing access to
as well as Chinese acquisition of a private
infrastructure technology and mineral resources
healthcare services provider
via M&A
2 Capital flows Mainland China’s 5 year plan in upgrading With a retail branch network and Global
technology across many sectors, including Premier online platform, HSBC has been
healthcare4 growing the RBWM business in Australia.
Australia had c.1.4m tourists from China in Strengthened collaboration between RBWM
2017, up by 12% Y-o-Y5 referrals from China to Australia; develop
Higher education continues to be a strategic the China Australia Mortgage proposition
sector with strong demand seen from mainland
3 Wealth flows China into Australia - up to 38% of total
international students6
Introduced the ‘Significant Investment Visa’
migration scheme during 2012-137
1. Source: Australian Government Department of Foreign Affairs and Trade
2. China Australia Free Trade Agreement
3. HSBC Research; Australia Dept. of Industry, Innovation and Science reports on Aluminium (Dec 2016) and Iron (Dec 2016)
4. The State Council, The People’s Republic of China
5. Tourism Australia
6. Australia Gov Statistics - Based on government statistics, as at DEC17, international students studying Higher education from China made up 38% of total international students
7. Australia Gov
8. East & Partners 19FEB18 HSBC Bank Australia is gaining ground among the middle-market as a preferred transaction banking (TB) provider, as Corporates seek out Cross-Border Payment and International TB capabilities, new 9
research from East & Partners shows. Over the last five years, HSBC expanded its primary relationship transaction banking market share among the Corporate (annual turnover of AUD20-725 million) segment by 17%Business Corridors, Belt and Road: HSBC’s network – strength of the franchise
Case study: HSBC’s ability to support China outbound: Australia
China Communications Construction Co. Ltd (CCCC) is a long-standing GB customer of more than HSBC demonstrated strong international
25 years. Key products provided to this group include GLCM, GTRF, GM, C&L, DCM, Project structuring capability by providing a global
Finance and ECM financing solution given the cross-border nature
HSBC supported CCCC with its 100% acquisition of John Holland Group Pty of the transaction
The transaction represented one of the largest China outbound cross-border acquisitions into HSBC further strengthened itself as a key
Australia and the largest single investment for CCCC banking partner to CCCC through this
CCCC is a leading A&H dual listed company mainly engaging in design and construction of transaction. HSBC is well-positioned to leverage
transportation infrastructure, dredging and heavy machinery manufacturing business its global network and strong connectivity
among various product groups to support
John Holland is one of Australia’s leading engineering, contracting and services providers to CCCC’s future financing needs
infrastructure, energy, resources and transport services sectors
2015 2016 2017
CCCC’s acquisition of CCCC’s acquisition of GLCM provider John Holland Bonding Capital Metro PPP, Host to Host Upcoming NSW PPP
John Holland Group John Holland Group Facility ACT Connectivity Project
AUD1.1bn AUD1bn AUD1bn AUD633m AUD4bn
APR15 APR15 JUL15 MAY16 MAY16 SEP16 2018
HSBC acted as HSBC acted as HSBC was Mandated HSBC acted as HSBC acted as HSBC implemented HSBC looking to
Mandated Lead Mandated Lead as John Holland’s Mandated Lead Mandated Lead Host to Host provide PPP Project
Arranger for CCCC’s Arranger and offshore GLCM partner Arranger for the Arranger, Lender and Connectivity across all Finance and
USD1.1bn bridge loan Bookrunner for John bank. New account extension and reduction Hedge Provider on the countries to automate Receivable Financing to
facility in support of its Holland’s AUD1.0bn 3- subsequently opened in in pricing of John AUD633m project connectivity between support CCCC in its bid
100% acquisition of year syndicated Singapore, Malaysia Holland’s AUD1bn financing for the John Holland and
John Holland Group Pty performance bond to and New Zealand bonding facility AUD713m Capital HSBC
support John Holland Metro PPP in the ACT,
post acquisition to Australia. John Holland
replace bonding lines was 30% equity
available under provider drawn under
Leighton Holding’s
facilities in the
acquisition
10Business Corridors, Belt and Road: Overview of the Belt and Road Initiative
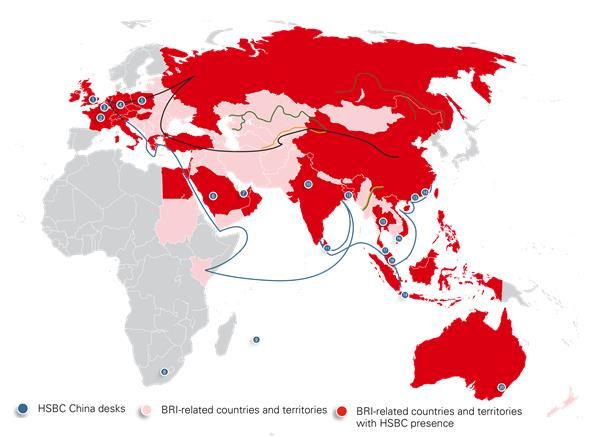
HSBC is well-positioned to capture BRI opportunities
Belt and Road Initiative is made up of “The Silk Road Economic Belt” and “The 21st Century Maritime Silk Road”
Seek to connect > 65 countries across Asia, Middle East, Africa and Europe, c.30% of global GDP and 63% of world population 1
By improving the global infrastructure and network connectivity, mainland China can better facilitate international trade and development
Mainland China’s trade with countries along the Belt and Road is expected to surpass USD2.5trn by 2025 2
BRI countries with
HSBC presence
BRI countries with
HSBC presence and
dedicated China Desk
Committed funding
by multinationals /
policy banks3
Agency Capital
(USDbn)
CDB 890
AIIB 100
SRF 55
NDB 50
CHEXIM 19
1. China Development Bank
2. Xi Jinping in 2015 Boao Forum, Xinhuanet, 29MAR15
3. CDB: China Development Bank; AIIB: Asian Infrastructure Investment Bank; SRF: Silk Road Fund’; NDB: New Development Bank; CHEXIM: Export-Import Bank of China 11Business Corridors, Belt and Road: Overview of the Belt and Road Initiative
Initial opportunities arising from BRI will be focused on significant
infrastructure investments…
USD26tn (USD1.7tn p.a.) of infra-structure
investments forecasted to 20301 in Asia HSBC strengths in infrastructure projects
Infrastructure investment, by sub-region
HSBC provides a full suite of investment banking services, including advisory
East Asia and financing solutions to our clients in the infrastructure sector
12%
South Asia 2%
Southeast Asia 0% Infrastructure and Real Estate Group (IRG) leads HSBC’s infrastructure
24% coverage and has over 200 personnel globally in key hubs, including London,
Central Asia 61% New York, Hong Kong, Singapore, Paris and Dubai
The Pacific
HSBC’s expertise is well recognised in the industry and was awarded ‘Best
BRI bank’ (AsiaMoney) and ‘Best Financial Adviser Asia Pacific’ (Infrastructure
Journal 2017)
Forecast investment spend to 2030
USDtn2 Notable transactions
Indonesia 2.7
Jul 2017 France Apr 2017 China
Phillipines 0.9
Thailand 0.8
Malaysia 0.7 EUR375m USD5bn
Financial Adviser to China Multi-tranche bond offering
Singapore 0.7 Eastern Airlines on its
acquisition of a 10% stake in Joint Global Coordinator,
Vietnam 0.7 Air France-KLM Sole Rating Adviser, Joint
Lead Manager, Joint
Others 0.5 Sole Financial Adviser Bookrunner
1. ADB estimate. Climate adjusted estimate. Without climate change mitigation and adaptation costs, USD22.6tn will be needed, or USD1.5tn per year (baseline estimate). Definitions and source data are different to those shown in
the Sustainable Finance presentation
2. Source: Mckinsey “Southeast Asia at the crossroads: Three paths to prosperity” 12
3. For 25 economies with adequate data, comprising 96% of the region’s population.
4. The difference between investment needs and current investment levelsBusiness Corridors, Belt and Road
HSBC infrastructure capabilities
HSBC provides a full suite of HSBC offers comprehensive infrastructure solutions Notable transactions
investment banking services,
Dec 2017 UK Jul 2017 France
including advisory and Infrastructure Broad knowledge of the industry and in-depth
financing solutions to our understanding of the business through our dedicated
Advisory
Power & Utilities teams
clients in the infrastructure
sector Strategic direction lead for each sub-sector globally GBP555m EUR375m
Renewables
International network providing M&A advisory and Acquisition of 30% stake in Dudgeon Financial Adviser to China Eastern
IRG Group leads HSBC’s Transport, Services & capital market solutions to our clients offshore wind farm from Statkraft Airlines on its acquisition of a 10%
Logistics stake in Air France-KLM
infrastructure coverage and
has over 200 personnel Infrastructure Acquisition
globally in key hubs, including
Sole Financial Adviser Sole Financial Adviser
London, New York, Hong Structured Bonds HSBC has a track-record of providing value-added
Kong, Singapore, Paris and advisory and arranging financing through volatile
markets Jun 2017 Indonesia Apr 2017 China
Dubai Rating Advisory
Bankers are product agnostic providing advice on best
HSBC’s expertise is well Project Finance solution be it loan, bond or private placement
Financing Solutions
recognized in the industry: Ability to provide balance sheet to support clients
Debt Advisory including underwritten and club solutions USD29.2m USD5bn
#3 APAC Financial HSBC has one of the largest global Export Finance Sinosure supported facility for the Multi-tranche bond offering
Export Finance
Advisor for infrastructure teams of any commercial bank procurement of a 1x55MW coal-fired
power
Finance 20171
Debt Capital Markets Ability to arrange Export Credit Agencies (ECAs) Coordinating Bank, Mandated Lead Joint Global Coordinator, Sole Rating
#2 APAC Bond Arranger supported facilities across diverse business sectors Arranger, Facility and Security Agent Adviser, Joint Lead Manager, Joint
worldwide with all the major ECAs, with a particularly Provider Bookrunner
for infrastructure Equity Capital Markets
strong presence in arranging Sinosure-supported
finance 20171 facilities
Aviation Finance Jan 2017 Sri Lanka Sep 2016 Indonesia
#1 Airports M&A Single global team to ensure common / integrated client
Advisor 2005 - 20171 Maritime Finance pitching
Best overall international
bank for the Belt and Green Bond
USD44m Sinosure Facility USD1.8bn
Road Initiative
Global Markets HSBC has infrastructure experts in Global Markets, Financing for the runway overlay and Jawa 7 2x1000MW IPP
solutions
associated works at Bandaranaike PT Shenhua Guohua Pembangkitan
Global Trade Receivable Financing (GTRF) and Global
Other
International Airport in Katunayake, Sri Jawa Bali; China Shenhua won the bid
Global Trade Liquidity and Cash Management (GLCM) Lanka on this project
Receivable Financing
Ability to provide Global markets, GTRF and GLCM Sole Arranger, Agent and Security Transaction Advisor to PLN
Global Liquidity and Agent
Source: IJGlobal, Dealogic solutions to support infrastructure transactions
Cash Management
1. League table ranking by deal value
13Business Corridors, Belt and Road: Overview of the Belt and Road Initiative
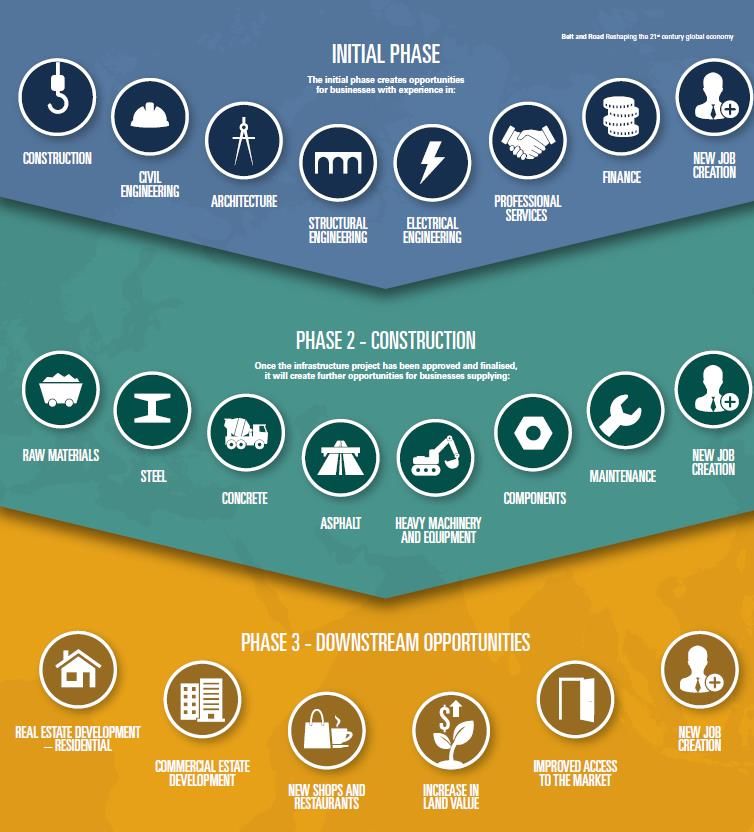
…the projects create further opportunities
In addition to the immediate opportunities, there is
tremendous potential for spillover benefits
Financial services required by participants in the immediate
supply chain associated with a project
Project development will also create local demand for
upstream / construction-related materials and services
Completed projects and enhanced connectivity will stimulate
commercial / tourism development
Follow on opportunities include
Residential Development Commercial Development
New transport routes are a Enhanced connectivity boosts
catalyst for new community relative attractiveness of sites for
development commercial / industrial users
Logistics Development Local economic multiplier
Improved connectivity will Infrastructure projects will
impact business location and stimulate local economy –
supply chain decisions generating increased local
economic activity
14Business Corridors, Belt and Road: HSBC’s unique positioning as the “Go to Bank” for BRI
Using the international network and universal banking model, HSBC can
help clients of all sizes to participate in BRI opportunities
Geographic spread Product breadth Customer depth
• HSBC’ global coverage is aligned with BRI • HSBC’s products offering provides • HSBC’s differentiated proposition
territories one-stop holistic solutions for our
• HSBC has set up 25 China desks1 around the customers
world and is the international bank with the
largest onshore network in China
Global Global
Liquidity & Banking
Securities Cash
Services Management Large
Corporates
Global
Insurance & Trade &
Receivables
Mid Market
Investments
Finance Corporates
Corporate & Business Banking
Hedging (FX, Project Upper
Interest rate) Lending
M&A
ECM
Business Banking Mass
DCM
Retail Business Banking
HSBC has a unique competitive position
1. China Desk locations: Hong Kong, Singapore, Australia, UK, USA, UAE, Germany, France, Poland, Luxembourg, Israel, Saudi Arabia, Malaysia, Macau, Thailand, India, Indonesia, Bangladesh, Vietnam, Sri Lanka, Canada,
Argentina, Mexico, South Africa, Mauritius.
15Business Corridors, Belt and Road: Overview of the Belt and Road Initiative
Increased trade flows from improved network connectivity and China’s BRI
policies will facilitate more RMB usage
Improved network connectivity across Belt and Road (BR) routes and mainland China’s trade and investment focus in key BRI countries
will lead to increased usage of RMB as a trade, payment and financing currency
70% of corporates surveyed agreed that the BRI would have a positive impact on RMB usage in the future1
With RMB now the 3rd trade finance and 5th payment currency globally, China continues to improve offshore RMB infrastructure in
partner countries and through its RMB Cross-border International Payments System (CIPS)
RMB usage along BR and within AIIB China’s trade in RMB3
50%
In 2017, China’s trade with countries along BR was 27% of its total trade at USD7.4tn2
In 2017, 12% of China’s total trade was conducted in RMB3. By 2020, HSBC estimates 4x
that China will conduct 50% of its trade in RMB 26%
22%
Of the 24 RMB clearing banks globally, 18 countries / territories are along the BR 17%
12% 12%
8%
Of the 254 markets with active RMB swap lines (c. >RMB2.2tn), 22 are along the BR
Most of China’s top trade partners are using RMB or have RMB clearing banks 2012 2013 2014 2015 2016 2017 2020F
1. HSBC RMB Internationalisation Survey 2017; Ministry of Commerce; 3. PBOC, % trade settled 4. 36 foreign central banks have signed RMB swap lines, including 11 expired swap lines; 5. CEIC goods trade, not including services;
6. SAFE; 7. HKMA, MAS, Central Bank of the Republic of China (Taiwan), City of London, BOK; 8. European Central Bank
16Business Corridors, Belt and Road: HSBC’s unique positioning as the “Go to Bank” for BRI
HSBC can reach all the business opportunities around a single BRI project
proposal
Clients’ needs / product opportunities over the Project’s life cycle
Project
Project t
• Int’l & local
Owner Ministry of Finance (MoF)
Funding (loan / bonds)
procurers
Ministry of Transport (MoT) • Financial & structuring depending on
Advice markets / Full
Government Agencies
• Hedging
Central Bank currency required Coverage
The Project’s Ecosystem
ProjectCo International Bidder A Bidder B Bidder C • Financial Advisory International Global
Bidders / investors • Intro to local partner banks’ scope network
Investors partnering with • Bid & Perf. bonds
• Funding (loan / bonds)
local large Expertise in
• Hedging (IRS, FX)
Company advising and
financing of
Lead Large International • Performance bonds infrastructure
contractors • Receivable financing
Full & local • Payable financing
Infrastructure Deliver both
Coverage • Working Capital Local
companies event and
• Hedging (FX) banks recurrent
flow
Sub Mid-size local Infrastructure products
Contractor / & logistics companies • Performance bonds
suppliers • Receivable financing
• Working Capital
Real Estate International & Local real estate • Funding (loan / bonds)
Companies investors and builders • Performance bonds
• Trade financing
• Working Capital
17Business Corridors, Belt and Road
Summary of recent examples of HSBC supporting Chinese clients going
outbound
Supply
Initial Initial event Risk
chain
advisory financing management
support
China to Australia Mandated Lead Arranger for CCCC US$1.1bn bridge loan facility in support of its 100%
acquisition of John Holland Group Pty
Mandated Lead Arranger, and Hedge Provider on the A$633m project financing for Capital Metro
PPP in the ACT
Mandated as John Holland’s offshore GLCM partner bank.
Mandated Lead Arranger for the extension and reduction in pricing of John Holland’s A$1bn
bonding facility
China to France Sole Financial Adviser for China Eastern Airlines to acquire 10% stake in Air France KLM. CEA
financed its stake acquisition through pledging of AFK and CEA (H-shares) shares owned by CEA,
where HSBC further assisted to ensure successful closing in Oct 2017
China to UK Sole Financial adviser to the China Resources Consortium for the purchase consideration of
c.£555m for the 30% equity stake in Dudgeon Holdings Limited (“Dudgeon“)
China to Sri Lanka Sole Arranger, Agent and Security Agent for the financing of runway overlay and associated
works at Bandaranaike International Airport in Katunayake, Sri Lanka.
China to Bangladesh Mandated Lead Arranger, Coordinating Arranger, Lender, Facility Agent and Security Agent, LC
Issuing Bank, Account Bank for the USD 333m financing package for the re-powering of the
210MW Ghorasal 3rd Unit involving a Swiss-Chinese consortium, comprising General Electric (ex-
Alstom) and China National Machinery Import & Export Corporation (“CMC”)
China to Switzerland Lead Financial Adviser for ChemChina on its full cash tender offer for Syngenta, the Swiss listed
world leader in crop protection, valued at USD46bn
18Business Corridors, Belt and Road
BRI is a significant long-term growth theme that will help trade, FDI and
wealth flows across the region (and globally)
1
BRI opportunities not limited to infrastructure, but also adjacent project opportunities, and downstream
opportunities
2
2017 Asian loan growth of 14%1, and 15% revenue growth for the top 17 HSBC Asian corridors highlights early
evidence of BRI benefits starting to accrue
3
BRI reaffirms our existing Business Corridor strategy
4
HSBC well-positioned to be the “go to” bank for BRI
Product capability allows to service the customer needs throughout the project lifecycle
Our presence in BRI countries combined with our customer base (SME – Large multinational corporates)
means that we are able to service multiple participants of a single project
Customer / industry has recognised our ability to finance BRI opportunities
1. Adjusted basis - same definition as shown in the HSBC Holdings plc 4Q17 results slides published on 20 February 2018
19ASEAN 11 April 2018 Matthew Lobner Head of International, Asia-Pacific and Head of Strategy and Planning, Asia-Pacific Tony Cripps Chief Executive Officer, Singapore Mukhtar Hussain Chief Executive Officer, Malaysia Sumit Dutta Chief Executive Officer, Indonesia
ASEAN

Agenda

ASEAN introduction

Opportunities arising from ASEAN integration and HSBC’s position

Singapore, Malaysia and Indonesia: Country overview and HSBC priorities

Clients’ view of ASEAN and HSBC’s structure to support their needs

Summary

                                                                          21
ASEAN: Introduction
Association of Southeast Asian Nations (ASEAN)
10 Countries, Combined GDP of USD2.7tn1,2, population of c.650 Population1
GDP1,2
million1 and trade of USD2.2tn1,3
Trade1,3
Priority markets
68m
Other presence
Lao PDR4 Cambodia 95m
USD423bn
Myanmar USD223bn
USD399bn
USD372bn
Thailand
Vietnam
31m
104m
USD293bn
USD333bn
Philippines USD315bn
Malaysia Brunei
Singapore USD127bn
264m
5.8m
USD1.0tn
USD304bn
Indonesia USD295bn
USD696bn
As a single entity, ASEAN ranks as world’s seventh largest economy and is expected to become fourth largest by 20305.
1. Source: Global Insight; 2017 data 4. Lao People's Democratic Republic
2. Nominal GDP 5. Source: Global Insight
3. Trade = Exports + Imports 22ASEAN: Introduction
ASEAN: Journey towards integration
ASEAN established Announced creation ASEAN pushes ASEAN to grow at a rapid pace,
to promote of ASEAN for deeper trade supported by planned initiatives to
collaboration, Economic liberalisation increase connectivity / integration
peace and stability Community (AEC) TPP-111 agreed
among members by 2015 for regional RCEP2 in final Increased investment in infrastructure
economic integration to support intra-ASEAN physical
negotiations
connectivity (e.g. Singapore Kunming
Rail Link, ASEAN Highway Network
project)
1967 1977-2003 2007 2010-15 2015-18 Growth in trade driven by further
reduction in tariffs and other trade-
distorting measures (e.g. further
strengthening of ATIGA)
1977: ASEAN Preferential 2010: ASEAN Trade in Goods
Greater mobility of skilled labour in the
Trade Agreement Agreement (ATIGA)
region (e.g. enhanced commitments
1992: ASEAN Free Trade Area 2012: ASEAN Comprehensive under Agreement on Movement of
Investment Agreement Natural Persons)
1995: ASEAN Framework
Agreement on Services 2014: ASEAN Bank
Integration Framework Deeper regional financial integration to
1997: Adopted ASEAN Vision help accelerate economic development
2015: AEC formally
2020 (e.g. ASEAN Banking Integration
established; AEC Blueprint
2003: Declared formation of 2025 was adopted Framework)
AEC
1. TPP11: Comprehensive and Progressive Agreement for Trans-Pacific Partnership
2. RCEP: Regional Comprehensive Economic Partnership
23ASEAN: Opportunities arising from ASEAN integration and HSBC’s position
Opportunities arising from ASEAN integration
Integration to accelerate economic expansion and wealth creation
across ASEAN Key opportunities
Estimated infrastructure and real estate investment, Growth of investment and corporate banking,
2014-301,2, USDtn arising from:
Infra- 2.7
0.9 ASEAN based businesses expanding across
structure 0.8 0.7 0.7 0.7 ASEAN to improve competitiveness through
needs
M&A, JVs, and upgrading regional supply chains
Indonesia Philippines Thailand Malaysia Singapore Vietnam
MNCs outside ASEAN setting up regional HQs
within ASEAN to capture opportunities across the
ASEAN trade3, USDtn Exports bloc
Imports
+7.3%4 Acceleration of infrastructure investments to
5.6
Trade enhance regional integration, supported by the
growth 2.2 2.9 Belt and Road Initiative
1.2 2.7
1.0
Growth of transaction banking, arising from:
2017 2030F
Lowering of trade tariffs and barriers to further
ASEAN per capita GDP3, USD'000
increase in trade flows
2.6x Growth of offshore wealth and individual
Wealth international banking needs, arising from:
creation
11.0
4.2 Ease of labour movement / travel throughout
ASEAN
2017 2030F
1. Source: Southeast Asia at the crossroads - Three paths to prosperity (McKinsey, 2014)
2. ID: Indonesia; PH: Philippines; TH: Thailand; MY: Malaysia; SG: Singapore; VN: Vietnam
3. Source: Global Insight 24
4. 2017-30 CAGRASEAN: Opportunities arising from ASEAN integration and HSBC’s position
HSBC well-positioned to capture ASEAN opportunities
xx Year of establishing HSBC presence
200 Priority markets
branches Other presence
10,000
For c.150 years, HSBC has
corporate clients played an active role in
development of economies
20,000 and infrastructure of ASEAN
countries
SME clients
At scale / near-scale
2,500,000 positions in three of the
largest markets
retail clients
Presence in other key
15,000 markets – Vietnam,
Thailand, Philippines
CAGR staff
2016 trade1 2016-30 Ability to capture both flows:
USDbn intra-ASEAN and ASEAN
c.88% of ASEAN’s trade is with with Rest of World / Asia
Intra-ASEAN 153 9%
rest of Asia / World. HSBC’s
global network hence puts us Strong onshore franchise
ASEAN-Rest of Asia 692 9% in a strong position against with fully functional RBWM,
regional / local banks1 CMB and GB&M in key
ASEAN countries
ASEAN-Rest of World2 404 7%
1. Export + Import; Source: Oxford Economics
2. Rest of World Ex-Asia
25ASEAN: Singapore, Malaysia and Indonesia: Country overview and HSBC priorities
Country overview: Singapore (1/2)
Country highlights
Real GDP1, USDbn Strong fundamentals
AAA credit rating from three ratings
2.1%2 2.3%2 agencies
323 USD0.7tn of One of world’s most connected economies6
289 302
Infra- investment Leading international financial centre
GDP
structure estimated between
Largest FX centre in Asia; 3rd largest
2014-20304
globally7
Expected to become the second largest
2015 2017 2020F offshore wealth centre globally by 20205
Centre of ASEAN finance and commerce
World-leading hub for container
Trade3, USDbn Offshore wealth5, USDtn transhipment, connecting ASEAN to the
Exports Imports xx CAGR (2016-21E) world
Fastest growing international 2/3rd of project financing in ASEAN is
5.7%2
1.4%2 wealth centre arranged out of Singapore8
820 3% 8% 7% Hub for regional headquarters
Trade 676 696 Wealth
454 2.4 Around 7,000 MNCs in Singapore with
380 393 1.2 c.60% having regional responsibilities9
0.8
366 Becoming the financial conduit linking
297 303 mainland China, ASEAN and the rest of the
Switzer- Singa- Hong world
2015 2017 2020F land pore Kong
1. 2010 USD basis; Source: Global Insight 6. Source: McKinsey Global Institute Connectedness Index, 2016
2. CAGR 7. Source: Bank for International Settlements (BIS)
3. Source: Global Insight 8. Source: Singapore – Asia’s infrastructure hub, Monetary Authority of Singapore & 26
4. Source: Southeast Asia at the crossroads - Three paths to prosperity (McKinsey, 2014) International Enterprise Singapore
5. Source: Global Wealth 2017, Transforming the Client Experience (BCG) 9. Source: Cushman & Wakefield (2016)ASEAN: Singapore, Malaysia and Indonesia: Country overview and HSBC priorities
Country overview: Singapore (2/2)
HSBC performance highlights1, 2017
Contribution by global business
Revenue PBT Loans and advances to
USDm
customers (net)
Revenue 1,174 44% 42%
34%
12%
6% 7% 12%
PBT 463 17% 20% 14% 20%
31% 26%
15%
USDbn
RBWM CMB GB&M GPB Corp Centre
Loans and
advances to Strategic priorities
28
customers
(net) Continue to build regional product and coverage expertise to
capture opportunities from Singapore’s role as a regional hub
Customer
41 Capture infrastructure / BRI opportunity
accounts
Capture international flows from key business corridors
Grow domestic retail and private banking business, enabled
by digital and multi-channel capabilities
Key ratios (2017)
Scale up international wealth centre to capture greater share
of wealth flows
CER 61% LICs / loans +0.03%2
Be the ‘go-to’ financial advisor and industry thought leader for
sustainable finance
1. All financials are on reported basis
2. The ratio is positive due to net loan recoveries
27ASEAN: Singapore, Malaysia and Indonesia: Country overview and HSBC priorities
Country overview: Malaysia (1/2)
Country highlights
Real GDP1, USDbn Strong and enduring economic fundamentals
Forecast GDP growth at c.5% p.a. through to
4.7%2 20203
4.2%2
411 Middle and upper middle class expected to be
330 358 USD0.7tn of more than 80% of population by 20205
Infra- investment Regional centre of excellence for Islamic
GDP
structure estimated Banking
between 2014- Growing as a major regional hub
20304 Over 3,600 MNCs with global and regional
representative offices. Further c.1,400 MNCs
2015 2017 2020F with an operating presence6
Well-developed infrastructure. 18th position
globally on ease of doing business6
Trade3, USDbn Per capita GDP3, Cost competitive, ranking 212th most expensive
USD'000 destination in the world7 (Singapore ranked 24th)
Exports Imports
Young, educated and cost effective workforce
2.6x (median age of population is c.28 years)8
+6.7%
+1.5%
24.6 Strong diplomatic, cultural and commercial
404 Wealth relations with mainland China, linking it with
Trade 323 333 ASEAN
creation
220 9.4
176 180 Over 30 inter-governmental MOUs signed
9 major Chinese corporates set up regional
148 152 184 centers in Malaysia in the last 24 months
2017 2030F Aggressive investment in ports and rail links in
2015 2017 2020F Malaysia under BRI
1. 2010 USD basis; Source: Global Insight 5. Source: Capitalizing on Asia’s Booming Upper Middle Class (BCG, 2016)
2. CAGR 6. Source: Kuala Lumpur, Asia’s regional headquarters hub (EY, 2016); Malaysian Investment Development Authority (MIDA)
3. Source: Global Insight 7. Source: Cost of Living survey published by ECA International
28
4. Source: Southeast Asia at the crossroads - Three paths to prosperity (McKinsey, 2014) 8. Source: Department of Statistics, MalaysiaASEAN: Singapore, Malaysia and Indonesia: Country overview and HSBC priorities
Country overview: Malaysia (2/2)
HSBC performance highlights1, 2017
Contribution by global business
Revenue PBT Loans and advances to
customers (net)
USDm
50%
27% 16% 34%
Revenue 836
15% 9% 44%
17% 21%
40%
PBT 325 26%
RBWM CMB GB&M Corp Centre
USDbn Strategic priorities
Loans and Build coverage and product expertise to capture opportunities
advances to from growing numbers of MNCs using or transferring to Malaysia
14 as their regional operating hub, especially from mainland China
customers
(net) Leverage early leadership in BRI investment flows, capturing
Customer both event and the flow opportunities
14 Capturing opportunities from key business corridors including
accounts
mainland China, intra-ASEAN and Japan
Grow Retail, leveraging propositions in Cards and Wealth.
Key ratios (2017) Invest in digital to enhance competitive positioning
Leverage Malaysia’s international capital markets leadership in
Shariah compliant financial services. Build out Shariah
CER 56% LICs / loans (0.32)% compliant personal financial services to capture the rapid growth
in this sector
1. All financials are on reported basis
29ASEAN: Singapore, Malaysia and Indonesia: Country overview and HSBC priorities
Country overview: Indonesia (1/2)
Country highlights
Real GDP1, USDbn Strong economic fundamentals and
demographics
5.3%2
5.0%2 ASEAN’s largest economy. Expected to become
1,272 the 7th largest (by GDP) globally by 20303
1,090 USD2.7tn of Assigned Investment Grade Credit rating by all
988
Infra- investment major rating agencies in 2017
GDP
structure estimated 4th most populous country with a young
between 2014-304 population (median age of population is c.28
years)5
GDP growth fuelled by strong domestic demand,
2015 2017 2020F supported by a growing middle class. Middle and
upper middle class expected to be more than
50% of the population by 2020 (37% in 2015)6
Trade3, USDbn Per capita GDP3, Growing trade flows
Exports Imports USD'000 Trade to grow at c.10% CAGR between 2017-
20203, with mainland China and Singapore as
3.2x
+10.0% leading partners, driven by commodities exports7
+1.9%
12.3 Investments in infrastructure
393 Wealth
Trade
284 295 creation Requires USD2.7tn in infrastructure and real
205 estate investment (between 2014 and 2030) to
149 157 3.9 support growth, the most in ASEAN4
135 138 188 Currently ongoing / planned projects amount to
c.USD300bn, expected to be supported by
2017 2030F
2015 2017 2020F funding from private sector and BRI6
1. 2010 USD basis; Source: Global Insight 5. Source: Global Insight; IMF
2. CAGR 6. Source: Capitalizing on Asia’s Booming Upper Middle Class (BCG, 2016)
3. Source: Global Insight 7. Source: Oxford Economics, HSBC Trade Connections
30
4. Source: Southeast Asia at the crossroads - Three paths to prosperity (McKinsey, 2014) 8. Source: NatixisASEAN: Singapore, Malaysia and Indonesia: Country overview and HSBC priorities
Country overview: Indonesia (2/2)
HSBC performance highlights1, 2017
Contribution by global business
Revenue PBT Loans and advances
USDm to customers (net)
1%
Revenue 564 7% 54% 8%
27%
19%
24%
17%
PBT 180
-13% 72%
42% 42%
USDbn
RBWM CMB GB&M Corp Centre
Loans and
advances to Strategic priorities
4
customers
Leverage our international network to maximise opportunities
(net)
across key Business Corridors, including mainland China,
Customer intra-ASEAN, US, UK & Germany
4
accounts
Capture infrastructure opportunity (including BRI) to drive
growth
Invest in digital to scale up Retail business
Key ratios (2017)
Grow liabilities across businesses to support asset growth
CER 56% LICs / loans (1.6)% Strengthen and grow local corporate and SME relationships
across the top cities to capture growth in domestic businesses
1. All financials are on reported basis
31ASEAN
Client viewpoints: illustrating HSBC’s ability to support MNCs expand into
ASEAN and ASEAN clients expand within and outside ASEAN
1 2 3
Expansion opportunity beyond home An attractive location to set up a Strategic location for regional
country in ASEAN manufacturing base business hubs
Indonesian Group, aiming to establish Large manufacturer in mainland China, Dutch marine engineering firm, with
a strong footprint in Asian markets, expanding production sites in ASEAN, regional sales and finance hub in
including ASEAN with regional sales hub in Malaysia Singapore
Large group in resin distribution and Vertically integrated knitwear Operates in over 50 countries,
consumer packaging business manufacturer, headquartered in Hong including 6 locations in ASEAN
Has expanded across 7 countries in Kong, with most of the production in HSBC is providing the client with a
mainland China
Asia (5 in ASEAN) regional cash management solution
Actively expanding production in to centralise its cash position
Has strong conviction in ASEAN’s
Cambodia and Vietnam to mitigate across Asia and Netherlands
growth potential, looking to expand in
rising costs in mainland China and for
the remaining ASEAN countries Obtained the mandate by delivering an
better access to the attractive ASEAN innovative liquidity management
Considers HSBC as the best partner market solution and close cooperation
to help in its expansion, with its
Have set up their regional sales hub between HSBC teams in
experience and international network
in Labuan (Malaysia) Netherlands and Singapore
HSBC Indonesia supports the client
HSBC supports the client by funding Demonstrates HSBC’s transaction
with trade facilities, FX hedging and
capital expenditure in Vietnam and banking capabilities and ability to
cash management. Client also banks
providing GLCM services in Labuan, support a corporate globally
with HSBC in Malaysia, Singapore,
where the collections are centralised
Australia, and New Zealand
32ASEAN
Structure to enable focus on ASEAN opportunities
Indonesia Malaysia Singapore
Philippines Thailand Vietnam
Strong onshore presence and coverage enhanced by regional capabilities
International wealth centre in
1 Regional coverage 2 Product specialists 3
Singapore
1. Clients’ view of ASEAN andHSBC’s structure to support their needs
33ASEAN
HSBC well positioned to capture opportunities across ASEAN
Well positioned to capture opportunities across ASEAN…
1 Deep heritage across key ASEAN markets
At scale / near-scale positions in three of the largest markets
Well positioned to support
strong economic Presence in other markets – Vietnam, Thailand and Philippines
fundamentals in ASEAN
markets, further bolstered
by ongoing integration 2
Ability to capture wealth, investment and trade flows intra-ASEAN and
activities between ASEAN with Rest of World / Asia
3
Strong onshore franchise with full coverage, supported by regional
capabilities
34Sustainable finance 11 April 2018 Daniel Klier Group Head of Strategy and Global Head of Sustainable Finance
Sustainable Finance
Sustainability and HSBC’s approach to ESG1
Sustainability at HSBC HSBC’s approach
From climate change to Support the global transition to the low-carbon economy,
wealth equality and job Environmental through our own sustainable operations and by supporting our
security, the challenges to customers with their transition
today's global economy are
unprecedented in nature We have robust climate-related risk management covering
In this changing environment, sensitive sectors, such as energy, palm oil and forestry
HSBC is committed to
develop the skills, business
innovation and low-carbon Foster a customer and employee centric approach to our
solutions to secure long-term Social business
prosperity for all
Focus on diversity and inclusion of our workforce, and strive to
Our sustainability approach
put the customer at the heart of everything we do
focuses on three main areas:
Support the transition to a
low carbon economy
Enable sustainable supply
chains and entrepreneurship Governance Maintain high standards of governance across all geographies
Provide communities,
Committed to protecting our customers and communities
customers and employees
with skills to succeed in the through our Financial Crime Risk management and cyber
future security diligence
1. Environment, Social and Governance
36Sustainable Finance
Pathway to achieve Paris Agreement is challenging; speed of change is
accelerating
Material reduction in carbon emissions required to deliver Paris Agreement1 …and stakeholders have already taken actions
Carbon emissions Carbon budget to combat climate change France and UK to ban sale of new
gigatonnes of carbon gigatonnes of carbon petrol and diesel cars by 2040
China cancelled plans of more than 100
Government
3,000 coal power plants early 2017
California to receive all of its power
from renewable energy by 2045
Investors demand reports from big
O&G companies on possible impact of
1,720 global warming policies on business
Investors
1,480 HSBC research shows that 68% of
1,300 investors plan to increase their
1,000 climate-related investment
550 A global O&G company is investing in
400 renewables for their power generation
and installing charging stations at
petrol stations
Carbon Emissions Emissions >50% >66% >50% >66% A multinational utility company
stored in at current with existing chance of chance of chance of chance of Corporates pledged to dispose EUR15bn in assets
known fossil run rate commitments achieving achieving achieving achieving to reinvest into low-carbon, distributed-
reserves this goal this goal this goal this goal energy projects
A global Original Equipment
2oC world 1.5oC world Manufacturer will produce only electric
(Paris Agreement) or hybrid cars from 2019 onwards
1. Source: Inter-governmental Panel on Climate Change, UCL, HSBC calculations, until 2050
37Sustainable Finance
Over USD100tn investment in infrastructure in the next 15 years is required
globally under 2 degree scenario, c.50% will be in Asia
Global infrastructure investment needed in the next 15 years for a 66% chance of 2°C1
USD trillion, 2016-2030
103.5 100%
16.5 c.50% of total
investment will be in
29% Mainland China
Asia, especially
9.0
emerging Asia
India
15.0 6% Other emerging Further areas of
6% Asia investment:
9.0 7% Developed Asia Energy
2% Power / electricity
7% Africa
13.5
Transport
5% Latin America
Banking Revenue pool in next 15 Middle East Mainland China’s BRI
years3: 22% US and Canada will further drive
>USD5tn global investment and
40.5
trade, especially in
the Asia-Pacific
16% Europe
region
Transport Water & Telecoms Power and Primary Energy 2016-2030 By region2
sanitation electricity energy demand/ Total
transmission/ supply efficiency
distribution chain
1. OECD, IEA, Investing in Climate, Investment in Growth, JUL17; The OECD estimates that for infrastructure to be consistent with a 2oC 66% scenario, investment needs to amount to USD6.9tn per year in the next 15 years, an
increase of about 10% in total infrastructure investment from the reference estimate of USD 6.3 trillion. Definition and source data are different to those shown in the BRI presentation
2. McKinsey, “Bridging Global Infrastructure Gaps” JUN16 38
3. HSBC estimationSustainable Finance
Asia is at the heart of the transition and key countries from Asia are
pioneering in this area
Top 100 most Changes in Gross capacity Total investment
Taking leadership
populous cities1 electricity demand2 additions2 projected2
2016 PWh, 2016-40 TW, 2016-40 USDtn, 2016-40 China
China is the world’s biggest
producer of wind energy,
Asia-Pacific 55 55% 8.4 60% 4.4 51% 4.8 47% with a total installed
capacity of c.170GW in
20164
China aims for renewables
(incl. hydro power plants) to
Americas 10 10% 1.3 9% 1.4 16% 1.5 14% contribute half of new
electricity generation by
2020, committing
RMB2.5tn5
META3 30 30% 2.5 18% 1.1 13% 1.5 14% India
India plans to increase its
solar installations from
below 5GW to 100GW by
Europe 5 5% 0.2 2% 0.9 11% 1.2 12% 2022, more than double the
present solar capacity of
China and Germany6
India aims for 57% of
installed capacity to come
Rest of World 0% 1.6 11% 0.8 9% 1.3 13%
from non-thermal energy by
20277, requiring USD200-
300bn of investment8
1. Country Disclosure, HSBC estimation 5. China to invest GBP292bn in renewable power by 2020, the Guardian, JAN17
2. Bloomberg New Energy Finance, 2017 6. Financial Times, Investors look to India as the next solar power, JAN16
3. META includes Middle East, Turkey and Africa 7. Forbes, India Coal Power Is About To Crash, JAN18 39
4. Global Wind Energy Council (GWEC), 2016 8. India needs over USD200bn of investment in renewables, Economic Times, NOV17Sustainable Finance
The transition will affect many industries and create opportunities
Transition Business opportunities Financing solutions
Risk of stranded assets Portfolio diversification Corporate Lending
Renewables will contribute at least 20% of • Transition from high-carbon to low-carbon M&A, DCM, ECM
primary energy supply by 20401 assets Trade Finance
Energy
• USD350bn of investment in wind and
solar needed to achieve the current
market share in upstream O&G3
Decentralisation of power generation system Households to install more solar panels Personal Loan
Grid health (risk of overgeneration due to New infrastructure: energy storage to provide Corporate Lending
intermittency of renewable energy systems); behind-the-meter solutions and control over- Project Finance
Utilities smart grids generation
M&A, DCM, ECM
“Green buildings” Total spending on energy-efficient products Trade Finance
Regulatory requirements to increase energy and services in buildings was USD406bn in Mortgage / Personal
efficiency 20164 Loan
Real Estate Better insulation materials / technologies in Corporate Lending
new buildings
Smart meters
Transition from Internal Combustion Engine Car makers to invest at least USD90bn in Corporate Lending
(ICE) vehicles to Electric Vehicles (EV) designing new EV models and increasing Project Finance
• Countries set target years for ban of new production5
Transportation M&A, DCM, ECM
ICE sales (e.g. France / UK by 2040) USD2.7tn investment on infrastructure
• 54% of annual global light duty vehicle needed for EV adoption6, i.e. building new
sales will be EV by 20502 charging points in petrol stations
1. Source: IEA World Energy Outlook 2017, New Policy Scenario projection, incl. hydro, bioenergy, wind, 4. UN, Global Status Report 2017; IEA
geothermal, solar photovoltaic, concentrated solar power, marine 5. Reuters Analysis, JAN18
2. BNEF, Long-Term Electric Vehicle Outlook 2017 6. Morgan Stanley Research 40
3. Wood Mackenzie 2017Sustainable Finance
HSBC is committed to leading the way to a sustainable future
Our commitments Progress so far
We are committed to financing clean USD10.5bn of GSS1 bonds facilitated in 2017
Provide USD100bn of energy, low carbon technologies and
sustainable financing and projects, which will help deliver the 2015 3 low-carbon funds launched in 2017
investment by 2025 Paris Climate Agreement and the UN
Sustainable Development Goals Applied Equator Principles to loans2 USD67.6bn
We will do this via direct investment or 27% of signed renewable power purchase agreements
Source 100% of our electricity
direct purchase agreements that in turn (2016: 23%)
from renewable sources by
help finance new renewable energy
2030 (90% by 2025)
projects
Reduce our exposure to We will reduce our exposure to thermal Restrict the development of carbon intensive sources
thermal coal and actively coal and engage with clients to actively
of energy
manage the transition for manage the transition path for other high
other high carbon sectors carbon sectors Embed climate risk in credit risk assessment
We will adopt recommendations of the
Adopt recommendations of Task Force on Climate-related Financial Reported governance, strategy and risk management
Task Force on Climate-related Disclosures report 2018. This will help us components in 2017 ARA
Financial Disclosures (TCFD) identify and disclose climate-related risks
and opportunities across our businesses
We aim to provide the thought leadership Member of 20 Sustainability-focused industry forums
Lead and shape the debate
needed to unlock the capital flows required
around sustainable finance
to address the world’s major sustainability #1 team for Climate Change research (2014-2017)
3
and investment
challenges
1. Dealogic, GSS bonds refer to green, social, sustainability bonds
2. Since 2003
3. EXEL 41You can also read