Design opportunity conception using the total technology space map - Unpaywall
←
→
Page content transcription
If your browser does not render page correctly, please read the page content below
Artificial Intelligence for                          Design opportunity conception using the total
        Engineering Design, Analysis
        and Manufacturing                                    technology space map
        cambridge.org/aie                                    Jianxi Luo, Binyang Song, Lucienne Blessing and Kristin Wood
                                                             Engineering Product Development Pillar & SUTD-MIT International Design Centre, Singapore University of
                                                             Technology & Design, Singapore, Singapore

        Research Article                                       Abstract
        Cite this article: Luo J, Song B, Blessing L,
                                                               Traditionally, design opportunities and directions are conceived based on expertise, intuition,
        Wood K (2018). Design opportunity conception           or time-consuming user studies and marketing research at the fuzzy front end of the design
        using the total technology space map. Artificial       process. Herein, we propose the use of the total technology space map (TSM) as a visual idea-
        Intelligence for Engineering Design, Analysis          tion aid for rapidly conceiving high-level design opportunities. The map is comprised of var-
        and Manufacturing 32, 449–461. https://
                                                               ious technology domains positioned according to knowledge proximity, which is measured
        doi.org/10.1017/S0890060418000094
                                                               based on a large quantity of patent data. It provides a systematic picture of the total technol-
        Received: 1 May 2017                                   ogy space to enable stimulated ideation beyond the designer’s knowledge. Designers can
        Revised: 9 April 2018                                  browse the map and navigate various technologies to conceive new design opportunities
        Accepted: 23 April 2018                                that relate different technologies across the space. We demonstrate the process of using
        Key words:                                             TSM as a rapid ideation aid and then analyze its applications in two experiments to show
        Design opportunity conception; creativity;             its effectiveness and limitations. Furthermore, we have developed a cloud-based system for
        ideation; patents; technology network                  computer-aided ideation, that is, InnoGPS, to integrate interactive map browsing for conceiv-
                                                               ing high-level design opportunities with domain-specific patent retrieval for stimulating con-
        Author for correspondence:
        Jianxi Luo, E-mail: luo@sutd.edu.sg                    crete technical concepts, and to potentially embed machine-learning and artificial intelligence
                                                               in the map-aided ideation process.

                                                             Introduction
                                                             “What products, services, systems, or technologies shall we design next?” This is a lasting ques-
                                                             tion that designers often ask themselves. Designers need to constantly explore new design
                                                             opportunities departing away from their prior designs. Herein, the notion of design opportu-
                                                             nities refers to the open-ended design opportunities or high-level design directions that need
                                                             to be identified at the fuzzy front end of a design process (Cagan and Vogel, 2002), in contrast
                                                             to the concrete concepts that are needed for prototyping or implementation at later stages of
                                                             design. Traditionally such design opportunities are conceived based on knowledge, experience,
                                                             intuition, or gut feelings of designers or time- and resource-consuming marketing research
                                                             and user studies in large established companies (Tauber, 1975; Ulrich and Eppinger, 2015).
                                                             As a result, designers are faced with high uncertainty in the search for new design opportu-
                                                             nities and directions.
                                                                 Despite the existence of user-centered or market-driven methods (Brown, 2008; Chen et al.,
                                                             2012; Kang et al., 2016), design opportunities can also be explored according to the technol-
                                                             ogies and their relationships. Herein, we aim to develop a rapid design opportunity ideation
                                                             tool based on the relationships of various technologies. Our focus is motivated by the funda-
                                                             mental understanding that ideation is the analogical transfer, synthesis, blending, or transfor-
                                                             mation of existing technologies or knowledge into new ones (Weisberg, 2006; Linsey, 2007;
                                                             Arthur, 2009; Hatchuel and Weil, 2009; Taura and Nagai, 2012). However, a designer’s
                                                             prior knowledge and expertise may influence his or her ability to conceive the relevance of
                                                             other technologies, in particular those in distant domains (Shai and Reich, 2004; Hatchuel
                                                             and Weil, 2009; Reich and Shai, 2012).
                                                                 Thus, for conceiving innovative design opportunities, graphical representation of the var-
                                                             ious existing technologies and their distances may prompt designers with technologies they
                                                             would not have easily thought of for analogy, synthesis, or blending. Conceptually, the set
                                                             of all proximate or distant technologies that humankind has created to date constitutes the
                                                             total technology space (Alstott et al., 2017a). In the space, two technologies are proximate if
                                                             similar knowledge or capabilities are required to design them, or are distant if designing
                                                             them requires distinct knowledge and capabilities. To recall, comprehend, learn, and use the
                                                             technologies in the proximity of known technologies will be easier, than those further away
        © Cambridge University Press 2018                    in the technology space. As a result, the structure of the total technology space, together
                                                             with the specialized technology position(s) of a designer, will condition or enable his or her
                                                             next design opportunities.
                                                                 We operationalize the total technology space as a network map of technology domains posi-
                                                             tioned according to knowledge proximity. The patent classes defined by the International Patent

Downloaded from https://www.cambridge.org/core. 23 Jan 2021 at 07:12:19, subject to the Cambridge Core terms of use.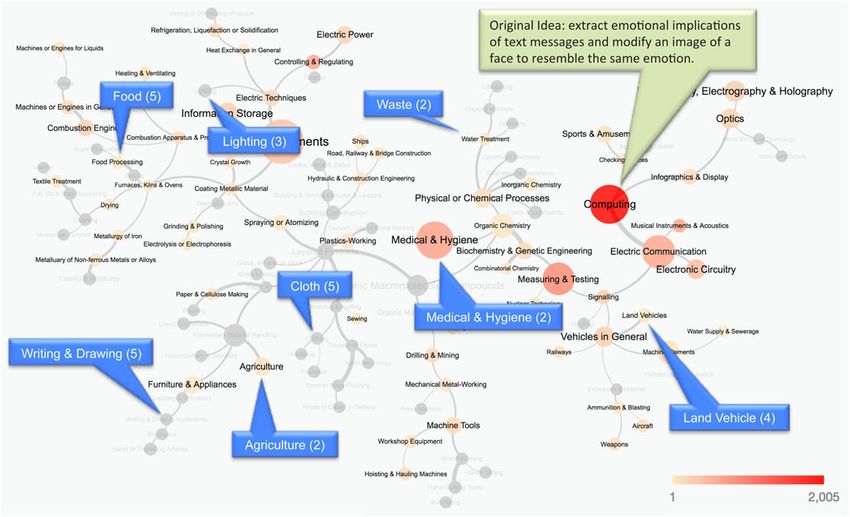
450                                                                                                                                            Jianxi Luo et al.

       Classification (IPC) approximate the domains, and their knowl-                            which technologies to transfer or transform and how a designer
       edge proximities are computed based on the references of patents                          may proactively search for technology-based design opportunities.
       to other patents. Our computation utilized more than five million                         In particular, given the vast number of available technologies, the
       patents for statistical significance. Designers can browse the map                        specialization of designers may condition their awareness of the
       to navigate and relate various technologies as inspiration for new                        technologies distant from the ones they are familiar with
       design opportunities. Such conception with a map of aggregate                             (Hatchuel and Weil, 2009).
       domains is expected to be rapid and result in abstract design                                  In fact, several methods and tools have been developed to facil-
       opportunities and high-level design directions. These can then                            itate the search for technologies across domains or disciplines. For
       be used to start an actual design process and later generate                              instance, infused design facilitates the discovery and use of knowl-
       more specific concepts. The utility of the total technology space                         edge, methods, and solutions across domains using so-called
       map (TSM) for conceiving design opportunities and directions                              combinatorial representations (Shai and Reich, 2004). The
       in the technology space is analogous to that of the geographical                          Interdisciplinary Engineering Knowledge Genome aids in the
       map for exploring places and finding directions in the physical                           retrieval of knowledge and method structures in different techno-
       space.                                                                                    logical domains (Reich and Shai, 2012). Design-by-analogy
          In brief, the goal of this paper is to introduce the total TSM as                      leverages the existing solutions in the source domain to solve a
       a rapid ideation tool for conceiving design opportunities at the                          design problem in a target domain (Linsey, 2007).
       fuzzy front end of the design process. In the following sections,                              In particular, computational methods have been developed to
       we first introduce the TSM and demonstrate its use for design                             retrieve patents as design stimuli from the patent database to sup-
       opportunity conception of spherical rolling robots (SRRs). Then                           port TRIZ (Cascini and Russo, 2006; Li et al., 2012) or
       we analyze its applications in two experiments (for artificial                            design-by-analogy (Linsey et al., 2012; Fu et al., 2013a, 2014,
       neural network (ANN) design opportunity conception and entre-                             2015). For example, Fu et al. (2013a) quantified the functional
       preneurial design opportunity conception) to show its effective-                          analogy distance between different patented technologies, and
       ness and limitations as a rapid ideation aid. We further discuss                          created Bayesian networks of patents based on such distances to
       the opportunities to digitalize the map for interactive browsing,                         facilitate patent retrieval. Fu et al. (2013b) further reported that
       integrate it with patent retrieval functions for technical concept                        it is difficult for designers to conceive the relevance of analogically
       generation, and embed machine-learning and artificial intelli-                            far patents, whereas “near-field” patents could effectively stimu-
       gence (AI) algorithms, in order to develop a system for computer-                         late new concepts but with limited novelty. Their studies focused
       aided ideation.                                                                           on the analogical distance between technologies as the key vari-
                                                                                                 able that condition analogical transfers.
                                                                                                      The conceptual leap hypothesis in the design creativity litera-
       Literature review
                                                                                                 ture has suggested that design stimuli from “far” sources contrib-
       In the literature and practice, some processes and methods have                           ute to novelty and are the best for creative breakthroughs
       been in place for identifying new design opportunities at the                             (Gentner and Markman, 1997; Ward, 1998; Tseng et al, 2008;
       fuzzy front end of the design process. With abundant time and                             Wilson et al, 2010), but it is difficult for designers to conceive
       resources, design engineers in established companies often con-                           the relevance of distant domains (Gick and Holyoak, 1980;
       duct user studies, market analysis, marketing research, expert                            Weisberg, 2006; Chan et al, 2015). Chan et al. (2011) observed
       panels, brainstorming sessions, etc., to explore new design oppor-                        that far-field analogies led to new concepts of higher novelty
       tunities (Chen et al., 2012; Ulrich and Eppinger, 2015; Kang et al.,                      but fewer concepts than near-field analogies. In a different experi-
       2016). Recently, design thinking (Brown, 2008) has gained popu-                           ment, Chan et al. (2015) further observed that the most creative
       larity in practices for its emphasis on empathizing with and under-                       solutions arise from near distance stimuli, owing to easier percep-
       standing of users to identify design opportunities. Cagan and                             tion and more obvious relevance to the design problem.
       Vogel (2002) had proposed integrated analysis of social, economic                              Fu et al. (2013b) posited that stimuli across a moderate ana-
       and technology factors and trends to identify the product oppor-                          logical distance between source and target domains are most
       tunity gap. Such methods and processes are normally time- and                             favorable. Likewise, by measuring the historical combination fre-
       resource-consuming. Entrepreneurs are often motivated by an                               quency (which is opposite to novelty) of the set of prior technol-
       intuitively conceived design opportunity from their own experi-                           ogies used in a patented invention, He and Luo (2017) found that
       ences, frustrations in daily life, dissatisfaction as a consumer, or                      the inventions with moderate combination frequency, which
       hobbies to start up a new business (Rohan and Hornblower, 2008).                          Chan et al. (2015) termed combination distance, present the high-
           In this paper, we focus on the ideation regarding technologies                        est invention value, measured by the future citations of a patented
       and their relationships for design opportunities at the fuzzy front                       invention. In addition, Srinivasan et al. (2017) allowed designers
       end of a design process, and aim to develop a rapid design oppor-                         themselves to search and choose patents from the entire patent
       tunity ideation tool. Despite the awareness of the importance to                          database (of Google Patents) for inspiration, and found that
       analyze the technologies to identify design opportunities (Cagan                          designers most frequently obtained inspiration from patents in a
       and Vogel, 2002; Rohan and Hornblower, 2008; Ulrich and                                   medium knowledge distance to the design problem. As such a dis-
       Eppinger, 2015), structured methods or tools are still underdeve-                         tance increases, the novelty of generated concepts increases but
       loped in the literature.                                                                  their quality decreases. Despite the general understanding of the
           Prior studies have suggested that new designs arise from ana-                         influences of such “distances” on ideation outcome, empirical
       logical transfer (Weisberg, 2006; Linsey, 2007), synthesis (Arthur,                       findings have been mixed, in part due to the variety of ways to
       2009; Youn et al., 2015), blending (Taura and Nagai, 2012), or                            measure nearness or farness in contexts.
       other forms of transfer or transformation of existing knowledge,                               Taken together, the literature has implied the difficulty to con-
       concepts, or technologies, often across different domains                                 ceive new design opportunities by relating to technologies in
       (Hatchuel and Weil, 2009). However, it remains a question                                 domains that are distant from the designer’s specialization or

Downloaded from https://www.cambridge.org/core. 23 Jan 2021 at 07:12:19, subject to the Cambridge Core terms of use.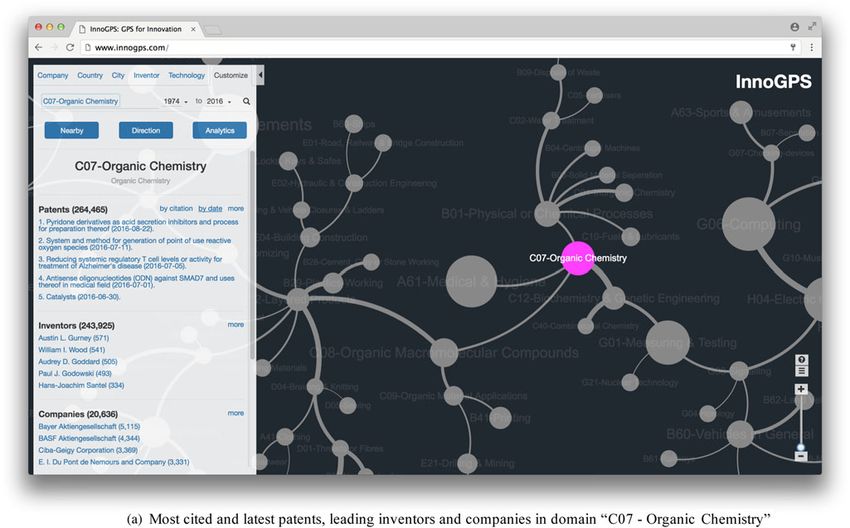
Artificial Intelligence for Engineering Design, Analysis and Manufacturing                                                                                               451

        design problem. Therefore, designers can be more guided and                                  In this study, we adopt the knowledge proximity metric
        informed by a macro picture of the various technologies in the                            depicted in Eq. (1), that is, the cosine of the angle between the
        total technology space, as well as the information regarding                              two vectors representing two patent classes’ distributions of cita-
        their distances in the space, to seek for systematic inspiration.                         tions to specific unique patents, formulated as
        The Bayesian network of patents of Fu et al. (2013a) quantifies
        and visualizes the analogical distances between different patents                                                               Cik C jk
                                                                                                                                      k
        and the design problem, and thus designers can potentially use                                                      wij =
                                                                                                                                    2
                                                                                                                                             2 ,                                 (1)
        the network to identify patent stimuli near or far from the design                                                             Cik       C jk
        problem. Their network only covers a small set of patents, and                                                                  k         k
        addresses a specific predefined design problem, as in most prior
        studies on patent retrieval for design stimulation.                                       where Cij denotes the number of citations of all patents in patent
           Recent studies of patent data mapping have presented some                              class i to the specific patent j; k belongs to all patents. The proxi-
        large technology maps that are potentially useful for design idea-                        mity value is between (0, 1) and indicates the similarity of the
        tion. These studies normally utilize an entire patent database to                         knowledge bases of two domains. This metric was found highly
        construct network maps of all the technology domains defined                              predictive on cross-domain technology diversification in the
        in patent classification systems (Kay et al., 2014; Leydesdorff                           case study of Google and the development of its driverless car
        et al., 2014). Such network maps have been used to analyze the                            project (Luo et al., 2017) and highly correlated with and represen-
        patent portfolio diversification of individual inventors (Alstott                         tative of many other alternative measures (Yan and Luo, 2017b).
        et al., 2017b), firms (Yan and Luo, 2017a), regions (Boschma                              In this research, we used more than five million US patent records
        et al., 2015), and the design space evolution of a system product                         and their citation information to calculate Eq. (1) and estimate the
        (Song et al., 2016), but not yet to support design ideation. The                          proximities between all pairs of the 121 patent classes. The use of
        aim of such maps to cover the entire technology space determines                          the richest possible historical data provides the best empirical
        the nodes on the maps are technology domains (i.e., aggregations                          approximation of knowledge distance.
        of technologies) and makes it not useful to inspire designers for                             The original technology network showed connection between
        concrete technical solutions. In this research, we propose to use                         almost all nodes: of a total of 7260 (=121 × 120/2) possible
        such a macro TSM to aid in the rapid ideation of high-level design                        links, only 65 of them are not connected (i.e., cosine = 0).
        opportunities at the fuzzy front end of the design process.                               Meanwhile, we found most links are extremely weak and thus
                                                                                                  not informative. We then filtered the original network to a max-
                                                                                                  imum spanning tree (MST) that only includes the strongest 120
        Methodology                                                                               links that connect the 121 technology domains, to reveal the back-
                                                                                                  bone structure of the technology space. Finally, a force-directed
        The total TSM
                                                                                                  algorithm minimizing graph energy (Kobourov, 2012) was
        We use the entire utility patent database of United States Patent                         applied to the MST to generate an aesthetically pleasing network
        and Trademark Office (USPTO) from 1974 to 2016 to construct                               layout. This layout is shown in Figure 1.
        the technology network map to represent the total technology                                  We visually examined the relative positions of different tech-
        space. We call the resultant map the total TSM. The database con-                         nology domains on the map based on our engineering knowledge.
        tains 5,256,505 US utility patents, and each of them is classified in                     Its structure is generally satisfactory in that the technologies based
        one or multiple seven-digit IPC classes. The patent classification                        on highly similar knowledge bases, for example, “electric commu-
        system provides a natural and hierarchical means to approximate                           nication” and “computing”, are positioned proximately, and the
        all known technology domains and categorize the patents belong-                           technologies based on distinct knowledge bases, for example,
        ing to different domains. In the network map (Fig. 1), different                          “machine elements” and “infographics and display”, hold distant
        nodes represent different technology domains and can be opera-                            positions on the map. Especially, the map reveals a few clusters of
        tionalized at different aggregation levels, for example, three-/                          technologies, indicating such mega technology regions as
        four-/five-/six-/seven-digit IPC classes. Prior research has sug-                         mechanical, electronics, materials, bioengineering, information
        gested that three-digit IPC classes provide the best resolution                           technology, etc.
        and ease for visual analytics (Leydesdorff et al., 2014). For exam-                           The TSM provides a systematic picture of various technologies
        ple, the node F02 categorizes the patents for combustion engine                           and the visual information of their relative distances or proximi-
        technology, and B82 categorizes the patents for nanotechnology.                           ties. The designer may simply browse the technologies on the map
        This level of abstraction is the most suitable for our aim of con-                        to conceive design opportunities that relate his or her current
        ceiving design opportunities and directions.                                              technologies and expertise with other technologies found on the
            After removing several undefined ones, we included a total of                         map. In the following, we use an example to demonstrate how
        121 three-digit classes in the network map to approximate the                             to use the TSM to aid designers in the exploration and conception
        widest possible technology space. The 121 nodes, that is, technol-                        of new design opportunities.
        ogy classes or domains, are positioned on the map according to
        knowledge proximity. A qualified measure of knowledge proxi-
        mity must capture the intuition that the knowledge and capabil-                           Design opportunity conception using TSM
        ities (e.g., human skills and physical equipment) required to
        design technologies in one domain can also be easily used for                             Assume we explore new product design opportunities for
        designing technologies in the other. In the literature, various mea-                      “Sphero”, a SRR toy designed and commercialized by the com-
        sures for proximity have been proposed, primarily using the infor-                        pany Sphero Inc.1 Sphero has a spherical shape and is propelled
        mation of citations and classifications in patent documents (Joo
        and Kim, 2010; Kay et al., 2014; Leydesdorff et al., 2014).                                  1
                                                                                                      See more information of the toy and the company at http://www.sphero.com/sphero.

Downloaded from https://www.cambridge.org/core. 23 Jan 2021 at 07:12:19, subject to the Cambridge Core terms of use.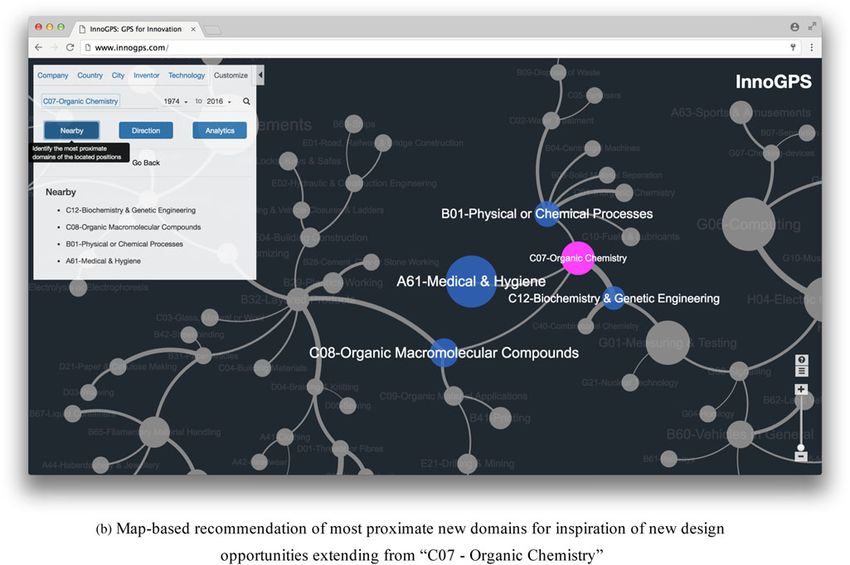
Downloaded from https://www.cambridge.org/core. 23 Jan 2021 at 07:12:19, subject to the Cambridge Core terms of use.
452
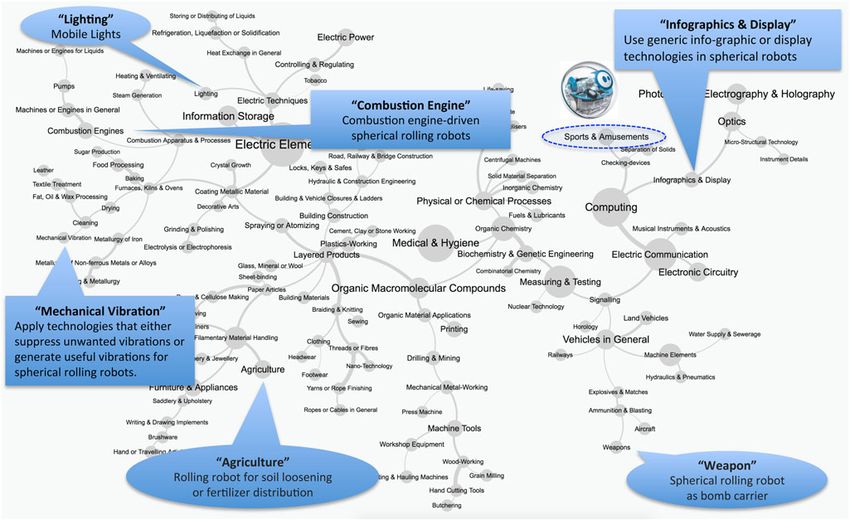
Fig. 1. The total technology space map (TSM). Node size corresponds to the patent count from 1974 to 2016 in each represented IPC class.
Jianxi Luo et al.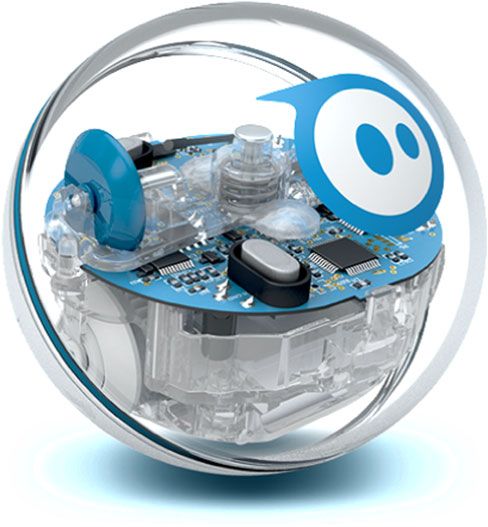
Artificial Intelligence for Engineering Design, Analysis and Manufacturing                                                                                453

                                                                                                  These ideas are potential SRR design opportunities (see annota-
                                                                                                  tions on the map in Fig. 3).
                                                                                                      Alternatively, the designer may conceive design opportunities
                                                                                                  via leveraging technologies or solutions in other domains for
                                                                                                  new designs of the designer’s current technologies or products.
                                                                                                  In the case of SRRs, seeing “infographics and display” near “sports
                                                                                                  and amusement” on the map might suggest the exploration of
                                                                                                  existing infographic or display technologies for potential uses in
                                                                                                  SRRs. Finding “combustion engines” on the map may stimulate
                                                                                                  the designer to consider using a combustion engine to propel a
                                                                                                  large SRR (for carrying goods or passengers). Observing
                                                                                                  “mechanical vibration” may motivate the designer to explore
                                                                                                  technologies that either suppress unwanted vibrations or generate
                                                                                                  useful vibrations for SRRs. These ideas are high-level design direc-
                                                                                                  tions (annotated in Fig. 3).
                                                                                                      The example above is basic and straightforward, and solely for
                                                                                                  the purpose of demonstrating how to use the TSM as a rapid idea-
                                                                                                  tion aid. The first author of the paper rapidly conceived these
                                                                                                  design opportunities in 10 min, even though he did not have
                                                                                                  any background in the respective domains, for example, weapons
                                                                                                  or mechanical vibration technologies. Coming up with these ideas
                                                                                                  within this short period of time would have been inconceivable
                                                                                                  without the map. In the next chapter, we present and analyze
                                                                                                  two experiments (i.e., real TSM use cases), two of several in
        Fig. 2. Sphero (a generic SRR). Picture source: http://www.sphero.com/sphero.             which we applied the TSM as an ideation tool to enhance ideation
                                                                                                  practices, to show its value and limitations.

        by a self-contained cart, as shown in Figure 2. It has an on-board                        Experiments of TSM as rapid ideation aid
        micro controller unit, and users may manipulate its motion remo-
                                                                                                  ANN design opportunity ideation
        tely via a handset. Sphero has been designed and commercialized
        as a toy, falling into the domain “sports and amusements” on the                          In July 2017, a group of young designers, that is, undergraduate
        map. The company wants to explore new product design oppor-                               students at Singapore University of Technology and Design
        tunities extending beyond their prior toy products. This is indeed                        (SUTD), took part in an international innovation contest on
        a common practice of designers, product managers, and                                     designing novel and useful applications of “ANN”. This group
        companies.                                                                                of young designers brainstormed for 2 days, but only generated
            The designer explores new design opportunities for SRRs by                            one transformative idea they wished to pursue: “extract the emo-
        browsing the map and navigating the various technologies                                  tional implications of text messages and modifying an image of a
        throughout the TSM, some of which are farther or closer than                              face to resemble the same emotion”. This idea can be classified in
        others to the domain “sports and amusement”. Using the map                                the sole domain “computing” in the TSM. Most ANN technolo-
        may inspire the designers of Sphero Inc. to consider and relate                           gies today can be found in “computing”. The students were con-
        other technologies for the design of SRRs. Such map navigation                            cerned about the limited novelty of their design idea.
        behavior is similar to how a traveler uses a geographical map to                              To enhance their exploration of design opportunities, we orga-
        explore interesting sites or attractions to visit according to their                      nized a 30-min ideation session using the TSM. We provided each
        distance or proximity in the physical space. By analogy, when                             of the designers with the map in Figure 1 printed on an A3 paper,
        we need the directions for new designs in the technology space,                           asked them to individually browse the map for opportunities that
        a map of various technologies with their distance or proximity                            relate ANN technology to the domains on the map, and annotate
        information will be useful. Browsing the overall TSM may inspire                          the conceived opportunities on the map with pointers to the cor-
        the designer to conceive innovative design opportunities in at                            responding inspiration domains. The seven maps annotated by
        least two basic manners.                                                                  seven designers contained 54 ideas of new ANN design opportu-
            First of all, new design opportunities for SRRs may be con-                           nities, with reported inspiration from 29 different domains that
        ceived as applying SRRs to new applications in other technology                           have varied distances to “computing” in the technology space.
        domains. When browsing the map, the designer might be                                         Some example ideas and the map nodes that inspired these
        reminded of various technology domains, some of which he or                               ideas include: ANN suggesting fonts based on the semantics of
        she may be unfamiliar with. For instance, seeing “lighting” on                            a paragraph (inspired by the node “writing and drawing imple-
        the map, a designer may conceive potential applications of the                            ments”), neural network arts (inspired by the node “decorative
        SRRs in providing mobile lighting at home or in public spaces.                            art”), and protein creation (inspired by “biochemistry and genetic
        Finding “agriculture” on the map may inspire the designer                                 engineering”), and so on. As shown in Figure 4, many ANN
        about the potential applications of SRRs for agricultural uses,                           design opportunities were inspired by domains that are distant
        such as soil loosening and fertilizer distribution on farmlands.                          from the main domain of ANN, “computing”. For example, five
        “Weapon” may stimulate the conception of designing SRRs as                                ideas were in “cloth”, and another five ideas were in “writing
        bomb carriers or rolling platforms that support machine guns.                             and drawing implements”. A search for “neural network” in the

Downloaded from https://www.cambridge.org/core. 23 Jan 2021 at 07:12:19, subject to the Cambridge Core terms of use.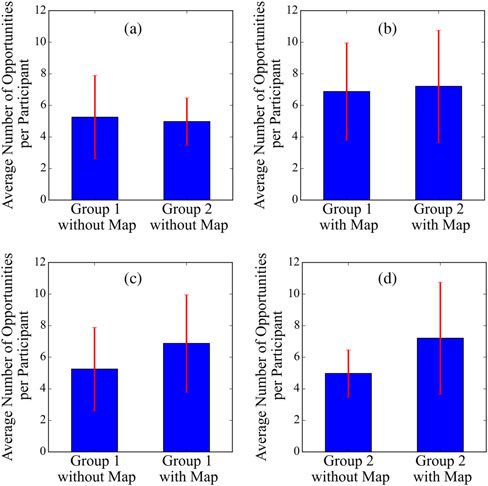
454                                                                                                                                                Jianxi Luo et al.

       Fig. 3. Example design opportunities conceived by applying SRRs to new applications in other domains (oval callouts), or by leveraging technologies in other
       domains for new designs of SRRs (rectangular callouts).

       Fig. 4. The map nodes that inspired the largest numbers of new design ideas related to ANN. Numbers of ideas generated regarding a domain are reported in
       parentheses. Node color intensity corresponds to the number of patents found by the search using “neural network” as keywords. The grey nodes are domains
       where no ANN patent is found and represent the “white space” for innovation.

Downloaded from https://www.cambridge.org/core. 23 Jan 2021 at 07:12:19, subject to the Cambridge Core terms of use.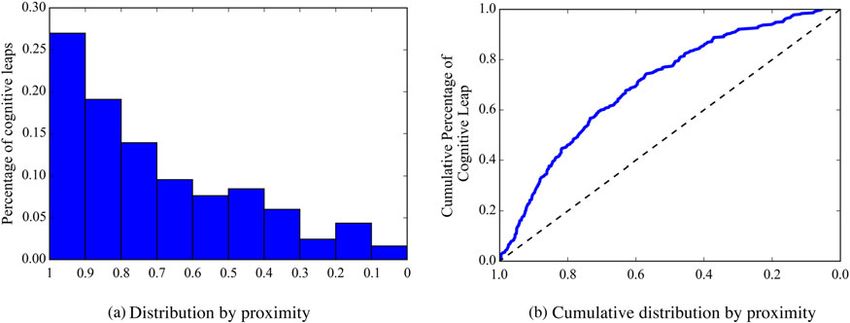
Artificial Intelligence for Engineering Design, Analysis and Manufacturing                                                                                  455

        patent database found no mention in the classes “cloth” or “writ-                               same vision (item #1). Pivoting is a common practice of
        ing and drawing implements”. In contrast, the same search term                                  technology entrepreneurs, when their original ideas fail to
        resulted in 2005 patents in the class “computing”, 279 patents in                               work or they need new opportunities for further growth
        the class “measurement and testing” and 159 in the class “medical                               despite past successes. The participants spent 30 min to
        and hygiene”. The inspiration domains with no or a small number                                 rapidly ideate and generate as many new design ideas as pos-
        of ANN prior arts represent the “white space” for innovation and                                sible and reported these as item #3 in the form, using one
        may provide relatively novel design opportunities. The designers                                sentence per idea. Thus, these ideas represent abstract design
        compared all the 54 ideas and selected one idea inspired by “writ-                              opportunities.
        ing and drawing implements” for prototyping. They eventually                                (3) The participants were given a brief introduction to the total
        won the first place in the ANN design competition, and the                                      TSM printed on A3 paper, and then asked to spend about
        judges gave high scores for novelty of their design.                                            10 min to browse the map, identify the “original domains”
           We sought feedback from the designers regarding their experi-                                on the map, that is, the technology domains of the product
        ences of using the TSM as a rapid ideation aid. All of them agreed                              or technologies in the original idea (item #2) and report the
        that the map stimulated them to realize the potential of some                                   original domains as item #4 in the form. Such a task allowed
        technology domains that they would not likely have been able                                    the participants to familiarize themselves with the technology
        to conceive without browsing the map, due to the knowledge dis-                                 domains and structure of the map.
        tance and their specialization and limited cognitive capacity to                            (4) The participants were given 30 min to browse the map and
        cross the knowledge distance. We received the same feedback                                     conceive new design opportunities that relate the 121 technol-
        from other cases in which we applied the TSM as a visual ideation                               ogy domains labeled on the map to their vision (item #1).
        aid, suggesting the map may indeed support designers to think                                   They were also encouraged to either (1) apply their original
        beyond their specialization and familiar domains, and to consider                               design ideas (item #2) for new applications in other technol-
        technologies and domains at a large knowledge distance for                                      ogy domains, or (2) leverage technologies or solutions in
        design.                                                                                         other domains to improve their original design idea. Using
                                                                                                        the provided form, the participants had to report the new
                                                                                                        ideas (item #5) together with the technology domains that
        Entrepreneurial venture opportunity ideation
                                                                                                        inspired respective ideas, that is, the inspiration domains
        The ideation activity was conducted in one of the class sessions of                             (item #6). As in step 2, each idea in item #5 had to be descri-
        the course “30.111 Entrepreneurship” at the SUTD, which is a                                    bed in one sentence.
        technical elective course for final year undergraduate engineering
        students. The core experiential learning component of the course                               The resulting data were a one-page form per participant,
        is a semester-long (13 weeks) entrepreneurial design project,                               containing:
        which requires the student entrepreneurs to form a team, identify
        a technology-based venture opportunity, design and produce a
        working prototype, launch a crowdfunding campaign on                                        (1) A single sentence statement of the vision for his or her entre-
        Kickstarter.com, and then pitch to angel investors. Most of the                                 preneurial design project;
        projects in this course have been based on hardware designs,                                (2) A brief description of his or her current design idea to fulfil
        and Kickstarter.com requires a working prototype for the crowd-                                 the vision;
        funding campaign. Designs and crowdfunding campaigns from                                   (3) New design opportunities rapidly conceived in 30 min;
        the classes in 2015–2017 can be found at http://www.tech-entre-                             (4) Original domain(s): the technology domains, that is, three-
        preneurship.com/.                                                                               digit IPC classes, of the product or technologies in the current
            The design opportunity ideation activity was conducted iden-                                idea;
        tically twice for two class sessions2 (group 1 and group 2) in week                         (5) New design opportunities rapidly conceived through brows-
        3 in September 2017. At that point, the participants, that is, young                            ing the map in 30 min;
        technical entrepreneurs, have already decided about their venture                           (6) Inspiration domain(s): the technology domains that provided
        ideas to design and prototype for the crowdfunding campaign, but                                inspiration for the newly conceived design opportunities
        have not entered the physical prototyping phase for the project.                                in #5.
        This situation in the entrepreneurial design project is a typical
        fuzzy front end. The participants were offered this ideation activ-                             Data in the report forms allowed us to compare the quantities
        ity, and told that it would provide them an opportunity to explore                          of design opportunities conceived without versus with browsing
        broader and possibly better ideas for their design projects. A total                        the TSM. Assessing the quality and novelty of the design oppor-
        of 54 students participated in the activity: 24 in group 1 and 30 in                        tunities conceived at this fuzzy front end was not meaningful due
        group 2. The activity consisted of the following steps:                                     to the abstractness of the ideas (described in one sentence) at this
                                                                                                    stage. The 24 participants in group 1 conceived 126 design oppor-
        (1) Each participant was asked to report the current entrepre-                              tunities without the map and 165 new design opportunities with
            neurial vision of his or her team (item #1) and the initial                             the map. The 30 students in group 2 conceived 149 design oppor-
            design idea (item #2) to fulfil the vision in a report form,                            tunities without the map and 216 new design opportunities with
            although this ideation activity was individual.                                         the map. It seems that the map enhanced rapid ideation produc-
        (2) The participants were asked to pivot from their existing idea                           tivity, as measured by the number of design opportunities con-
            and generate alternatives that also could potentially fulfil the                        ceived. In particular, we observed that without the map, most
                                                                                                    participants stopped ideation before 30 min ran out, and the
            2
             The course had two identical class sections each week, and participants were free to   use of the map aid allowed them to conceive new and more design
        attend either one.                                                                          opportunities.

Downloaded from https://www.cambridge.org/core. 23 Jan 2021 at 07:12:19, subject to the Cambridge Core terms of use.
456 Jianxi Luo et al.
The participants in both groups conceived a similar average Table 1. The t tests (with p-values in parentheses) for the pairwise comparisons
number of design opportunities without the map aid (Fig. 5a) of ideation performances without and with the map in two groups
and with the map aid (Fig. 5b). With map browsing, the partici- ID in
pants conceived about 40% more design opportunities on average Figure 5 Comparison pairs Difference t-test ( p-value)
(i.e., two more ideas per participant) than they did without the
map, in either group (Fig. 5c,d).3 These differences are statistically (a) Group 1 without map 0.2833 0.4969 (0.6214)
versus group 2 without map
significant based on pairwise t-tests, reported in Table 1. We also
communicated with the participants after the rapid ideation activ- (b) Group 1 with map versus −0.3250 −0.3543 (0.7246)
ity. The feedback and comments include that the map is inspiring group 2 with map
for out-of-the-box thinking, the big picture of various technolo- (c) Group 1 without map −1.6250 −1.9608 (0.0560)
gies prompts them of the relevance of some technologies or versus group 1 with map
domains that they would not be able to think of or recall without (d) Group 2 without map −2.2333 −3.1776 (0.0023)
the map, among others. versus group 2 with map
After the ideation exercise in week 3, students went through
additional rounds of ideation, brainstorming, user surveying
and market research, prototyping and testing, redesigns, etc. In
week 10, 11 teams launched 11 Kickstarter campaigns. Despite
the evolution of ideas and projects during the following 8
weeks, we find that the products in later Kickstarter campaigns
inherited some elements of the initial design opportunities con-
ceived during the ideation exercise in week 3. Particularly, eight
out of 11 Kickstarter products exhibit elements of the initial
design opportunities conceived without the TSM, whereas all 11
products inherited elements of the opportunities conceived with
the TSM in week 3.
In addition, with inspiration from the literature (see “Literature
review” section), we also investigated knowledge distance of con-
ceptual leaps in the technology space between the original
domains (item #4) and inspiration domains (item #6) for each
new design opportunity conceived with browsing the TSM.
Among the total 381 design opportunities, 361 were reported
with valid information of their original and inspiration domains
for distance analysis. For each of these design opportunities, we
first calculated the average knowledge proximity of the inspiration
domain(s) to the corresponding original domain(s), and then the
proximity percentile of the design opportunity, that is, the per-
centage of all other non-original domains that have equal or
lower average proximities to the original domain(s) than this
inspiration domain(s). Figure 6 reports the probability distribu- Fig. 5. Comparison in average number of design opportunities conceived per partic-
ipant with and without using the TSM aid in two groups: (a) distribution by proximity,
tion and cumulative probability distribution of the 361 conceptual (b) cumulative distribution by proximity.
leaps by their proximity.
The probably distribution’s left skewness in Figure 6a and the
accumulative distribution curve’s being above the main diagonal
on the potentials and challenges to conceive design opportunities
in Figure 6b suggest that designers are more likely to conceive
that relate technology domains with varied distances.
new design opportunities with the inspiration from domains
more proximate to the original domains than from more distant
domains.4 That is, the inspiration for new design opportunities Discussion: potentials and limitations
is strongly conditioned by the knowledge distance between the
Computer-aided ideation
original domains and the inspiration domains as in our TSM.
These results comply with the prior theoretical understanding Based on the foregoing results and the literature, when navigating
on conceptual leaps, and suggest that the visual and quantitative technologies on the map to conceive new design opportunities,
information of the relative distances between different technology the designers should be aware of the natural ease and tendency
domains in this specific TSM in Figure 1 may provide indication to obtain inspiration from the domains near the present designs,
that is, short conceptual leaps, and also be aware of the trade-offs
3 of exploring proximate versus distant domains. In turn, such
A cross-comparison confirms that the participants in one group conceived 40% more
design opportunities on average with the map aid than the participants in the other group understanding can be programmed into a computer algorithm
without the map aid. to provide intelligent recommendations of new technology
4
As a robustness check, we also analyzed the knowledge proximity between each of the domains for consideration and also inform the opportunities
original domains to each of the inspiration domains (totaling 1390 data points) and the and challenges associated with knowledge proximity or distance,
average proximity between the entire set of original domains and each inspiration domain
of the map-inspired new design opportunities (totally 451 data points). The qualitative
when designers navigate the domains on the map for inspiration.
patterns in Figure 6 hold when we tested these alternative ways of analyzing conceptual For instance, an algorithm can be developed to recommend
leaps. the designers a combination of technology domains with near,
Downloaded from https://www.cambridge.org/core. 23 Jan 2021 at 07:12:19, subject to the Cambridge Core terms of use.Artificial Intelligence for Engineering Design, Analysis and Manufacturing 457
Fig. 6. Distribution of conceptual leaps by knowledge proximity in the entrepreneurial design opportunity ideation activity. (a) Most cited and latest patents, lead-
ing inventors and companies in domain “C07 – organic chemistry”. (b) Map-based recommendation of most proximate new domains for inspiration of new design
opportunities extending from “C07 – organic chemistry”.
moderate, and far distances to the original domains of his or her specific technologies at various levels, rather than actual technol-
existing products or technologies, and also simultaneously pro- ogies. In contrast, the patent network of Fu et al. (2013a) is con-
vide theory-based intelligent advice regarding the pros and cons crete, but only covers a small set of patents to address a specific
of exploring technologies and domains of different distances to predefined function design problem.
the positions of the designer’s current products or technologies. After conceiving design opportunities from the inspiration of a
The computer program may embed features to record a designer’s domain on the TSM, to further conceive technically detailed
browsing behaviors and thus “learn” his or her subconscious pref- design concepts (which have such specifics as sub-functions, com-
erences. With the machine-learnt preferences of the designer (e.g., ponents, structures, and working mechanisms for prototyping),
novelty vs. ease), the computer algorithm may further make spe- the designer may further exploit and learn detailed technologies
cific recommendations on technologies or domains to the and specific methods, solutions, and techniques in a domain for
designer, for either meeting the preferences or balancing their inspiration. For instance, the Sphero toy designers can rapidly
biases as aids for design opportunity conception. For example, develop technical knowledge in the “agriculture” domain by
if the designer has inputted his interest in novelty and radicalness working with experts specialized in that domain to actually pur-
into the software program, but the domains being browsed on the sue the perceived high-level design opportunity of rolling robots
digital map on the computer are always near the original domain for fertilizer distribution in farmlands. To pursue vibration-
(s), the algorithm may intelligently recommend technologies related designs of SRRs, the designer may retrieve and read the
farther from his or her original domain(s) for consideration. By patents classified in the IPC class B06 on “mechanical vibration”
contrast, if the designer prefers the ease and effectiveness of idea- to learn and use specific mechanical vibration technologies. The
tion, the system may focus the recommendations on technologies designer may start with the most cited patents in B06 to first
near the original domain(s). learn the foundational technologies in the domain and the most
Such machine-learning and intelligent recommendation func- recent patents to learn the frontiers. The design information in
tions (based on the theoretical understanding) and the TSM (if patent documents may stimulate specific and technical design
made digital and interactive) can be potentially integrated into a concepts.
computer-aided ideation system to enhance designers’ opportu- In order to facilitate heuristic interactive map browsing for
nity search and conception process at the fuzzy front end of the design opportunity conception, together with domain-specific
design process. With such a computer-aided ideation system, patent retrieval for stimulating more detailed technical concepts,
designers still make their own choices to pursue either balanced we have integrated the TSM and map-based functions, such as
or biased design opportunity exploration strategies, but the technology positioning (e.g., position “neural network” or
exploration of the vast technology space will be more informed “SRR” on the map), domain recommendation (according to inter-
and guided by the theory-based artificial intelligent recommenda- domain knowledge proximity), and domain-specific patent
tions and advice. The system does not replace the human in terms retrieval (via API to directly access live data of the USPTO patent
of thinking and conceiving new opportunities, but aims to database) in a cloud-based computer-aided ideation system, that
enhance human conception. is, InnoGPS (accessible at www.innogps.com).
Furthermore, the TSM of technology domains illustrated in The digitalized TSM and data-driven InnoGPS can potentially
the present paper is most suitable to conceive abstract design enable a knowledge distance-based organization and visualization
opportunities or high-level design directions, instead of nuanced of the world’s existing and growing technologies and design pre-
technical concepts that can be immediately prototyped and imple- cedents from the patent databases or other design repositories.
mented. This in part results from our interest and need for the InnoGPS can further embed the above-mentioned machine-
map to represent the total technology space and provide a sys- learning and AI functions to enhance the exploration of technol-
tematic picture of various technologies that humankind has cre- ogy domains for high-level opportunity conception and the
ated today. Thus, the map is naturally at a macro level and the search for technologies as stimuli for technical concept genera-
abstract nodes on the map represent domains or aggregations of tion, according to knowledge distances. Figure 7 shows two
Downloaded from https://www.cambridge.org/core. 23 Jan 2021 at 07:12:19, subject to the Cambridge Core terms of use.458 Jianxi Luo et al.
Fig. 7. InnoGPS interface screenshots (http://www.innogps.com).
Fig. 7. (Continued).
Downloaded from https://www.cambridge.org/core. 23 Jan 2021 at 07:12:19, subject to the Cambridge Core terms of use.Artificial Intelligence for Engineering Design, Analysis and Manufacturing 459
screenshots of the interface of InnoGPS. Interested readers are provides the best design opportunity conception outcome.
invited to test using InnoGPS. Therefore, the natural next step is to conduct more systemic
human experiments to compare alternative TSM designs and
also benchmark the TSM-based ideation with other ideation tech-
Limitations
niques aimed for the same utility. Such comparative and bench-
In the present paper, we have focused on one specific TSM for marking studies may potentially identify optimal map designs
introduction and demonstration purposes, and only compared among the alternatives, as well as proper strategies, procedures,
the map-aided ideation with the basic ideation with no aid. For and conditions for the effective use of TSM.
further validation of using a TSM with knowledge distance infor-
mation for ideation, one can compare the outcomes of ideation
experiments with browsing the TSM versus just a list of IPC Concluding remarks
class names. To systematically uncover the advantages, limita-
To summarize, this paper presents the total TSM as a rapid idea-
tions, and applicabilities of the TSM-based ideation, in future
tion aid for designers to conceive new design opportunities at the
research it will be important to conduct human experiments to
fuzzy front end of the design process. A designer may simply
benchmark it against alternative ideation techniques that are
browse the map to navigate various technologies and relate
similarly aimed to support early phase design opportunity
them as a way to quickly conceive new design opportunities.
conception.
The two experiments suggest that the TSM enables designers to
Also, the utilities of the TSM might be conditioned by a few
conceive innovative design opportunities across greater knowl-
design features of the map itself. First of all, the descriptions of
edge distance, and also conceive more opportunities than they
technology domains, which are nodes in the map, may use differ-
do without the map aid. Interested readers may print out the
ent words and affect human perception about the corresponding
TSM in Figure 1 and use it to explore design opportunities for
technologies and the conception of design opportunities, when
their own specialized design practices.
the designer browses and reads the map. In particular, the defini-
This research contributes to design creativity studies and prac-
tional resolution of “technologies domains” also matters. The net-
tice. The TSM aims to make the exploration and conception of
work map in the present paper is comprised of three-digit IPC
new design opportunities more proactive, guided, scientifically
classes, which represent relatively broad and general technology
grounded, and visually informed. The TSM based on mining
domains according to functions and application areas of patents.
the patent data is not new in the information science literature,
Each three-digit IPC class can be further decomposed to four-
but was not previously used to support design ideation.
digit classes, each of which can be further decomposed into
Compared with the ideation methods that are used in later stages
five-, six-, or seven-digit classes. Maps using finer grained IPC
of design and aimed for solution concepts for prototyping and
classes may provide more nuanced inspiration, than three-digit
implementation, the TSM is suitable for conceiving abstract
IPC classes. Also, patent classes defined in different classification
design opportunities and high-level directions at the fuzzy front
systems, such as IPC, Cooperative Patent Classification (CPC) and
end. Compared with traditional user studies, expert panels, and
United Patent Classification (USPC), as well as other hybrid clas-
market research to identify design opportunities at the fuzzy
sification systems, might provide different inspirations and thus
front end, the TSM does not require any human or financial
conception outcomes.
resources for the rapid ideation of design opportunities.
Secondly, the knowledge proximity between technology
Particularly, we have integrated the TSM and various map-
domains can be measured using patent data in various ways.
based functions into the cloud-based system for computer-aided
Different measures, for example, Jaccard Index, cosine similarity,
ideation, that is, InnoGPS, to enable interactive digital map
and co-classification (for a summary and comparison of alterna-
browsing for high-level design opportunity conception as well
tive measures, please refer to Yan and Luo, 2017b) using different
as patent retrieval for stimulating technical concept generation.
information items in the patent documents, may lead to different
Machine learning through designers’ map browsing behaviors
map structures, which in turn affect the map navigation routes
and creativity theory-based AI recommendation functions can
and thus conception outcomes. In this paper, we only experimen-
be potentially added into the system to enhance the human pro-
ted with one knowledge proximity measure to construct the TSM.
cess of design opportunity conception.
It is still worth exploring the difference in conception outcomes
However, this study is still preliminary. The paper has pri-
from using alternative maps based on different measures in future
marily focused on introducing and demonstrating the method
research.
and tool, and only reported evidence on the advantage of idea-
In addition, different visualizations and structure layouts of the
tion using a specific TSM (based on three-digit IPC classes,
same network might also affect the map navigation behaviors and
cosine similarity knowledge distance metric, and MST visualiza-
conception outcomes. In the present study, the map is created by
tion layout) over basic ideation without any aid. Future research
applying a force-directed algorithm to the MST of the original
should compare the effects of alternative TSM designs to poten-
network. Force-directed algorithm, if applied to a less filtered net-
tially identify optimal maps for specific use contexts or condi-
work, may lead to a different network layout. Heat map, tree map,
tions. Future research should also benchmark the TSM-based
and contour map are alternatives to network graphs for visualiz-
ideation method against alternative ideation techniques for
ing the technology space. On such maps, technology domains are
early phase design opportunity conception, in order to further
still positioned relatively according to their knowledge proximi-
uncover the advantages, limitations, and applicabilities of the
ties, despite no links visualized.
TSM and then develop procedures and strategies for its effective
In sum, there exist alternative ways to create an empirical map
uses in context.
of the total technology space. Despite its demonstrated utility of
the TSM based on three-digit IPC classes, cosine similarity metric, Acknowledgments. This research is supported by SUTD-MIT International
and MST layout in this paper, it is unclear if this specific TSM Design Centre (IDC, idc.sutd.edu.sg, IDG31300112) and Singapore Ministry of
Downloaded from https://www.cambridge.org/core. 23 Jan 2021 at 07:12:19, subject to the Cambridge Core terms of use.460 Jianxi Luo et al.
Education Tier 2 Academic Research Grant (T2MOE1403). The authors are Leydesdorff L, Kushnir D and Rafols I (2014) Interactive overlay maps for US
also thankful to the comments from the participants of the Design patent (USPTO) data based on International Patent Classification (IPC).
Creativity workshop at the 17th Conference on Design Computing and Scientometrics 98, 1583–1599.
Cognition at Northwestern University in 2016. Li Z, Tate D, Lane C and Adams C (2012) A framework for automatic TRIZ
level of invention estimation of patents using natural language processing,
knowledge-transfer and patent citation metrics. Computer-Aided Design
References 44, 987–1010.
Alstott J, Triulzi G, Yan B and Luo J (2017a) Mapping technology space by Linsey J, Markman A and Wood K (2012) Design by analogy: a study of the
normalizing technology relatedness networks. Scientometrics 110, 443–479. WordTree method for problem re-representation. Journal of Mechanical
Alstott J, Triulzi G, Yan B and Luo J (2017b) Inventors’ exploration across Design 134, 041009.
technology domains. Design Science 3, e20. Linsey JS (2007) Design-by-analogy and representation in innovative engi-
Arthur BW (2009) The Nature of Technology: What it is and How it Evolves. neering concept generation. Doctoral Dissertation at The University of
New York City, NY: Free Press, Simon & Schuster. Texas at Austin, United States.
Boschma R, Balland P-A and Kogler DF (2015) Relatedness and technologi- Luo J, Yan B and Wood K (2017) InnoGPS for data-driven exploration of
cal change in cities: the rise and fall of technological knowledge in US design opportunities and directions: the case of Google and its driverless
metropolitan areas from 1981 to 2010. Industrial and Corporate Change car project. Journal of Mechanical Design 139, 111416.
24, 223–250. Reich Y and Shai O (2012) The interdisciplinary engineering knowledge gen-
Brown T (2008) Design thinking. Harvard Business Review 86, 84–92. ome. Research in Engineering Design 23, 251–264.
Cagan J and Vogel CM (2002) Creating Breakthrough Products: Rohan D and Hornblower J (2008) Identifying venture opportunities.
Innovation from Product Planning to Program Approval. Upper Saddle Teaching Case E-323, Graduate School of Business, Stanford University.
River, NJ: FT Press. Shai O and Reich Y (2004) Infused design. I. Theory. Research in Engineering
Cascini G and Russo D (2006) Computer-aided analysis of patents and Design 15, 93–107.
search for TRIZ contradictions. International Journal of Product Development Song B, Triulzi G, Alstott J, Yan B and Luo J (2016) Overlay patent network for
4(1–2), 52–67. analyzing design space evolution: the case of hybrid electrical vehicles. 14th
Chan J, Dow SP and Schunn C (2015) Do the best design ideas (really) International Design Conference, May 16–19, Cavtat, Dubrovnik, Croatia.
come from conceptually distant sources of inspiration? Design Studies Srinivasan V, Song B, Luo J, Subburaj K, Elara MR, Blessing L and Wood K
36, 31–58. (2017) Investigating effects of analogical distance on ideation performance.
Chan J, Fu K, Schunn C, Cagan J, Wood K and Kotovsky K (2011) On the International Design Engineering and Technology Conference, IDETC 2017,
benefits and pitfalls of analogies for innovative design: ideation perfor- Cleveland, Ohio, Untied States.
mance based on analogical distance, commonness, and modality of exam- Tauber EM (1975) Discovering new product opportunities with problem
ples. Journal of Mechanical Design 133, 081004. inventory analysis. The Journal of Marketing 39, 67–70.
Chen W, Hoyle C and Wassenaar HJ (2012) Decision-based Design: Integrating Taura T and Nagai Y (2012) Concept Generation for Design Creativity: A
Consumer Preferences into Engineering Design. Berlin, Germany: Springer Systematized Theory and Methodology. Belin, Germany: Springer Science
Science & Business Media. & Business Media.
Fu K, Cagan J, Kotovsky K and Wood K (2013a) Discovering structure in Tseng I, Moss J, Cagan J and Kotovsky K (2008) The role of timing and ana-
design databases through function and surface based mapping. Journal of logical similarity in the stimulation of idea generation in design. Design
Mechanical Design 135, 031006. Studies 29, 203–221.
Fu K, Chan J, Cagan J, Kotovsky K, Schunn C and Wood K (2013b) The Ulrich K and Eppinger S (2015) Product Design and Development, 6th Edn.
meaning of “near” and “far”: the impact of structuring design databases New York City, NY: McGraw-Hill.
and the effect of distance of analogy on design output. Journal of Ward TB (1998) Analogical distance and purpose in creative thought:
Mechanical Design 135, 021007. Mental leaps versus mental hops. In Holyoak KJ, Gentner D and
Fu K, Murphy J, Otto K, Yang M, Jensen D and Wood KL (2014) Function Kokinov BN (eds), Advances in Analogy Research: Integration of Theory
based design-by-analogy: a functional vector approach to analogical search. and Data from the Cognitive, Computational, and Neural Sciences. Sofia:
Journal of Mechanical Design 136, 101102–101000. New Bulgarian University.
Fu K, Murphy J, Yang M, Otto K, Jensen D and Wood K (2015) Design-by- Weisberg RW (2006) Creativity: Understanding Innovation in Problem Solving,
analogy: experimental evaluation of a functional analogy search methodol- Science, Invention, and the Arts. Hoboken, NJ: John Wiley and Sons.
ogy for concept generation improvement. Research in Engineering Design Wilson JO, Rosen D, Nelson BA and Yen J (2010) The effects of biological
26, 77–95. examples in idea generation. Design Studies 31, 169–186.
Gentner D and Markman AB (1997) Structure mapping in analogy and simi- Yan B and Luo J (2017a) Filtering patent maps for visualization of diversifi-
larity. American Psychologist 52, 45–56. cation paths of inventors and organizations. Journal of the Association for
Gick ML and Holyoak KJ (1980) Analogical problem solving. Cognitive Information Science and Technology 68, 1551–1563.
Psychology 12, 306–355. Yan B and Luo J (2017b) Measuring technological distance for patent mapping.
Hatchuel A and Weil B (2009) C–K design theory: an advanced formulation. Journal of the Association for Information Science and Technology 68, 423–437.
Research in Engineering Design 19, 181–192. Youn H, Strumsky D, Bettencourt LM and Lobo J (2015) Invention as a
He Y and Luo J (2017) Novelty “sweet spot” for invention value. Design combinatorial process: evidence from US patents. Journal of the Royal
Science 3, e21. Society Interface 12, 20150272.
Joo SH and Kim Y (2010) Measuring relatedness between technological fields.
Scientometrics 83, 435–454.
Kang N, Ren Y, Feinberg FM and Papalambros PY (2016) Public invest- Jianxi Luo is an Assistant Professor of Engineering Product Development at
ment and electric vehicle design: a model-based market analysis frame- the Singapore University of Technology and Design (SUTD), where he
work with application to a USA–China comparison study. Design leads the Data-Driven Innovation Lab. He is also the associate director of
Science 2, e6. SUTD Technology Entrepreneurship Programme. Dr. Luo completed his
Kay L, Newman N, Youtie J, Porter AL and Rafols I (2014) Patent overlay B.S. (2001) and M.S. (2004) degrees in Thermal Engineering and
mapping: visualizing technological distance. Journal of the Society of Automotive Engineering at Tsinghua University, his M.S. degree (2006)
Information Science an Technology 65, 2432–2443. in Technology & Policy, and Ph.D. degree (2010) in Engineering
Kobourov SG (2012) Force-directed drawing algorithms. In Tamassia R (eds), Systems at Massachusetts Institute of Technology. His research focuses
Handbook of Graph Drawing and Visualization. Boca Raton, FL: CRC Press, on mining, analyzing, visualizing and making sense of large scale design
pp. 383–408. and innovation data to develop theories, methods and tools to enhance
Downloaded from https://www.cambridge.org/core. 23 Jan 2021 at 07:12:19, subject to the Cambridge Core terms of use.You can also read