Reading Comprehension Tests for Children: Test Equating and Specific Age-Interval Reports - Frontiers
←
→
Page content transcription
If your browser does not render page correctly, please read the page content below
ORIGINAL RESEARCH
                                                                                                                                            published: 10 September 2021
                                                                                                                                          doi: 10.3389/fpsyg.2021.662192

                                                Reading Comprehension Tests for
                                                Children: Test Equating and Specific
                                                Age-Interval Reports
                                                Patrícia Silva Lúcio 1*, Fausto Coutinho Lourenço 2 , Hugo Cogo-Moreira 3 ,
                                                Deborah Bandalos 4 , Carolina Alves Ferreira de Carvalho 5 ,
                                                Adriana de Souza Batista Kida 5 and Clara Regina Brandão de Ávila 5
                                                1
                                                 Department of Psychology and Psychoanalysis, State University of Londrina, Londrina, Brazil, 2 Department of
                                                Psychobiology, Federal University of São Paulo, São Paulo, Brazil, 3 Faculty of Teacher Education and Languages, Østfold
                                                University College, Halden, Norway, 4 Assessment and Measurement PhD Program, James Madison University,
                                                Harrisonburg, VA, United States, 5 Department of Speech-Language Pathology and Audiology, Federal University of São
                                                Paulo, São Paulo, Brazil

                                                Equating is used to directly compare alternate forms of tests. We describe the equating
                                                of two alternative forms of a reading comprehension test for Brazilian children (2nd to
                                                5th grade), Form A (n = 427) and Form B (n = 321). We employed non-equivalent
                            Edited by:
            Dubravka Svetina Valdivia,          random groups design with internal anchor items. Local independence was attested via
       Indiana University Bloomington,          standardized residual Pearson’s bivariate correlation. First, from 176 items, we selected
                          United States
                                                42 in each form (33 unique and 9 in common) using 2PL model, a one-dimensional item
                        Reviewed by:
                     Luis Anunciação,
                                                response theory (IRT) model. Using the equateIRT package for R, the anchor items were
Pontifical Catholic University of Rio de        used to link both forms. Linking coefficients were estimated under two different methods
                         Janeiro, Brazil
                                                (Haebara and Stocking–Lord), resulting in scores equating by two methods: observed
                       Won-Chan Lee,
 The University of Iowa, United States          score equating (OSE) and true score equating (TSE). We provided reference-specific
                  *Correspondence:              age-intervals for the sample. The final version was informative for a wide range of theta
                   Patrícia Silva Lúcio         abilities. We concluded that the forms could be used interchangeably.
                       pslucio@uel.br
                                                Keywords: reading comprehension, equating, concurrent calibration, anchor items, item response theory
                   Specialty section:
         This article was submitted to
         Quantitative Psychology and            INTRODUCTION
                        Measurement,
               a section of the journal         Reading comprehension is a complex skill that depends on different cognitive and linguistic abilities
               Frontiers in Psychology          (such as word recognition and working memory) related to the integration of text content to the
         Received: 31 January 2021              strategies, expectancies, and previous knowledge of the reader (Cain et al., 2004; Van den Broek
         Accepted: 13 August 2021               et al., 2005). Such complexity may be at the core of typical problems that learners face to understand
      Published: 10 September 2021              the passages, which may be reinforced by disturbances, such as dyslexia or attention difficulties
                             Citation:          (Snowling and Stackhouse, 2016).
               Lúcio PS, Lourenço FC,               Good and poor comprehenders differ from each other in their capacities of extracting evidence
        Cogo-Moreira H, Bandalos D,
                                                from contextual cues—inferential skills (Yuill and Oakhill, 1996; Paul and Elder, 2012)—as well
   Carvalho CAF, Kida ASB and Ávila
 CRB (2021) Reading Comprehension
                                                as their capacities of creating a mental representation of the read text (Kintsch, 1998). Therefore,
 Tests for Children: Test Equating and          for the evaluation and diagnosis of reading comprehension difficulties, it is necessary to explore
        Specific Age-Interval Reports.          the local and/or global process by which the reader may fail in grasping the meaning of the text
           Front. Psychol. 12:662192.           (Van Dijk and Kintsch, 1983). In other words, and following, Cain and Oakhill (1999), it is crucial
    doi: 10.3389/fpsyg.2021.662192              to investigate the failures of the inferential process, which may involve both the propositional

Frontiers in Psychology | www.frontiersin.org                                          1                                     September 2021 | Volume 12 | Article 662192
Lúcio et al. Equating for Reading Comprehension Tests
level (called text-connecting inferences) and the integration of temporal stability using McNemann’s test between the first
the content of the text with the previous knowledge of the reader and the second occasions by item. Internal consistency varied
(i.e., gap-filling inferences)1 . from 0.63 to 0.69. Both Anele and PROCOMLE instruments
One challenge in constructing tests for evaluating are composed of multiple-choice questions (though the former
cognitive/linguistic abilities is conciliating, in a single measure, additionally presents a free retelling). Finally, the instrument by
the points of view of construct representation and of nomothetic Saraiva et al. (2020) cited by Oliveira et al. (2016) received a
span. In a classical article, Whitley (1983) defines construct new edition in 2020. Albeit some improvements were observed
representation as the process of identifying the mechanisms in terms of construct description and scoring, it still does not
underlying the task performance, which is obtained by task present item analysis or validity and reliability reports. From the
decomposition. In the case of reading comprehension, it above, the effort for creating interchangeable forms of such an
represents the inferential processes described above for instrument is worthwhile.
understanding the message of the text. Although the inferential The use of two equivalent forms of a test, especially
process is essential for understanding the passage, it necessarily when it comes to performance tests, is important for all
does not interfere with the individual differences in the purposes in which evaluation occurs in different sessions,
performance. It is a question of nomothetic span which, in for example, to compare change after treatment or to catch
the terms of Whitley, refers to the network of the relationship developmental changes. The great advantage of using equivalent
between the items of the test and a set of other measures. In other forms instead of repeating the same form reduces the effects of
words, while construct representation is concerned with task the practice. Although alternate forms of a test share content
variability, nomothetic span refers to subject variability. From the coverage and procedures, they do not necessarily share their
nomothetic point of view, it is important to keep interindividual statistical proprieties (Urbina, 2014). It means that, in this last
variation (what can be achieved using a heterogenous sample case, differences between occasions are more susceptible to
of subjects or using items that inform about different strata of a measurement error or to differences in validity.
latent trait). The success of equating depends intrinsically on the plan for
The present study describes the process of equating alternative data collection, which must be connected to the intended uses
forms of a reading comprehension test for Brazilian children. As of the linked tests. A wide variety of research methods may
explained later (Methods section), both forms were idealized to be used (Angoff, 1971; Kolen and Brennan, 2014). Comparing
allow for the interpretations arisen from construct representation the scores arisen from different assessments or putting them
and nomothetic span approaches. Creating alternative or parallel on a common scale has a long history in psychology and
forms of an instrument is referred as the best way we can education (Kolen, 2004). Terms like calibration, linking, scaling,
compare test scores across different sets of items that supposedly and equating are used in narrow or in broad senses, depending
measure the same construct (American Educational Research on the theoretical perspective adopted by the researcher. Linking
Association et al., 2014). In a review, Oliveira et al. (2016) showed refers to putting item scores on the same scale (Hambleton and
there are few standardized measures for evaluating reading Swaminathan, 1985) and, therefore, test information functions
comprehension among Brazilian children, and these lacked and test characteristic curves of both tests should be similar
construct validation and reliable norms. The great majority of (McDonald, 1999). Strictly speaking, equating applies to tests
the instruments were not commercialized (they were available that shares the same framework (domain and content) and
only in dissertations, chapter books, and papers) and none of the same specifications (such as formats, procedures, and rules
the revised instruments presented item analysis. Since the review for scoring), in such a way that they could be called as test
by Oliveira et al., this picture did not change a lot. Although forms (Kolen and Brennan, 2014). Equating forms depends on
two new instruments are now available, both lack information the demonstration that items of both tests present the same
about the properties of the item. The “Anele” by Corso et al. difficulty levels and content coverage, so that they can be used
(2020) presented a very small sample (100 students with 3– interchangeably (Kolen and Brennan, 2014; Bandalos, 2018).
5 years of schooling) equally distributed in private and public Kolen and Brennan (2014) defined equating as the statistical
schools (in Brazil, only 18% of students attend private schools). process used to adjust the differences in item difficulties in such a
The authors reported a ceiling effect among children from way that test scores that represent alternate forms can be directly
private schools and the older children from public schools. There compared to each other. For the purposes of this paper, we follow
is information about internal consistency (alpha = 0.78) and the definition of equating by Kolen and Brennan.
interrater agreement (Kappa = 0.810), but validity studies are Despite the widespread use of IRT modeling in the educational
limited to age and socioeconomic differences and correlations and psychological research, reporting the equating of parallel
with other instruments. The PROLEMLE (Cunha and Capellini, test forms via IRT with real data seems to be scarce in the
2019) presented a wider sample (378 students from 3rd to literature. We performed a nonsystematic review in PubMed
5th grades), but homogeneous in terms of the type of school and Science Direct (using the terms, “reading comprehension”
(public) and from a convenience sampling. The authors reported and “equating” or “concurrent calibration”) and we found only
32 studies. From these, only nine were related to equating
1 There is no consensus in the literature about the classification of the inferences.
reading comprehension tasks with real data (Ree et al., 2003; Betts
Text-connecting inferences are also called as local cohesion inferences and gap- et al., 2009; von Davier, 2013; Liao et al., 2014; Dimitrov, 2016;
filling are referred as global coherence inferences (Cain and Oakhill, 2014). Sandefur, 2018; Seo et al., 2018; Wagner et al., 2018; Rodrigues
Frontiers in Psychology | www.frontiersin.org 2 September 2021 | Volume 12 | Article 662192Lúcio et al. Equating for Reading Comprehension Tests
et al., 2020). In general, these studies present a wide diversity of population density, varying from 7,700 (West) to 16,400 (Center)
approaches for reporting equating. inhabitants per km2 . The West and the Center areas are very
A great part of the research in the educational area used classic close to each other (and are territorially small in relation to the
or observed scores approaches to equating (Ree et al., 2003; Betts other areas); therefore we gathered them together, resulting in
et al., 2009; von Davier, 2013; Wagner et al., 2018). Most part of the following: North (9,400); South (12,400); East (13,100); and
the studies that used IRT approach used Rasch models, which do Center/West (8,300). These four areas are highly heterogenous
not provide information about the discrimination of the items in terms of socioeconomic status: The Center/West region,
(Liao et al., 2014; Sandefur, 2018; Seo et al., 2018; Rodrigues et al., although the least populated (in relation to the other three), is
2020). The exception is the study of Dimitrov (2016) that used richer. The South presents high levels of social inequalities (i.e.,
3PLM. The great majority of the revised studies are concerned very rich and very poor people living together in territorially
with multiple-choice tests, with the exception being the studies similar areas) and the other areas are formed by lower-middle
by Betts et al. (2009) that equated a measure of fluency in reading class to poor areas.
and of Wagner et al. (2018) that used a mix of open-constructed The logistic of collecting data in a mega city with a big
and multiple-choice questions from Program for International extension of area (1,500 km2 ) was taken in consideration when
Student Assessment (PISA). It is also remarkable that the studies doing the sampling. For sampling, we decided drawing 20% of
generally focus on adult or youth population, with only two the 32 districts, totalizing 6.4 (what we converted into 7 districts).
studies (Betts et al., 2009; Rodrigues et al., 2020) focusing on To account for the heterogeneity of the city, we considered
younger children. the population density of the area and its territorial extension
In the present study, we report equating of two forms of for drawing. As the North and Center/West regions presented
a reading comprehension test for children using common (or the lowest population density, we drew one district from each.
anchor) items and random groups design. To overcome the Although the South presented a lower population density than
limitations, multiple-choice tests format for evaluating active the East, it is a very heterogeneous region and with greater
processing in reading comprehension (Ozuru et al., 2013), territory size. Therefore, we drew 3 districts from this region and
we used open-ended questions. We used different statistical 2 from the East. The councils were Santana (North), Pinheiros
approaches for equating. First, we tested for local independence (Center/West), Penha and Aricanduva (East), and Vila Mariana,
of the items (which are embedded in texts) through bivariate Campo Limpo, and Capela do Socorro (South).
standardized residual inspection (separately for each form); Later, we computed the number of related schools in the
second, we reported the process of selecting items to calibrate seven selected districts (local, state, and private schools). From
the effect of anchor length (Kolen and Brennan, 2014), where the total of 690 schools, we determined 3% for sampling (n =
items were selected from results taken from separate (one for 21 schools). Based on the census, the proportions of schools
each form) 2PL IRT analyzes. We used 2PL models because no according to the education system were defined as follows: 0.36,
guessing is expected for free-response questions and, differently local (n = 7); 0.47, state (n = 10); and 0.17 (n = 4), private
from Rasch models, as they provide information about the schools. Because the schools are not symmetrically distributed
index of discrimination of the items; third, we described IRT in the seven districts (i.e., private schools tend to be located in
parameter linking with two different methods (namely, Haebara middle to high class neighborhoods, local schools to be dispersed
and Stocking–Lord) using the R equateIRT package. We used in the peripheral areas, and state schools in the central areas of the
one of these methods to illustrate the conversion of one form city), the selection of schools did not consider the stratification
to another; fourth, the observed-score equating (OSE) and IRT by the district. As the statistical analysis would involve IRT
true-score equating (TSE) are reported using these two methods; models, we considered a total sample of about 800 participants
finally, we presented referenced norms based on age-specific appropriate for our purposes (Tsutakawa and Johnson, 1990).
intervals for both forms, using the OSE method. The last stratum considered was the school year, in which we
equally divided the sample among the four strata (i.e., 2nd to
METHODS 5th year), because the differences in the number of enrollments
between the school grades seemed negligible (Instituto Nacional
Ethical Statement de Estudos e Pesquisas Educacionais Anísio Teixeira, 2009).
This study adheres to the ethical standards for research involving
human being and received approval from the Ethical Committee Sample
(protocol number 38406/12). We evaluated only children whose This study considered the following exclusion criteria: absence of
parents provided informed, written consent. auditory or uncorrected visual disturbances; alleged neurological,
behavioral, or cognitive impairments; complaints of specific
Sampling learning difficulties; and history of school retention. The eligible
Stratified random sampling was performed based on the 2008 children were identified by their teachers, who forwarded a letter
school census for the city of Sao Paulo, Brazil (Instituto Nacional describing the study (its aims, procedures, and measurements)
de Estudos e Pesquisas Educacionais Anísio Teixeira, 2009). and inviting the parents to provide a written consent for the
At that time, São Paulo presented a population of more than participation of their children.
11,200,000, distributed in 32 district councils in five areas (North, The children whose parents provided the written consent
South, East, West, and Center). The areas presented distinct (n = 826) were screened for struggle in reading ability, because
Frontiers in Psychology | www.frontiersin.org 3 September 2021 | Volume 12 | Article 662192Lúcio et al. Equating for Reading Comprehension Tests
TABLE 1 | Sample characterization per form of the test. composed of seven texts intended to be alternative forms. An
additional passage and its items are common to both forms
Variable Form A Form B
(which serve as an anchor). The passages are followed by open-
n 431 322 ended questions (dichotomously scored) developed to evaluate
Mean age (S.D.) 9.1 (1.0) 9.1 (1.0) different cognitive processes demanded to answer them correctly,
Age (range) 7–11 6–12 covering, therefore, the construct representation of the task
Female (%) 57.0% 59.0% (Whitley, 1983). This was because poor comprehenders differ
Public school (%) 83.2% 85.0% from typical readers in their difficulty in answering questions
School year (%) that demand different types of inferences, as well as their ability
2nd 27.2% 23.8% to draw conclusions from evidence or contextual clues (Yuill
3rd 24.4% 24.4% and Oakhill, 1996; Paul and Elder, 2012). These questions are
4th 25.1% 25.9%
described as follows: (1) literal that evaluates the retention of
5th 23.3% 25.9%
explicit information present in the text; (2) text-connection (TC)
inferences that require the integration of implicit information
present in the text to achieve coherence between different
a minimum proficiency in decoding is required for performing periods or phases; (3) gap-filling (GAP) that requires the use
the comprehension tasks. The screening task was a short text of background knowledge to fill the gaps of implicit or missing
suitable for the school grade (ranging from 206 and 235 words), information in the text; and (4) situation model (SM), a kind of
which should be read aloud by the child2 . The time was registered idiosyncratic mental representation of the situation expressed in
at the beginning of the reading and, after 1 min, the examiner the text (Kintsch, 1998; Cain and Oakhill, 1999).
put a mark at the last word read. The rate of reading until Moreover, texts were created to follow progressive levels of
this mark was the intake criterion. The cutoffs were 50, 66, 77, difficulty, by adding the number of words and by reducing the
and 95, respectively for accurately read words for the 2nd to readability across texts. As narrative texts are easier for readers
5th year, respectively. The children who failed the task were (Kraal et al., 2018), only two expository texts were created for
withdrawn from the study. Therefore, 755 children were eligible each form (the highest difficulty3 text, Text 7, with more words
for the study (57.6% girls) from local (37.1%), state (46.6%), and and lower readability, and Text 4, the middle difficulty text).
private schools (15.9%). The mean age of the children was 9.10 Additionally, most texts presented middle levels of readability
± 1.02 years (age range = 6–12 years). Table 1 summarizes the (avoiding very easy or very hard texts). This was performed
characteristics of the children per group. to catch interindividual differences between the school grades,
Because of missing data, the comprehension tests were following the nomothetic principle (Whitley, 1983). Although
available for 748 children: 427 for Form A and 321 for Form B. Texts 4–7 were created to present the highest levels of difficulty
Children were randomly assigned to Form A or Form B through of the instrument, the content of the passages deals with subjects
coin flipping by the examiner before the beginning of the session. that may be of general interest to the child and to the youth
The frequency of children who completed Form A or B did not population (see Table 2, Note).
differ in age [t (746) = 0.553, p = 0.580] or sex [χ 2(1) = 0.318, The total test comprised 185 items, which were distributed
p = 0.573]. as follows: 81 from Form A, 95 from Form B, and 9 from
anchor items. Text types were narrative or expository and all were
Equating Design followed by 9–16 questions (see Table 2, Original Questions and
The method we used for equating was the common-item Classification). The type of questions was not equally distributed
nonequivalent random group design, in which the participants in the texts because their elaboration depends on the context of
were submitted to distinct forms of the instrument with some the passage. Yet for this reason, the texts presented unequal initial
items applied to the total sample (the last design showed in pool of items (we created as much as questions were possible
Figure 1.1 of Kolen and Brennan, 2014). Hence, the children for testing this pool and selected the best and paired items).
from the selected schools were randomly assigned to Form A Nevertheless, the equivalence of the respective texts between the
or B. Additionally, all participants were exposed to a text and a forms was considered in the item selection, as described later (i.e.,
set of related items to equate difficulty (anchor text items). The the same number and type of questions in Texts 1A and 1B, 2A
anchor items were used to compose both the raw scores and and 2B, and so forth). Table 3 presents two paired texts and their
the final estimated theta scores of the examinees; therefore, these related questions (translated to English).
items were classified as internal to the scores (Kolen and Brennan, A pilot study (Lúcio et al., 2015) demonstrated age differences
2014). related to the type of questions, and the construct validity was
attested (for each form separately) using 2PL one-dimensional
Instruments models of item response theory (IRT). The test underwent
The reading comprehension test that is currently in construction psychometric inquiry using one-dimensional model and the
is comprised of two forms (Form A and Form B), each one
2 Cogo-Moreira, H., Lima, G., Carvalho, C. A. F., Kida, A. B. S., Lúcio, P. S., and 3 Here, difficulty should not be interpreted as a statistical measure (such as
Ávila, C. R. B. (2021). Pontos de corte, sensibilidade e especificidade para triagem proportion of correct responses in classical terms or parameter b from IRT), but
da fluência leitora em crianças. [Cut-off Scores, Sensitivity, and Specificity for the supposedly increase in difficulty level based on the number of words and the
Screening the Reader Fluency in Children]. readability of the text.
Frontiers in Psychology | www.frontiersin.org 4 September 2021 | Volume 12 | Article 662192Lúcio et al. Equating for Reading Comprehension Tests
TABLE 2 | Characterization of the texts and its questions (anchor, Form A, and Form B) before and after item selection.
Texta FK Words Original questions Selected questions
(Classification) (Classification)
LIT TC GAP SM Total LIT TC GAP SM Total
Anchor 52 192 1 6 1 1 9 1 6 1 1 9
1A 71 67 2 5 1 1 9 1 1 1 1 4
1B 85 79 2 9 2 1 14 1 1 1 1 4
2A 76 111 1 6 2 2 11 1 2 1 0 4
2B 61 101 3 4 6 1 14 1 2 1 0 4
3A 64 97 1 5 2 1 10 1 2 1 1 5
3B 58 116 3 5 4 2 13 1 2 1 1 5
4A 63 211 3 5 5 2 15 0 3 2 1 6
4B 62 165 1 10 3 2 16 0 3 2 1 6
5A 56 158 2 4 4 2 12 0 3 1 0 4
5B 57 223 1 9 3 0 13 0 3 1 0 4
6A 54 310 0 6 6 2 14 0 4 0 0 4
6B 51 210 2 12 0 0 14 0 4 0 0 4
7A 34 386 1 5 2 2 10 1 3 2 0 6
7B 40 322 1 8 2 0 11 1 3 2 0 6
Mean/Totalb 58/63 158/ 165 24 99 43 19 185 9c 42c 17c 7c 75c
Texts 4 and 7 of both forms are expository and all the other texts are narrative.
A, Form A; B, Form B; LIT, literal; TC, Text connecting; GAP, gap-filling; MS, situational model.
FK, Flesch-Kincaid Index. It evaluates readability based on the correlation between the average word sizes of the sentences. It gives a score between 1 (lowest readability score) and
100 (highest readability score). The adaptation of the FR to Portuguese was carried out by Martins et al. (1996). Formula: FR = 248,835 – [1,015 × (Number of words per sentence)]
– [84.6 × (Number of syllables in the text/Number of words in the text)]. The classification of this index for Brazilian Portuguese is very easy (100–75); easy (50–75); Hard (25-50); and
very hard (0–25).
a Content subjects of the passages: Anchor = A bear runs away from his cage in the zoo; 1A = A girl plays in a garden; 1B = A boy gets a book as gift; 2A = A dog plays around; 2B =
A girl is afraid of taking a vaccine; 3A = A ball falls in the neighbor yard; 3B = A boy cheats in the game with his friends; 4A = The anteater; 4B = The rufous hornero; 5A = A girl looks
forward to the visit of Santa Claus; 5B = A boy is in a dark grove; 6A = The fisherman and his son go to work; 6B = A couple drawing water from the cistern; 7A = The origin of the
pyramids; 7B = The origin of limestone rocks.
b The last line in this table presents mean values for FK and number of words and total for item’s classification. Anchor item’s values were not used for mean. The value before the
bar/refers to mean for Form A and the after for Form B.
c The total considered the specific questions of both forms plus the common items (e.g., for LIT questions: 4 items in Form A; 4 items in Form B; 1 anchor item = 9 LIT questions).
items presented good inter-rater reliability (Lúcio et al., 2016), to understand the meaning because some questions about the text
with mean Fleiss Kappa of 0.68 (Form A) and 0.80 (Form would be asked right after the reading. The test was not timed,
B), respectively. and the examiner orally provided the questions. The questions
were orally given to avoid the effect of the developmental
Procedures differences in spelling performance. The texts remained with
Data collection was carried out from August to November the examinees while the questions were presented. The answers
2012 that took place in the second semester of the academic were recorded for posterior scoring. All the questions were
years in Brazil. Children were individually tested by trained scored with 0 (wrong) or 1 (right) points. Responses that were
speech-language therapists in a quiet room at their own schools. incorrect according to an answer key and no-responses were
Altogether with the reading comprehension test, they performed considered incorrect.
a set of tests that composed a battery, including decoding,
oral comprehension, working memory, and rapid automatized Statistical Analysis
naming. The sessions were in a total of 4, each one intercalated For item selection and equating, one-dimensional models were
with two texts of reading comprehension, one cognitive task, considered for reading comprehension (i.e., all the items of each
and a play activity not related to the research. In general, the form running under a general factor). We used different steps
sessions lasted for 45 min each. For this study, we described the to equate the two forms. Firstly, the local independence of the
procedures related to the comprehension test. forms was checked for each form separately via bivariate Pearson
The examiner asked the children to read the short passages standardized residuals (z-score; Haberman, 1973; Agresti, 2019).
the way they were used to comprehend (e.g., reading aloud or The idea underlying this evaluation was that items within the
silently)4 . The children were instructed to pay attention and try same text might show violations in the local independence when
4 Asthe focus of the instrument was to evaluate reading comprehension, we did otherwise who prefer making use of the articulatory help of reading aloud, could
not specify the way the children should read. In doing this, children who prefer be in disadvantage and therefore their score could not represent the actual level of
reading silently for understanding the passage (e.g., because she/he is shy) or comprehension.
Frontiers in Psychology | www.frontiersin.org 5 September 2021 | Volume 12 | Article 662192Lúcio et al. Equating for Reading Comprehension Tests
TABLE 3 | Example of texts and related questions in each form (translation).
Text 2—Form A Text 2—Form B
John opened the door. Buddy left the car, very excited. He was wagging his That was a different Saturday. Many children were waiting in line to be attended to. As
tail and running, looking at everything around him. There was so much soon as she arrived, Emma began to hear a chorus of cries. She was worried. From
news! the room he was supposed to enter, some children came out sobbing, though others
Along the way, he smelled a lot of daisies and calla lilies, besides the grass. seemed quiet
He went into the flowers, sniffing at the soil, until he smudged his muzzle in Emma heard her name called and entered. There was a jar of strawberry lollipops on
a puddle. Buddy stopped, and suddenly the mud moved. He saw a strange the table. The nurse handed one to each child. Emma lifted the sleeve of her shirt and
animal and ran away barking back to its owner. When him saw what it was, gripped her mother’s hand tightly. Her eyes closed and two tears streamed down her
he caressed him and said: cheeks. But after feeling only a mince, she began to feel better
- It’s just a frog ...
But Buddy continued barking, staring at the animal. John took its collar and
leash. They went for a walk somewhere else
1. For what reason John opened the door? (TC) 1. Where the children were waiting? (LIT)
2. What flowers Buddy smelled along the way? (TC) 2. How did the children know that was their turn to enter in? (TC)
3. What kind of puddle Buddy found? (TC) 3. What there was on the table? (LIT)
4. Why did Buddy bark? (GAP) 4. What did the nurse give to the children? (TC)
5. Why did the mud move? (TC) 5. Why did the nurse give lollipops to the children? (GAP)
6. Where was the strange animal that Buddy found? (TC) 6. Which was the flavor of the lollipop? (LIT)
7. What was the strange animal that Buddy saw? (TC) 7. Why Emma was worried? (TC)
8. Why did the Pingo’s owner rub him? (TC) 8. Why did Emma lift her shirtsleeve? (GAP)
9. What did John put on Buddy for a walk? (LIT) 9. Why did Emma grip her mother’s hand? (GAP)
10. It was raining or sunny on the day before? Why? (GAP) 10. Why did Emma feel a sting? (GAP)
11. Why did Buddy would do if he found a crab on the beach? Why? (SM) 11. Why did some children look calm when leaving the room? (GAP)
12. When did Emma begin to feel better? (TC)
13. What did Emms won when she left? (TC)
14. What do you think Emma could say to the children that remained in line? (SM)
LIT, literal; TC, Text connecting; GAP, gap-filling; SM, situation model. Selected questions are in bold.
compared to the other text items. For the bivariate tables, the anchor items, a maximum of 36 items should be selected for each
standardized Pearson residuals were computed using Equation 1, form. We selected 4–6 items in each text, following the criteria
where O and E are the observed and expected (model estimated) described hereafter (Table 2).
quantities for a pattern in the categorical data (i.e., correct The item selection was based on two criteria: first, the
and incorrect answers) and n is the sample size. Traditionally, classification by same number and questions between
standardized residual z-scores exceeding |1.96| would indicate corresponding texts (Text 1, Text 2, and so on). Second,
violations of local independence. However, in our context, where we gave preference to items with a higher discrimination
the number of items per form is 81 and 95, to decrease the false index (a parameter) and heterogeneous in terms of difficulty
discovery rate (i.e., Type I error), we increased the cutoff based (b parameter) within each text. Discrimination and difficulty
on the Bonferroni correction. Then, the significance level of 0.05 parameters were estimated based on the 81 items from Form
would be divided by 81 for Form A and 95 for Form B resulting A and 95 from Form B, separately. In this step, we used
in a new adjusted level of significance of 0.0006 for Form A Mplus version 8.0 (Muthén and Muthén, 1998–2017) and all
(corresponding to a z-score of around |3.42|) and 0.0005 for Form standard errors for the estimates were adjusted for the multilevel
B (corresponding to a z-score of around |3.47|). design. To that aim, we used the COMPLEX option in Mplus,
as implemented and discussed by Asparouhov (2005, 2006),
specifying schools as a cluster variable and the robust full-
O−E information maximum likelihood estimation. It is important
√ q (1)
E∗ 1−E to note that the default estimator for dichotomous items in
n
Mplus is WLSMV, but we changed the estimator to be congruent
with the following equating process where MLR will be used.
Second, we reduced the number of items in each form to comply
Technically speaking, WSLMV analyses tetrachoric correlations
with the rule-of-thumb suggested by Kolen and Brennan (2014),
that belong to (weighted) least-squares estimation of limited
where the common-item set should contain at least 20% of as
information from the first- and second-order moments, whereas
many items as the full test5 . Considering we have 9 available
5 Atthe time of data collection (2012), we were not aware of the 20% rule of be performed simultaneously. As consequence, first, we removed the items and
thumb for the anchor items, what would allow that equating and item selection later we performed the equating.
Frontiers in Psychology | www.frontiersin.org 6 September 2021 | Volume 12 | Article 662192Lúcio et al. Equating for Reading Comprehension Tests
MLR analyses the raw data (full information from all moments)6 . As both forms will be in the same metric, percentiles will be
Reliability was reported for each item (R-squared) and alpha- presented only for Form B, using the OSE method.
cfas7 were reported for both reduced forms. Item fits were
calculated using the procedure described by Yen (1981). This
test verifies how much the abilities of the subjects are cited in
RESULTS
the characteristic curve suggested by the model, and therefore, Figure 1 shows the distribution of the standardized residual
rejecting a null hypothesis indicates maladjustment8 . (z-scores) separately for Forms A and B, with 12.960 and 17.860
Since the parameters from Form A and Form B need to bivariate residuals, respectively. This inspection was important
be on the same scale, IRT parameter linking was conducted as to identify likely violations of local independence. It may be
the third step. The relationship between item parameters on noticed that, in both scenarios, most of the bivariate standardized
the two test forms was transformed via linking constants (also residuals are around zero: Residuals for Form A ranged from
known as equating coefficients or scaling constants). The linking −4.60 to 4.98 (mean = −0.005. SD = 0.591) and residuals
constants were obtained from the discrimination and difficulty for Form B ranged from −4.40 to 4.86 (mean = 0.003; S.D.
parameters of the anchor items. This step was implemented with = 0.578). For Figure 1, the major density of standardized
the R package equateIRT (Battauz, 2013, 2015; Wiberg, 2018), residuals is between −3 and +3 and, therefore, no meaningful
where different linking methods were used, both relying on deviations were observed, meaning that we have evidence for
item characteristic curves to generate the equating coefficients, local independence.
namely, the Haebara and Stocking–Lord methods (Haebara, Supplementary Table 1 presents the classification of items
1980; Stocking and Lord, 1983). The final step in equating and summarizes the statistics per item of Form A and Form
transforms the linked scores into a new metric (Bandalos, 2018); B, separately estimated through robust maximum likelihood
therefore, the results of the two equating methods are reported estimation (only noncommon items). It also presents the
using both IRT observed-score equating (OSE) and IRT true- discrimination (a) and difficulty (b) IRT parameters as well
score equating (TSE) methods. According to Wiberg (2018), as reliability estimates (R-squared) followed by their respective
the OSE method uses the marginal score distributions, i.e., standard errors. The proportion of correct responses for items is
equipercentile equating is applied to the assumed distributions of presented in the last column. Considering the total of the items,
the abilities of the examinees which are integrated (summed up) the mean reliability was set to 0.230 for Form A [0.000–0.071]
from both forms of the test. On the other hand, the TSE method and 0.185 for Form B [0.003–0.442], respectively.
uses conditional score distributions, and its linking process is As explained in the Methods section, classification of
associated with the true score obtained in a version of the test questions and IRT discrimination/difficulty indices were used
to the true score of the other version. Both the methods produce to select the items on each Form and for the classification of
similar results, mainly when the differences between the equated items [i.e., selecting the items with the highest discrimination
forms are not large (Han et al., 1997). with a wide range of difficulty, when possible (−3 to +3), and
Lastly, for speech-language pathologists and psychologists, we paired in terms of classification of items]9 . From these criteria,
generated percentiles for the raw scores for each form based on we selected 33 items specific for each form, which summed up
the best fit age-specific reference interval method, as described by with the 9 anchor items with a total of 42 items by form. The
Altman (1993), Royston and Sauerbrei (2008), and Royston and selected items are in bold in Supplementary Table 1 and the last
Wright (1998). Age-reference intervals are commonly adopted as column of Table 2 presents the number of selected items for each
decision-making tools to determine if an individual is within the text. Item fits are presented in Supplementary Table 2 [χ 2 , df,
normal population interval limits for some measurement (Horn root mean square error of approximation (RMSEA) associated
and Pesce, 2005). Classically, age-reference intervals are used with χ 2 and p-values] The inspection of Supplementary Table 2
in the pediatrics for tracking the child growth across different shows misfit in five items in Form A (Anchor 4, A42, A52, A55,
anthropometric measures (i.e., weight-for-age and weight-for- and A63) and two items in Form B (B9, B93). Item fit was
length/height). It is important to notice that reference-specific not possible to compute two items (A73 and B95) because the
age- interval is not correlated with the percentile equating ability level of the sample does not cover the difficulty of those
procedure. We used the NCSS version 12 for the reference- items. We decided to keep these items because removing the
specific age-interval method (NCSS 12 Statistical Software, 2018). misfitting items is relevant when a large proportion of misfits are
6 Using
large or in the case of multidimensionality (Crişan et al., 2017).
MIRT package would be an alternative for reporting the traditional fit
index. Nevertheless, it has some limitations as for example regarding fit indices are
Supplementary Figure 1 presents the empirical plots for these
only available under complete cases (Chalmers, 2012) and in our cases, missingness
was planned by design. 9 For item selection, it was mandatory to preserve the match between the items
7 According to Kelley (2020), alpha-cfa should be used when performing a CFA for both forms. Because of this criterion, it was not always possible to keep
with true score (tau) equivalence and an estimator which is not WLSMV, so the the best items in terms of discrimination or reliability. For example, item A6
formula is not equivalent to Cronbach’s coefficient. This coefficient is also called presented better index than item A7 (discrimination was 0.612 vs. 0.603; and
Guttman-Cronbach alpha and is based on the (1999) work by McDonald. reliability was 0.102 vs. 0.099). Nevertheless, item A7 was selected because it
8 This statistic fails to find degrees of freedom in very difficult items, so it cannot matched with another item, B7. They are of the same classification (GAP), similar
test the entire length of the curve. Although there are methods with greater power in terms of difficulty (A7 = −1.3; B7 = −1.5) and discrimination (B7 = 0.85)
like Orlando and Thiessen’s S-χ 2 , we useχ 2 because it can handle with missing and present similar proportion of correct responses (A7 = 68%; B7 = 76%)
data (Orlando and Thissen, 2000). (Supplementary Table 1).
Frontiers in Psychology | www.frontiersin.org 7 September 2021 | Volume 12 | Article 662192Lúcio et al. Equating for Reading Comprehension Tests
FIGURE 1 | Distribution of the standardized residual (z-scores) for Form A (upper graphic) and Form B (lower graphic).
items. Mean of reliability of the selected items was 0.252 for Form coefficients of A > 0.90 and the mean-sigma method produced
A [0.099– 0.680] and 0.247 for Form B [0.136– 0.606] and it did the highest standard error. The linking was performed putting
not differ statistically [t (64) = 0.039, p = 0.096, d = 0.001]. Form A-R on the scale of Form B-R in all methods. For example,
As a next step, we present IRT parameters for the noncommon to transform the a-parameter for Anchor 1 item from Form A-R
items together with the anchor items, separated by forms (a = 1.285143) to the scale of Form B-R using the Stocking–
(Supplementary Table 3). This step was carried out using Lord method, we should divide it by 0.91536 (i.e., its equating
equateIRT for R. The obtained indices did not differ neither for coefficient A), obtaining the value, 1.403976. The b-parameter
discrimination [t (82) = 0.813, p = 0.419, d = 0.178] nor for for Anchor 1 (b = 0.835929) from Form A-R is transformed
difficulty [t (82) = 0.870, p = 0.387, d = 0.265]. Hereafter, we by taking −0.21297 (i.e., equating coefficient B) + 0.91536
allude to the forms as Form A-R and Form B-R (meaning, they ∗ (0.835929) = 0.5522. This procedure, in practice, should be
were reduced forms of the original set of items). Alpha-CFAs applied to the whole set of items (anchors and non-anchor items).
were similar in both reduced forms [Form A-R: 0.71 (0.67; 0.75); Supplementary Tables 4 and 5 depict, respectively, the OSE
Form B-R: 0.68 (0.64; 0.72)]. and the TSE-linked scores for Form A-R an Form B-R, based on
From this analysis, the four methods generated different total scores (OSE) and on theta (TSE). The mean values obtained
scaling coefficients (Table 4). All methods produced equating for Form A-R through OSE were very similar to those obtained
Frontiers in Psychology | www.frontiersin.org 8 September 2021 | Volume 12 | Article 662192Lúcio et al. Equating for Reading Comprehension Tests
TABLE 4 | Linking coefficients obtained by different methods (Form A–R on Form
B–R).
Method Equating coefficients
A SE (A) B SE (B)
Haebara 0.93043 0.078377 −0.22625 0.090175
Stocking-Lord 0.91536 0.078744 −0.21297 0.089296
SE, standard error.
through TSE. Using Stocking-Lord method as example, there was
an almost perfect correlation between the OSE and the TSE-
transformed scores and these measure with the raw score of Form
A-R (for all comparison. r = 1.0. p < 0.001).
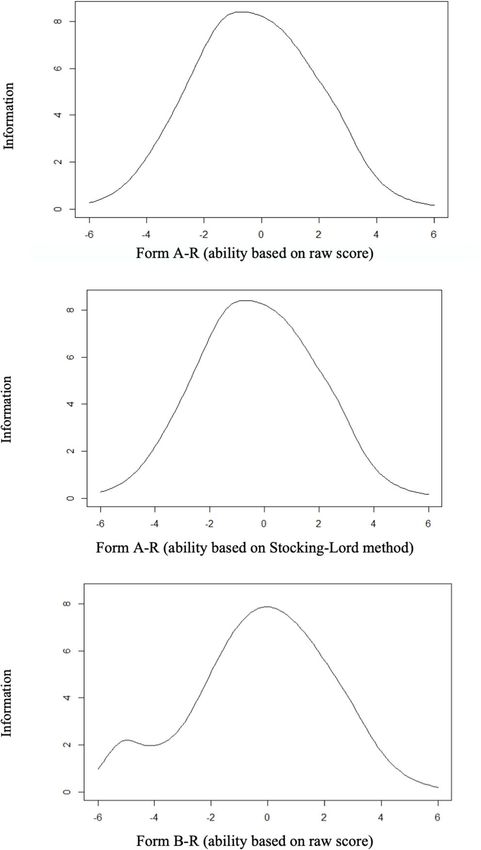
Figure 2 presents the test information for Form A-R (upper
graphics) and Form B-R (lowest graphic). For both forms, the
test was informative for a wide range of ability levels, going from
−4.00 to 4.00. The peak of information was at theta around −1.0
for Form A-R (Stocking-Lord graphic) and at 0.0 for Form B-R.
Greater differences between the information curves seem to be at
the lowest bound of the curve.
Reference-specific age-intervals are presented in Table 5 and
the percentiles per age were generated using the OSE method.
These intervals were obtained based on the highest R2 correlating
age and B-R scores across 44 different models as linear,
polynomial (i.e., quadratic and cubic polynomials), a fractional
polynomial, and adding an inverse squared term. The R2 for each
fitted model is generated and ranked in terms of its magnitude.
The results presented in Table 5 came from the best-fit model.
The best model has a quadratic function of growing as the best-fit
model with R2 = 0.206. The estimated model for Form B-R scores
might be represented by the Equation 1; in case of using decimals,
age is not shown in Table 5 (as for e.g., 7.8 years old).
1 log age
B − R scores = 47.25 + 4351.03∗ + ∗ (3263.93)(2)
age2 age2
FIGURE 2 | Test information for Form A-R (upper graphics) and Form B-R
(lowest graphic).
Before using the percentile norms for Form A-R, practitioners
should convert the raw score according to one of the four
given methods (Supplementary Table 3 or 4). For example,
let us consider two children of the same age (8-year-old) scores and the obtained values from Supplementary Tables 2
who did obtain the score of 16 (child A in Form A-R and and 3 were quite similar.
Child B in Form B-R). Using Table 5, child B would be
achieving the 75th percentile. To compare the performance DISCUSSION
of both children, we could use Stocking-Lord OSE conversion
(Supplementary Table 3) to discover that score of 16 in Form B- This study presented the steps for equating two parallel forms
R refers to a score of 15.5963 in Form A-R. Therefore, in verbatim of reading comprehension tests to evaluate the abilities of
terms, child B presented lower achievement than child A. The Brazilian Portuguese-speaking children attending the early years
score of 15.6 is not enough for the examinee to achieve the 75th of elementary school. The tests (a set of narrative and expository
percentile according to Table 5. Considering the approximation texts, followed by questions) were constructed to cover a
(i.e., values above the 0.50 decimal going up to the next decimal wide range of reading comprehension skills, represented by
place), both children would achieve similar levels of abilities. an increasing order of difficulty (i.e., number of words, text
Therefore, for practical reasons, such caution would not be complexity, type of texts, and type of questions). Regarding the
necessary, because the test does not present decimals in raw type of questions, the items differed in the strategies necessary to
Frontiers in Psychology | www.frontiersin.org 9 September 2021 | Volume 12 | Article 662192Lúcio et al. Equating for Reading Comprehension Tests
TABLE 5 | Reference-specific age-intervals based on total scores on the instrument.
Age Percentiles
2.5 10 25 50 75 90
7 0 4 7 10 13 16
8 2 5 8 12 16 18
9 4 8 11 15 18 22
10 7 10 14 18 21 24
11 10 13 17 20 23 26
be evoked for achieving comprehension, i.e., inferences, mental younger children could, for example, responded to the easier
representation of the whole situation, or memorization from texts and the older to the medium and hard ones. As mentioned
information given in the text (Yuill and Oakhill, 1996; Kintsch, in the Introduction, at the time of data collection, in Brazil,
1998; Cain et al., 2004; Paul and Elder, 2012). Following this there were scarce literature concerning the test-construction of
approach, construct validity was previously demonstrated for the reading comprehension. We intended providing as many items
tasks, and the present work aimed to attest empirically its status and texts as possible in the sample, making the results available
as parallel forms. For our purposes, we followed the definitions for the audience.
of Kolen (1981) for parallel tests and Bandalos (2018) and Kolen As the items were embedded in texts, a possible violation
and Brennan (2014) for equating. of local independence (Embretson and Reise, 2000) could have
We followed the recommendations of Whitley (1983) for interfered with score interpretation. For example, using Rasch
constructing a test that simultaneously considered the construct dichotomous modeling, Moghadam and Pishghadam (2008)
representation and the nomothetic span approaches. In the showed that local independence violations affected the scores of
first case, the texts and questions were developed to access low- and high-ability students in Cloze tests. Hence, we tested
different kinds of inferences that may be used for understanding this hypothesis through bivariate Pearson standardized residuals
a passage. In the second case, we encouraged the emergence of (Haberman, 1973; Agresti, 2019) and employed the Bonferroni’s
the interindividual differences between the children to increase correction for multiple comparisons (i.e., dividing the critical
the difficulty of the texts and questions that allowed for catching value of 0.05 for the number of items in each form). We found
age differentiation in reading comprehension. Embretson and no evidence for the violation of local independence. Note that,
Gorin (2001) exposed an important role the cognitive psychology even for the traditional cutoff (i.e., |1.96|) used for tests with
would take in the future (where we are, considering the date of fewer items (≤ 30), the forms do not seem to present such a
the paper) for test construction and test validation. In this study, violation. As seen in Figure 1, few items surpass |2.0| and even
the theory of the inferential processing guided the construction fewer surpass |3.0|.
of the questions and the item selection. We should demonstrate Having no evidence of local independence violations, we
in the future, the role of these inferential processes for construct followed the next steps of the analysis proposed on the method.
validation of the task (i.e., comparing potential competing To avoid the anchor length effect, we reduced the original 176
models for this set of items) as well as its external validation items (81 from Form A and 95 from Form B) to fit 20% of anchor
(i.e., demonstrating that the nomothetic span principle was, in item ratio. Therefore, we reduced both forms to 33 specific items
fact, achieved). plus 9 common anchor items (called, Form A-R and Form B-
From the recommendations of Kolen and Brennan (2014), the R, respectively; R from reduced). Several studies showed that
equating process starts with the choice of an appropriate research 20% of the rule of thumb is applicable to real and simulated
design. Therefore, a stratified random sampling was performed, data (Uysal and Kilmen, 2016). For selecting the items, our
and the common-item non-equivalent groups were used as a approach simultaneously considered theoretical and empirical
design. For reducing bias, each half of the sample was randomly issues. In the first case, we preserved the same number and type
assigned to one form of the task and some common items (anchor of questions per text, to guarantee the conceptual parallelism
items) were applied to the whole sample. Some digression here is between the forms. Second, we chose the more discriminative
valuable for explaining our methodological approach. Although items and sought to achieve heterogeneity in terms of difficulty,
the subjects were randomly allocated in our study, the design was which could improve the range of abilities covered by the
considered non-equivalent because no baseline measure was used instrument (Embretson and Reise, 2000; Urbina, 2014). With
for testing the a priori performance of the participants. Using this approach, we intended to cover from lower to higher levels
the stratified random sampling, we intended to reduce the bias of reading comprehension skills. In fact, as shown in Figure 2,
and the discrepancy among the groups of subjects. Moreover, we both forms function equally well for a wide range of theta levels;
adopted a conservative approach because we used a horizontal Therefore, we posit that our aim was achieved. Notably, the
instead of vertical equating (Kolen and Brennan, 2014, chapter score necessary for obtaining the 90th percentiles by the older
9). That is, all the age groups responded to the complete test. children of the sample (27 from 45 items; Table 5) indicates
As pointed out by a reviewer, using the vertical equating, the that the more difficult items may function for evaluating reading
Frontiers in Psychology | www.frontiersin.org 10 September 2021 | Volume 12 | Article 662192Lúcio et al. Equating for Reading Comprehension Tests
comprehension abilities of even older children10 . Although, the of the cognitive processes involved in reading comprehension,
range of theta obtained for both tasks are satisfactory for our qualitative guidelines should be given to practitioners. A
purpose, future research may indicate the applicability of the test challenge to this lies in the limited number of questions
for older children. by the evoked cognitive process, given the pool of items
Consistent with the one-dimensional view of the instrument is reduced after item selection. One possibility lies in using
(Kolen, 1981), separate CFA (Mplus syntax) was used to generate some of the questions that were removed but presented an
the IRT parameters of difficulty and discrimination for the appropriate discrimination index and reliability (e.g., A39 and
process of selecting items. After the selection process, we B45; Supplementary Table 1). Moreover, we infer from Table 5
used the equateIRT R package to generate IRT parameters that a ceiling effect may be present in the task. It signalizes
of the reduced forms (Supplementary Table 3). Strikingly, the need for extending the sample for older children (mainly
even before equating the linkage, the IRT difficulty and for Texts 6 and 7). Another possibility is for validating other
discrimination indices did not differ between the versions. arrangements of the items (e.g., Texts 1–5) for the youngest
Reliability did not differ significantly between the forms or for the less skilled. Although feasible, this work is yet to
(Kolen, 1981), where almost 71% of the variance in Form be done. Finally, some steps for equating parallel forms as
A was attributed to true score and 68% was attributed purposed by von Davier (2013) were not investigated here,
to Form B These results are indicative of the parallelism such as reliability investigation, symmetry, and invariance for
between forms (Kolen and Brennan, 2014). Subsequent steps subpopulations. Therefore, future studies should demonstrate
involved the estimation of the equating coefficients using two these additional steps.
methods (Table 4) and reporting test-equating results based As strengths, we emphasize the sophisticated detailed process
on OSE and TSE methods (Supplementary Tables 4 and 5, description used, which might be used for future research
respectively). We equated Form A-R onto Form B-R scale. In intending to create distinct test forms. We should recognize
agreement with the other studies (Ogasawara, 2001; Kilmen the careful sampling by stratification, the randomization of
and Demirtasli, 2012; Uysal and Kilmen, 2016), Stocking– Forms A and B to the examinees, the theoretical support for
Lord method presented the lower standard error. Therefore, the construction of texts and questions, and the choice of the
we demonstrated the score derivation of Form A-R using equating method, which allowed us to offer to the practitioners
the latter. two interchangeable tools even if a reduced sample size is
used. Finally, we reinforce that, once IRT transformations are
LIMITATIONS, STRENGTHS, AND FUTURE applied to the item level (Bandalos, 2018), it is possible to create
different forms of the instrument, which may be used for different
DIRECTIONS purposes. This is particularly important for both practitioners
As limitations, we first emphasize that although this study and researchers in a low-to-middle developing country that does
provided some evidence for the interchangeability of the forms, not present yet an instrument with the features described in
it is necessary to explore the validity for this instrument, such as this study.
cross-validation of the results for other samples (e.g., criterion In conclusion, the present study fulfilled the steps for
validity for distinguishing good and poor comprehenders, test– demonstrating the equating process of two alternate forms of
retest reliability, or other measures of consistency, such as a reading comprehension test for Brazilian children. Based
temporal invariance, and so forth) (American Educational on the results, we are quite confident that both forms can
Research Association et al., 2014). Since our conservative be used interchangeably, such that the reference-specific age-
approach of not assuming a priori that the groups were intervals may be useful for research or clinical/educational
equivalent, the representativeness of the common items became purposes. Nevertheless, we recognize that additional steps should
relevant, and we had to remove some items to perform the be performed as recommended by von Davier (2013). Future
equating. It does not preclude additional analysis to be performed research should cross-validate the results for other samples, such
as a part of cross validation studies, using an equivalent as older children or samples with specific learning difficulties,
random groups approach without the common items, skipping providing further evidence for its diagnostic specificity.
the step of the linking (as gently pointed by a reviewer).
This approach seems promising, once the difficult IRT and
discrimination index did not differ significantly among the DATA AVAILABILITY STATEMENT
samples even before equating. Sample size limits the analysis to
a posteriori approach. The raw data supporting the conclusions of this article will be
Although the final version of the forms preserved comparable made available by the authors upon formal request, without
comprehension question types, the referenced-age percentiles undue reservation.
might be more useful for normative comparison purposes than
for the investigation of the cognitive processes involved in the
comprehension itself. Therefore, for a complete investigation ETHICS STATEMENT
10 Another evidence was that fit was not computed for two items (A73; B95) The studies involving human participants were reviewed and
because the ability level of the sample did not cover their difficulty. approved by Ethical Committee of the Federal University of
Frontiers in Psychology | www.frontiersin.org 11 September 2021 | Volume 12 | Article 662192You can also read