Dead zones How Agricultural Fertilizers Kill our Rivers, Lakes and Oceans - Greenpeace Research Laboratories
←
→
Page content transcription
If your browser does not render page correctly, please read the page content below
Dead
zones
                                    greenpeace.org

How Agricultural Fertilizers
Kill our Rivers, Lakes and Oceans
Lead author:
Reyes Tirado, Ph.D.
Greenpeace Research Laboratories
University of Exeter, UK
GRL-TN-08-2008
http://www.greenpeace.to

Acknowledgements:
With special thanks for advice
and editing to Jan van Aken, Eric Darier,
Josh Brandon, Sarah King,
Isabelle Meister and Michelle Allsopp.

Photos :
cover: © iStock/Schweitzer
p. 4: © Eau Secours/McGee
p. 7: © Greenpeace/Beltrà
p. 9: © Greenpeace/Stone
p. 11: © iStock/Cardamone
p. 13: © iStock/Sherwood Veith
p. 15: © Greenpeace/Robinson
p. 17: © Greenpeace/Baléia
p. 19: © Greenpeace/Kirchhof
p. 24: © Fotolia/Malevich

Dead zones : How Agricultural Fertilizers
Kill our Rivers, Lakes and Oceans

ISBN 978-0-9810375-1-6 (pdf)
© Greenpeace
Summer 2008
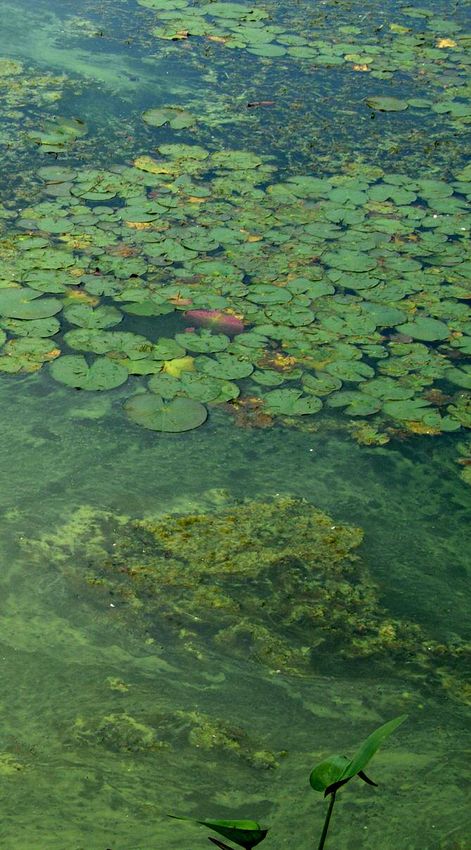
Table of Contents
Introduction

1   Definitions                                  4
    Algal blooms: What are they?
    Nutrient overloading and eutrophication
    Harmful algal blooms and red tides:
    1st consequence of nutrient overloading
    Depletion of oxygen and dead zones:
    2nd consequence of nutrient overloading

2   Sources of nutrient overloading
    and eutrophication                           6
    Fertilizer runoff                            6
    Nutrients from domestic sewage               8
    Phosphorus                                   8
    Nutrients from industrial sources            9
    Burning of fossil fuels                     10
    Influence of climate change                 10

3   Oxygen depletion, dead zones
    and other effects                           11
    Oxygen depletion around the world           11
    Dead zones and fertilizers                  12
    Biodiversity loss and jellyfish invasions   12

4   Examples of nutrient pollution,
    HABs and dead zones                         13
    China                                       13
    India                                       13
    Philippines                                 15
    Thailand                                    15
    Europe                                      15
    United States: Gulf of Mexico               16
    Mexico: Gulf of California                  16
    Canada                                      17

5   Mitigation options                          20

6   References                                  22
Introduction
  Fertilizer run-off from industrial agriculture
  is choking the planet’s oceans, rivers and lakes.
  Nitrogen and phosphorus pollution feed explosive
  algal blooms that suck the oxygen from the water
  as they grow. These algal blooms result in dead
  zones that have become a recurrent feature
  in every ocean and on every continent from the
  Gulf of Mexico to the Black Sea, from Canada’s
  Lake Winnipeg to China’s Yangtze Delta. As global
  warming heats our oceans, these problems will
  only worsen. Unless measures are put in place
  to control fertilizer usage, losses to biodiversity
  will continue to mount, coastal and inland fisheries
  will suffer and summer beaches could become
  toxic no-go zones devoid of life.

1 Definitions
  ALGAL BLOOMS:                    Some algal blooms are             NUTRIENT OVERLOADING                HARMFUL ALGAL BLOOMS
  What are they?                   prompted by natural processes     AND EUTROPHICATION                  AND RED TIDES:
  An algal bloom is essentially    like the seasonal upwelling       Nutrient pollution, in the form     1st consequence
  a rapid and massive growth       of nutrient-rich deep seawater    of nitrogen or phosphorous,         of nutrient overloading
  of minute plants that float      (Kudela et al. 2005), but         reaches coastal waters from         Harmful algal blooms (HABs)
  in the water (phytoplankton)     they are mostly the result        a variety of human sources          refer to algal blooms that
  in rivers, lakes and oceans.     of human-related nutrient         including agriculture runoff of     have negative effects. These
  There is a great diversity       pollution in the water and the    fertilizers into rivers, domestic   may be direct effects, when
  of algae that form blooms,       consequent massive growth         and industrial sewage               the algae produce toxins
  with different colours, toxic    of organisms (Diaz et al. 2004,   discharges and atmospheric          that sicken or kill human
  properties and other traits,     Dumont et al. 2005, Glibert et    pollution from burning of fossil    and aquatic organisms.
  but generally each algal bloom   al. 2005). The more nutrients     fuels (Rabalais et al. 2002,        Indirect negative effects
  event is caused by one or        are available in the water,       Dumont et al. 2005, UNEP/GPA        include declining fisheries
  two species of algae. If algal   the more the algae can grow       2006). Eutrophication means         and biodiversity in coastal
  blooms involve red algae,        and develop thick blooms.         an increase in nutrients in         areas, or depleting oxygen
  the blooms are also known                                          inland or coastal water which       in the water creating dead
  as “red tides.”                                                    often cause the massive             zones in the oceans.
                                                                     growth of aquatic organisms.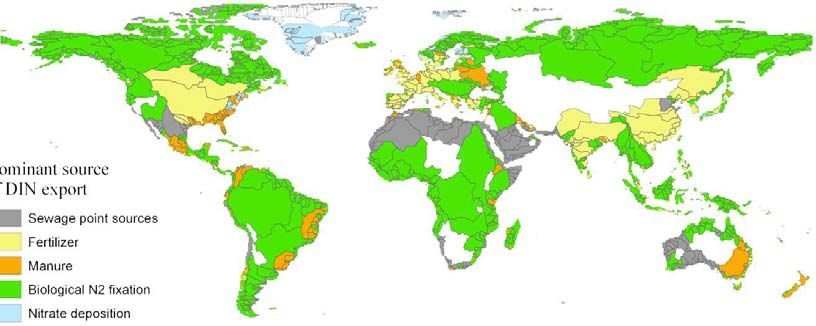
Red tides are simply algal       DEPLETION OF OXYGEN                 fish, crab or other animal         caused eutrophication
blooms of reddish coloration,    AND DEAD ZONES:                     can be found in these areas        (Figure 1). Most dead zones
but algal blooms can be red,     2nd consequence                     (Jackson et al. 2001, Rabalais     are seasonal, appearing once
orange, brown or green.          of nutrient overloading             et al. 2002). Oxygen depletion     a year usually in the warmer
They occur when the              Dead zones in the oceans            is likely to become a keystone     months after rainfall boosts
microscopic algae grow in        are coastal areas where             marine impact in the 21st          nutrient runoffs, and others
such concentration that their    the water closer to the seafloor    century (Jackson et al. 2001,      are permanent, like the one
pigment becomes visible          is depleted in oxygen (Diaz         Diaz et al. 2004). Many            in the Baltic Sea (see Figure 4,
to the naked eye, but in spite   2001). Water with very low          studies documenting change         which distinguishes between
of the term “tide” they have     levels of oxygen is called          in marine ecosystems indicate      annual, permanent and
nothing specifically to do       hypoxic; when no oxygen can         that oxygen depletion is           episodic dead zones).
with tides.                      be detected, it is called anoxic.   a major phenomenon that
                                 The lack of oxygen in hypoxic       is the manifestation of nutrient
                                 zones on the seafloor makes         overloading and eutrophication
                                 it impossible for fishes and        linked to human terrestrial
                                 invertebrates to survive, and       activities (Diaz et al. 2004).
                                 thus the term “dead zone”           There are now 199 documented
                                 refers to the fact that no living   dead zones related to human-

                                                                                                                                       5
DEAD ZONES : HOW AGRICULTURAL FERTILIZERS KILL OUR RIVERS, LAKES AND OCEANS
Sources of nutrient overloading Harmful algal blooms (HABs) are clearly linked to nutrient
2 and eutrophication overloading, but other environmental factors influence their
occurrence and intensity. For example, warmer temperatures
stimulate algal growth and lack of windy weather prevents
Both phosphorus and nitrogen are nutrients that are water from mixing, thus promoting stable conditions for bloom
responsible for eutrophication worldwide, but nitrogen formation. Natural processes like the upwelling of deep-sea
is one of the most important nutrients for ecosystem waters, or the fertilization of algae with iron—which enables
processes because it is often the most limiting nutrient, algae to utilize nitrogen—carried in wind-blown dust from the
especially in estuaries and other marine areas (Diaz et al. Sahara, are also linked with toxic red tides and other HABs
2004, UNEP and WHRC 2007). Phosphorus (mostly from in specific regions.
fertilizers, sewage and detergents) also contributes to
eutrophication, mostly in freshwaters. In many cases
nitrogen and phosphorus pollution can also interact,
Fertilizer runoff
so that the integrated management of both is needed in Globally, and on every continent except Africa, synthetic
addressing environmental impacts (UNEP and WHRC 2007). nitrogen fertilizer is the single largest human-related source
of nitrogen in coastal waters, representing about 40% of
Nitrogen flow towards oceans is strongly increasing,
global anthropogenic nitrogen entering marine ecosystems
a trend that is expected to continue. Since pre-industrial
(11 million tonnes of nitrogen per year). The other 60% comes
years, nitrogen flows have increased 15-fold in North Sea
from domestic and industrial sewage, animal wastes, growth
watersheds, 11-fold in the northeastern United States,
of leguminous crops and atmospheric loads from burning
10-fold in the Yellow River basin, approximately 6-fold
of fossil fuels which combined add another 16 million tonnes
in the Mississippi River basin, 5-fold in the Baltic Sea
nitrogen per year (Maranger et al. 2008). Fertilizer runoff
watersheds, and approximately 4-fold in south-western
is the dominant source of nitrogen pollution in South and
Europe (UNEP/GPA 2006). Projections for 2030 show
Eastern Asia, Europe, and the Midwest in the US (Dumont
an increase in global nitrogen export to ocean areas
et al. 2005; see Figure 2). South and Eastern Asia and
of 14% compared to 1995 (UNEP/GPA 2006).
Northern Europe have the largest rates of inorganic nitrogen
The main sources of nutrient overloading are as follows: exports to coastal waters in the world, up to 5000 kilograms
(kg) nitrogen per square kilometre (km) of land area per year
1. Fertilizer runoff, which is a major source of nutrients
(Dumont et al. 2005).
in many eutrophic areas and represents about 67%
of nitrogen input in the Mississippi river flowing to
One of the reasons behind this human-related massive
the Gulf of Mexico (Rabalais et al. 2002, Rabalais
nitrogen overloading is the inefficient way we use nitrogen
2007), and more than 50% of the nutrient inputs
to produce food: the amount of nitrogen used for food
in the Baltic Sea (UNEP and WHRC 2007) and Taihu
production is many times higher than the amount actually
Lake (Liu and Qiu 2007).
consumed by humans in foods, leaving the unused portion
2. Domestic sewage, including human wastes and to pollute soils, waterways and the atmosphere. For example,
phosphorus detergents. less than 20% of the nitrogen applied on the farm to grow
animal feed is consumed by the person eating meat from
3. Industry, including manufacturing of fertilizers, and
a typical industrial swine production system; the other 80%
wastewater discharges.
is lost into the environment (UNEP and WHRC 2007). Across
the globe, in average, 12% of the synthetic nitrogen fertilizer
4. Burning of fossil fuels, which generally has a lower
applied to land directly reaches coastal waters, but that
contribution, but can be very significant in certain highly
amount can be as high as 30% in areas of high runoff,
industrialised areas, and represents about 30% of nitrogen
as in cultivated high rainfall areas (Maranger et al. 2008).
input in the Baltic Sea and about 13% in the Mississippi
In the last 40 years, the amount of fertilizer directly entering
River (Howarth et al. 2002).
6SOURCES OF NUTRIENT OVERLOADING AND EUTROPHICATION
coastal waters has increased approximately 6-fold, due to For example, there is a correlation between the global
the exponential growth of fertilizer use worldwide (Maranger increase in documented cases of paralytic shellfish
et al. 2008). China, for example, which consumed less poisoning—caused by several HAB species—and the global
than 5 million tonnes of nitrogen fertilizer in the 1970s, now increase in urea use over the past three decades, as shown
consumes more than 30 million tonnes per year, representing in Figure 3 below (Glibert et al. 2006). Although this is not
25% of global nitrogen fertilizer consumption and leading to a causal link between urea and HABs, it points to the effect
significant increased nitrogen pollution of its coastal waters that the massive worldwide increase in urea use could have
(FAOStat 2008, Glibert et al. 2005). on HABs.
Not only the amount, but also the type of fertilizer being Some of the clearest examples of the relationship between
used has changed dramatically, and this might help explain HABs frequency and increases in total nutrient loadings
the increase of certain harmful algal blooms in some regions. to coastal waters come from China. Since the 1970s,
Global use of urea has increased more than 100-fold in when escalation in use of chemical fertilizer began in China,
the past four decades and now constitutes more than 50% the number of HAB outbreaks has increased over 20-fold,
of the global nitrogen fertilizer use (Glibert et al. 2006). This with blooms that appear now in more and larger areas,
increase in urea seems to be linked to the increase in the are more toxic and more prolonged (Glibert et al. 2005,
growth of specific HABs, because certain toxic and nuisance UNEP and WHRC 2007). In northern European waters and
algal species may preferably use urea over other type of in the Gulf of Mexico, HABs have also been clearly linked to
nitrogen compounds for their nutrition (Glibert et al. 2006). increases in nitrate content in river flows (Glibert et al. 2005).
FIGURE 1 Global map of 199 coastal oxygen depletion zones related to human-caused eutrophication
SOURCE: UNEP AND WHRC 2007
7DEAD ZONES : HOW AGRICULTURAL FERTILIZERS KILL OUR RIVERS, LAKES AND OCEANS
Nutrients from domestic sewage Phosphorus
The growing human population and its rising generation While industrial sources may be important locally, the
of sewage have also increased nutrient inputs to the two main sources of phosphorus inflows to surface water
environment. In developing countries, the majority of are municipal wastewater and agriculture. The main
wastewater is released untreated directly into waterways. agricultural sources are from animal husbandry and fertilizer
Fewer than 35% of cities in developing countries have any use. Phosphorus from detergents contributes an estimated
form of sewage treatment (UNEP and WHRC 2007). Where 25% of the phosphorus in municipal wastewater in some
sewage treatment facilities do exist, they often provide only European Union countries where phosphorus detergents are
primary treatment, which does little to remove nitrogen. still used. Phosphorus discharges are reduced considerably
Even in the developed world, most sewage treatment by both banning phosphorus from detergents and making
facilities do not include the tertiary treatment step that improvements to wastewater treatment. A number of
removes most of the nitrogen. In some local cases, countries have been successful in reducing eutrophication
wastewater is the largest source of release of nitrogen through implementation of measures to reduce phosphorus
into the environment, although regionally agriculture is loads. Notable examples are Lake Geneva in Switzerland,
still the largest contributor to nutrient overloading (UNEP Lake Erie in the United States, and Lake Endine in Italy.
and WHRC 2007). In all cases, the results indicate that a phosphorus reduction
between 70% and 90% is necessary to significantly reduce
eutrophication (Glennie et al. 2002).
FIGURE 2 Dominant sources of dissolved inorganic nitrogen (DIN) export in different river basins across the world
Dominant source
of DIN export
Sewage point sources
Fertilizer
Manure
Biological N2 fixation
Nitrate deposition
SOURCE: DUMONT ET AL. 2005
8SOURCES OF NUTRIENT OVERLOADING AND EUTROPHICATION
Of the phosphate produced by the world’s industry today, Many industrial manufacturing and processing plants use
about 80 to 85% is used in fertilizers. The next largest user, nitrogen and phosphorus compounds as base products.
but relatively minor in comparison, is the detergent industry.
Phosphate is also used in the manufacture of animal feed Burning of fossil fuels
supplements (Chambers et al. 2001). Burning of fossil fuels (both for transport and energy
generation in power plants) creates nitrogen gasses (NOx)
Nutrients from industrial sources that can directly deposit in water bodies or indirectly flow
from landscapes where they were previously deposited.
Nutrient pollution from localized industry discharges was
They represent a significant source of nitrogen in certain
of large relative importance until few years ago, especially
areas, like the Baltic Sea, where 30% of the nitrogen is
in developing countries. Currently nutrient pollution from
estimated to come from this source, or in the Mississippi
industry seems a smaller overall problem, due to the stricter
River, flowing to the Gulf of Mexico, where it represents
controls in wastewater discharges and the increased relative
13% (Howarth et al. 2002).
importance of non-point sources (agriculture and livestock
especially). However, in specific locations, industry discharges
are still the major culprit in certain eutrophication and HAB
events.
FIGURE 3 Global distribution of the consumption of urea fertilizer and of observed incidence of paralytic shellfish poisoning
Urea use (1965) – PSP (1970) Urea Consumption (Mg/y)
0 - 400
401-1500
1501- 3500
3501- 7500
7001- 15000
15001- 30000
30001- 100000
100001- 200000
200001- 500000
500001- 1500000
Urea use (1999) – PSP (2000)
This map shows the global distribution of the
consumption of urea fertilizer, in metric ton per year,
by country, in 1965 (upper panel) and in 1999 (lower
panel), and the global change in recorded observations
of dinoflagellates contributing to paralytic shellfish
poisoning (PSP) or documented cases of PSP, from
1970 (upper panel) to 2000 (lower panel). The PSP
observations are shown as small circles superimposed
on the base map of changes in global urea use, by
country, for the time interval from 1965 (upper panel)
to 1999 (lower panel). Note that these estimates of urea
consumption do not include uses other than fertilizer.
SOURCE: GLIBERT ET AL. 2006. WITH KIND PERMISSION
OF SPRINGER SCIENCE AND BUSINESS MEDIA.
9DEAD ZONES : HOW AGRICULTURAL FERTILIZERS KILL OUR RIVERS, LAKES AND OCEANS
In Canada, the massive increase in tar sand oil production
in the west of the country has led to an increase in acid MAIN EXAMPLES OF INDUSTRIES
rain transporting sulphur and nitrogen gasses (NOx) to the RESPONSIBLE FOR NUTRIENT DISCHARGES
east of the continent and in particular Quebec and Ontario ARE THE FOLLOWING:
(Government of Canada 2008). As a result, in 2007, the • Fertilizer manufacturing plants: ammonium nitrate,
Quebec government’s own records estimated that over urea, phosphates, etc.
160 lakes or rivers were affected by algae blooms, including
• Pesticide manufacturing plants: organophosphorus
some in regions where there are no agricultural activities
pesticides, but also nitrogen chemical compounds.
that could have caused the blooms (Government of Quebec
2007). • Food processing plants: discharges of food wastes,
sodium nitrite used in the commercial production of
cured meat such as sausages.
Influence of climate change
• Phosphorus detergent production: sodium
Global warming could potentially exacerbate the tripolyphosphate (STPP) still used as main detergent
occurrence of harmful algal blooms in future years, builder in many countries.
since higher temperatures tend to stimulate algal growth
• Industries using urea as base product: fire retardant
and favour toxic algal species (Chu et al. 2007). Other
paints, tobacco products, cosmetic industry—
physical factors affected by climate change could stimulate
moisturizing creams.
nutrient flows and eutrophication. For example, referring
to the Gulf of Mexico, a group of scientists recently stated:
“Future climate change, within the range likely to occur
in the 21st century, could have profound consequences
to hypoxia in the northern Gulf of Mexico. If changes result
in increased precipitation, river discharge and nitrogen
loading, hypoxia is expected to be more extensive,
persistent and severe” (Rabalais et al. 2007).
10OXYGEN DEPLETION, DEAD ZONES AND OTHER EFFECTS
Oxygen depletion, Oxygen depletion around the world
3 dead zones and other effects The worldwide distribution of coastal oxygen depletion
is either centred on major population concentrations, or
closely associated with developed river basins that deliver
Dead zones in the ocean form when the millions of
large quantities of nutrients (Diaz et al. 2004). In some
minute floating plants and animals (phytoplankton and
regions, dead zones extend across vast areas, and the
zooplankton) that are associated with algal blooms die
problem is growing worldwide. The number of dead zones
and sink to the deep sea floor where they are consumed
has doubled every decade since the 1960s. The United
by microbes. In turn, these microbes also grow dramatically,
Nations Environmental Programme estimated in 2006 that
and consequently use up the oxygen in bottom waters.
the number of dead zones has increased worldwide from
The oxygen content in fully oxygenated seawater levels
150 in 2004 to 200 in 2006—a 30% increase in just two
is about 10 parts per million (ppm); once water oxygen levels
years (UNEP 2006).
fall to 5 ppm, fish and other marine animals have trouble
breathing (Diaz 2001, Dodds 2006). Hypoxic zones are
The largest dead zones are found in coastal areas of the
defined as areas where the oxygen level has fallen below
Baltic Sea (84,000–100,000 km 2), northern Gulf of Mexico
2 ppm. While fish swim away when levels fall below 2 ppm,
(21,000 km 2), and until recently, the northwestern shelf
other less mobile animals cannot escape and they begin
of the Black Sea (40,000 km 2). Smaller and less frequently
to die at around 1.5 ppm oxygen (Diaz et al. 2004).
occurring areas of hypoxia occur in the northern Adriatic Sea,
Biodiversity is thus diminished on the seabed as many
the south North Sea and in many US coastal and estuarine
animals cannot survive, even though closer to the water
areas (Rabalais et al. 2002). Recent research shows that
surface there is still sufficient oxygen to support animal life.
FIGURE 4 Global distribution of oxygen-depleted coastal zones as of 2003
Oxygen depletion
Annual
Episodic
Periodic
Persistent
The 146 zones shown are associated
with either major population concentrations
or with watersheds that deliver large
quantities of nutrients to coastal waters.
Annual—yearly events related to summer
or autumnal stratification;
episodic—events occurring at irregular
intervals greater than one year;
periodic—events occurring at regular
intervals shorter than one year;
persistent—all-year-round hypoxia).
For an updated UNEP map with the
current 199 dead zones, see Figure 1.
SOURCE: UNEP. 2003 GEO YEAR BOOK
11DEAD ZONES : HOW AGRICULTURAL FERTILIZERS KILL OUR RIVERS, LAKES AND OCEANS
hypoxic areas are now also occurring off South America, a result of the economic collapse of the former Soviet Union
China, Japan, southeast Australia and New Zealand. and declining subsidies for fertilizers. Less fertilizer input to
Some of the more recent registered sites appear to be in the Danube River was accompanied by signs of recovery of
the Archipelago Sea in Finland, the Fosu Lagoon in Ghana, both open-water and seafloor ecosystems of the Black Sea.
the Pearl River estuary and the Yangtze River in China, By 1999, the hypoxic area receded to less than 1000 km 2.
and the western Indian shelf (see Figure 4) (UNEP 2006). However, according to a study published in 2001, there has
been no recovery of seaweed beds and most fish stocks
The UNEP map above (Figure 5) shows dead zones in are still depleted (Rabalais et al. 2002). Dead zones in the
the oceans as of 2003, distinguishing between persistent Baltic and Black Sea led to the disappearance of bottom
and temporary dead zones. For example, some of the fisheries in these areas (Diaz 2001).
dead zones in the northern Gulf of Mexico are dominant
from spring through to late summer, but rare in the autumn
Biodiversity loss and jellyfish invasions
and winter, while the dead zones in the Baltic are permanent
year-around (Rabalais et al. 2002). Besides the increased frequency and severity of HABs
and dead zones, nutrient overloading has been also
blamed for the disappearance of seagrass habitats
Dead zones and fertilizers and massive loss in coastal biodiversity (Diaz et al. 2004).
Accelerated growth of the hypoxia zone in the Gulf of Jellyfish invasions in coastal waters, like recent recurrent
Mexico follows the exponential growth of fertilizer use events in the Mediterranean, Chinese river estuaries and
beginning in the 1950s (Rabalais et al. 2002). In the Baltic, Japan coasts, are the result of a number of factors, but
there is clear evidence that excess use of fertilizers is nutrient loading and eutrophication are at the root cause
associated with dead zones in bottom waters (Karlson of the problem (Purcell et al. 2007). The consequences
et al. 2002). The dead zone in the northwestern Black Sea of overfishing can further exacerbate eutrophication
in the 1970s and 1980s covered up to 40,000 km 2; since impacts (Maranger et al. 2008). As humans continue
then there has been some recovery, most likely due to the to unsustainably exploit fisheries, jellyfish and plankton
reduction in use of agricultural fertilizers. This occurred as do not have to face their usual predators and competitors,
which would usually regulate their population growth.
12EXAMPLES OF NUTRIENT POLLUTION, HABS AND DEAD ZONES
Examples of nutrient pollution, In the Bohai Sea, “more than one fifth of the country’s
4 HABs and dead zones sewage is dumped in the Bohai Sea every year, probably
making it a dead zone in 10 years if no measures are taken
to check the pollution,” according to a marine ecology
China expert quoted by a government agency (SEPA 2008). Until
Nutrient pollution and HABs are widespread in coastal late 2005, 42% of cities in China (278 of the 660) did not
and freshwater bodies in China. The three coastal regions have any wastewater treatment facilities, and more than
with highest frequency of HAB outbreaks from 1933 to 2001 half of all wastewater treatment plants in 30 big cities were
were (see Table 1): running at less than 30% of the treatment capacity
• the Bohai Sea; (Liu and Qiu 2007).
• in the East China Sea: Hangzhou Bay and the Yangtze
River estuary; and, The consumption of chemical fertilizers has increased
• in the South China Sea: Pearl River estuary and the coast dramatically in recent years in China, and researchers
of east Guangdong. show that between 55 and 75% of the nitrogen and
75 and 90% of the phosphorus in fertilizers is not used by
During 2007, 82 cases of red tide were reported in Chinese the crop and will partly reach water bodies through runoff
coasts, covering 11,610 km 2 of seawater (Liang 2008). (Liu and Qiu 2007). It is estimated that nearly 40% of the
Besides being highly eutrophic and suffering from frequent nitrogen and phosphorous in Dianchi Lake and more than
HABs, the estuaries of China’s great rivers (Yangtze and Pearl) 50% in Taihu Lake is from such non-point source pollution,
have also developed into two new dead zones in the global mostly from agriculture (Liu and Qiu 2007). A new study
oceans (UNEP 2006). published in the Chinese Journal of Ecology also showed
that nitrate from farmland fertilisation is a main source
The three most polluted and eutrophic lakes are the Taihu of nitrogen pollution in Taihu Lake, followed by domestic
and Chao lakes in East China and Dianchi Lake in Yunnan sewage and livestock manure. See summary of pollution
province in South China (see Table 1). sources on HABs in Table 1.
Fertilizers runoff, livestock, aquaculture, domestic sewage India
from cities and industrial discharges are the main sources
In India there has historically been very limited scientific
of nutrient loading in Chinese water bodies. Nutrient
research in the occurrence and biology of harmful algal
discharges from industries have been reduced to a large
blooms (Bhat and Matondkar 2004). However, there are
extent, in the last decade, whereas nutrient loading from
examples of red tides being reported both in the East and
fertilizer runoff and from domestic sewage have increased
West Coast of India. Recently, HABs have been pointed
and continue to be largely neglected (Dai et al. 2006,
out as the possible cause of poisonings and deaths after
Tang et al. 2006, Liu and Qiu 2007, Qiu et al. 2007).
the consumption of shellfish in different parts of the state
of Kerala over the years (Daijiworld.com 2008). In October
In the Pearl River estuary the key nutrient loading problems
2006, the United Nations Environment Program (UNEP)
come from fertilizer runoff from farms in the middle and
declared a new dead zone in the ocean, situated in the
low reaches of the river, and sewage from the surrounded
western Indian shelf (UNEP 2006).
populated areas. More than 70% of the domestic sewage
is discharged untreated into the Pearl River or its coastal
water directly (Huang et al. 2003, Dai et al. 2006).
13DEAD ZONES : HOW AGRICULTURAL FERTILIZERS KILL OUR RIVERS, LAKES AND OCEANS
TABLE 1 Main locations of eutrophication and HABs in China
LOCATION OF HABS MONTHS MAIN NUTRIENT HABS OCCURRENCE
OF PEAK POLLUTION SOURCES AND EFFECTS
COASTAL WATERS
Bohai Sea July – August Fertilizer runoffs, industrial discharges HABs increasing in frequency,
(worst in Yellow River and domestic sewages. Surrounding often accompanied by massive
estuary, Liaodong Bay, land is home to 21% (~300 millions) seafood kills
Bohai Bay) of the Chinese population
East China Sea May – June Yangtze River flows with fertilizer From 2000 to 2004:
(worst in Yangtze runoffs, industrial discharges 246 HABs reported (compared
River estuary, and domestic sewages. The river to 111 HABs in the 1990s)
Zhejiang eastern coast) nitrate concentration and flux have
increased about 10-fold from
1968 to 1997
South China Sea
(worst in Pearl March– May Fertilizer run-off from farms in About 15 HABs reported
River estuary, the middle and low reaches every year from 1998 to 2003.
Shenzhen coast) of the Pearl River, industrial discharges In 1998, a massive HAB near
and sewage from the surrounded Hong Kong killed ~ 80% of
populated areas the fish farm stock
FRESHWATER BODIES
Taihu Lake June > 50% from non-point pollution Massive increase in the last decade,
(agriculture from the western watershed, now persisting throughout the
domestic sewage and aquaculture). summer. Microcystins, potent liver
Nutrient inputs from industry discharges toxin poisoned water supply
have largely declined in the last decade
Chao Lake July – Sept. Mostly from non-point sources Highly eutrophic sine 1990s,
(fertilizers and domestic sewage). HABs increasing in frequency
Nutrient load from point sources and extension in last years
has been cut down by 40% since
the late 1970s
Dianchi Lake April – May ~ 40% from non-point pollution Highly eutrophic sine 1990s,
(fertilizers) and also domestic sewage. HABs increasing in frequency
"clean-up measures have failed because and extension in last years
they have focussed almost exclusively
on industrial point sources and not
on agricultural runoff or domestic
sewage pollution” (Guo 2007)
Xiao River Fertilizers runoff, industrial discharges HABs downstream from the
(Three Gorges Dam) and domestic sewages. Three Gorges and a deterioration
in aquatic life
14EXAMPLES OF NUTRIENT POLLUTION, HABS AND DEAD ZONES
Philippines The Gulf of Thailand has been a major marine resource
for Thai people during centuries. However, agricultural
HABs have been recognized as a catastrophic phenomenon
and industrial developments have made eutrophication
that has affected public health and economy in the country
the most serious problem of the inner Gulf of Thailand
since 1983 (Relox and Bajarias 2003). The Philippines’
today (Menasveta 2001, Cheevaporn and Menasveta
shores have experienced more than 120 outbreaks of
2003). The runoff from Thailand’s four principal rivers
red tides and other harmful algal blooms in coastal waters
ends up in the Gulf, causing eutrophication. The Chao
between 1990 and 2003, most of them in Manila and
Phraya is the most polluted of the four rivers, particularly
Masinloc bays (Wang et al. 2008). In Manila Bay, toxic
in the river estuary area, due to the urban and industrial
blooms have been increasing since the first recorded
expansion. The Ta Chin is becoming increasingly polluted
occurrence in 1983 (Sombrito et al. 2004) and 80% of
due to accelerated agricultural and industrial development
blooms have occurred during the last decade (Wang et al.
as well as urban expansion from the Bangkok area.
2008). In Laguna de Bay, the largest freshwater lake in
On occasion, paralytic shellfish poisoning (PSP) after the
the country, a regular bloom of the toxic blue-green algae
consumption of contaminated mussels in the red tide area
Microcystis aeruginosa is experienced during the months
of Pranburi river estuary has occurred, even causing human
of May to July or from September to November, varying
deaths (Menasveta 2001). Anoxic conditions due to algal
from year to year (Baldia et al. 2003). Toxins produced by
blooms could cause massive fish death: in August 1991,
the blooms could endanger fish produced in aquaculture,
there was a mass fish kill in the coastal area of Cholburi
the major economic activity in the lake. Eutrophication
due to a vast red-tide blooming of Noctiluca covering the
caused by organic and nutrient discharges from aquaculture
area from Bangsan district to Pattaya (Menasveta 2001).
and agriculture seems to be the major causes of algal
blooms in fresh and coastal waters in the Philippines
Rate of occurrences of plankton bloom has been increasing
(Wang et al. 2008).
in the last decades in the Gulf of Thailand (Singhasaneh
1995). Two species of blue-green algae (Trichodesmium
Harmful algal blooms have adverse effects on the marine
erythraeum and Trichodesmium thiebautii) and Noctiluca
resources, human health and economy of the country.
miliaris were found to be the cause of coastal algal blooms
Harmful algal blooms in the Philippines do not only pose
(Singhasaneh 1995). Red tides were often observed during
a public health hazard but a major economic threat as
the period of December to February in the western part
well. Between 1983 and 2002, a total of 2,122 paralytic
of the inner Gulf, whereas in the eastern part, blooms
shellfish poisoning (PSP) cases, with 117 deaths, affecting
were often observed during the period of March to August.
all age group, were reported (Bureau of Fisheries and
Aquatic Resources 2003). The occurrence of HABs has
been responsible for the economic losses in the fisheries Europe
sector of the country, particularly the shellfish industry. In the Mediterranean Sea, concentrations of nutrients in
The 1983 outbreak in central Philippines resulted in a loss rivers are generally at least four times lower than in rivers
of 2.2 million pesos and there was a dramatic decline in in northwest Europe, but there is evidence of an upward
demand for fishery products during 1988 in Manila Bay; trend in both nitrogen and phosphate concentration in water
it caused extensive economic damage, since prices of flowing into coastal areas.
all seafood dropped to almost 40% of the normal price.
In the Black Sea, nitrogen levels are four times higher
Thailand than they were in the 1960s. There is substantial evidence
that this eutrophication is the result of large increases in
Recent studies in Thai reservoirs have found frequent HABs
the discharge of nitrogen and phosphorus to the Black Sea
in freshwater bodies (Peerapornpisal 2006). Researchers
from the 1960s and 1970s (Mee 2001). Until recently, the
have found proliferation of the toxic algae in reservoirs
northwestern shelf of the Black Sea was one of the largest
in Chiang Mai (Mae Kuang Udomtara Dam) and Nakhon
dead zones worldwide (40,000 km 2). However, important
Pathom (Bang Phra reservoir) (Peerapornpisal et al 1999,
reductions have taken place since the political and economic
Chantara et al 2002).
15DEAD ZONES : HOW AGRICULTURAL FERTILIZERS KILL OUR RIVERS, LAKES AND OCEANS
changes in the former Soviet Union and declines in subsidies According to Helcom experts, “over-enrichment, meaning
for fertilizers. Less fertilizer input to the Danube River was there are too many nutrients in the Baltic Sea causes a
accompanied by signs of recovery of both open-water and situation with algae blooms in the summer, which leads
seafloor ecosystems of the Black Sea. However, according to depleted oxygen in some areas. This has an effect
to a study published in 2001, there has been no recovery on biodiversity. For instance, cod cannot lay their eggs
of seaweed beds and most fish stocks are still depleted at the bottom of the sea because eggs need oxygen.”
(Rabalais 2002). Nitrogen from rivers represents 65% of (Gunter 2005). In the eastern Baltic Sea a permanent dead
totals, and 70% of this comes from the Danube River alone. zone covers up to 100,000 km 2. Blooms of blue-green
Now that many central and eastern European countries algae in the Baltic also lead to regular beach closures
have joined, or are in the process of joining, the European and fish kills.
Community, the Black Sea will be influenced by the
Community’s common policies and regulations. As new
United States: Gulf of Mexico
member countries seek to have the same technologies
and industrial agriculture of other members, the slow In the United States, diffuse nitrogen and phosphorus
recovery of the northwestern Black Sea shelf will be pollution has increased dramatically, causing eutrophication,
endangered (Mee et al. 2005). harmful algal blooms, dead zones, coral reef destruction,
loss of sea grass and kelp beds, fish kills, shellfish
The Baltic Sea has changed from a nutrient-poor poisoning, and seabird and marine mammal deaths
clearwater sea in the 1800s into a nutrient-rich eutrophic (UNEP/GPA 2006). Human activities have increased nitrogen
marine environment, due to excessive inputs of both nitrogen flux in the Mississippi River basin about four-fold. The single
and phosphorus. In the Baltic Sea, nitrogen from rivers largest coastal system affected by eutrophication is a large
constitutes 69% of total nitrogen inputs, and atmospheric dead zone in the Gulf of Mexico. In the early 1990s it was
inputs (mostly from burning of fossil fuels) 31% of the total. estimated to be 9,500 km 2 and in 2000 and 2007 it reached
The Baltic Sea region is one of the most naturally sensitive 22,000 km 2 (Rabalais 2007). “Most of the nutrients that get
to oxygen deficiency in Europe and it is one of the most to the Gulf come from agricultural activities”, says Dr. Nancy
polluted seas in the world, according to experts in the Rabalais, Director of Louisiana University’s Marine Consortium
Helsinki Commission (Helcom), the governing body for and an expert on the Dead Zone. According to one of her
the protection of the Baltic Sea. recent publications, 67% of the nitrates in the basin are
of agricultural origin, from the vast farming areas all along
Helcom assessments clearly show that agriculture is one the Mississippi River.
of the main sources of nutrient pollution entering the Baltic
Sea: more than 50% of the nitrogen and phosphorus loads Mexico: Gulf of California
entering the sea by waterflow come from agriculture (UNEP
Scientist estimate that nearly 75% of the nitrogen applied
and WHRC 2007). Helcom’s current efforts are mainly focusing
in fertilizer in the Yaqui Valley in western Mexico is lost into
on the identification of further measures to reduce loads
the atmosphere and runs off in surface waters. Year after
from agriculture in the different parts of the Baltic Sea
year, an estimated 11,000–22,000 tons of nitrogen are
catchment area. However, other nutrient sources, such as
washed into the sea. This triggers a particularly dramatic
municipalities, scattered settlements and burning of fossil
effect in the nitrogen-deficient waters of the Gulf of California,
fuels still contribute significantly to the total inputs, and must
stimulating algal blooms within days of fertilisation and
also be considered to reduce overall nitrogen pollution. The
irrigation.
progress in reducing nutrient loads from point sources such
as municipal and industrial wastewater treatment plants has
In 2005, a team of researchers from Stanford University
been good, with the 50% reduction target for phosphorus
in the United States demonstrated the close correlation
achieved by almost all the contracting parties (UNEP and
between overuse of nitrogen fertilizer and explosive algal
WHRC 2007). However, other non-point pollution sources
growth in coastal waters through satellite pictures (Beman
of nutrients, like agriculture, have not shown much progress.
et al. 2005). The images show thick algal bloom right off
16EXAMPLES OF NUTRIENT POLLUTION, HABS AND DEAD ZONES
the coast, fuelled by nitrogen runoff from wheat fields. In Lake Winnipeg, concentrations of total nitrogen and
The researcher measured algal blooms as big as 577 km 2 phosphorus have approximately doubled in less than
in the Gulf of California, which is one of the most productive 10 years. The current state of the lake with respect to nutrient
and biologically diverse marine ecosystems in the world. concentrations and algal blooms is roughly the same as
More species of whale and dolphin feed and breed here Lake Erie was at the height of the drastic eutrophication
than anywhere else. Nearly 900 fish species and 34 species problem in the early 1970s (Schindler et al. 2006). In 2007,
of marine mammals swim in these waters, and more than the Quebec government’s own records estimated that over
800 of the Gulf”s species are found nowhere else. Hundreds 160 lakes or rivers were affected by algae blooms, including
of species of birds, both migratory and resident, nest in some in regions where there are no agricultural activities
mangroves and coastal lagoons. The effects of the regular that could have caused the blooms (Government of Quebec
algal blooms on this unique diversity are potentially significant. 2008). Animal farming, and hog farming in particular, remain
a major source of excessive phosphate in several watersheds
From April to May 2006, local scientists documented three in Quebec. However, a massive increase in tar sand oil
HAB events of yellow-brown colour, in Sinaloa. In May 2006, production in the west of the country has contributed to
one of these blooms provoked a massive fish mortality, an increase in acid rain in the east of the continent and in
accounting for the accumulation in the beach of about particular in Quebec and Ontario. As well, many of the lakes
60 tonnes of fish, distributed on 3 kilometres of beach in western Canada have also undergone moderate to severe
from Las Cabras to El Palmito del Verde, and which was eutrophication as a result of conversion of land to agriculture
the second fish mortality in the area associated with this and subsequent fertilization runoffs (Schindler et al. 2006).
type of HAB since 2004 (Cortés-Altamirano et al. 2006).
The agricultural sector is responsible for about 82%
of the phosphorus and 49% of the direct nitrogen pollution,
Canada
mostly through runoff from fertilized soils and animal
Canada has suffered multiple events of harmful algal husbandry (Chambers et al. 2001, Janzen et al. 2003).
blooms recently, especially in lakes and rivers in Quebec Additional indirect nitrogen atmospheric deposition from
and Manitoba. Summer of 2007 saw the massive agriculture gas emissions, such as ammonia and NOx,
occurrence of blue-green algal blooms in many Canadian would bring the total of countrywide nitrogen loading resulting
lakes, causing huge environmental impacts and economic from agriculture to 80% (Chambers et al. 2001). The most
losses. In addition, eutrophication events are increasingly rapidly increasing source of nitrogen pollution in Canada
appearing in rivers and coastal waters. is from agriculture. Both the use of commercial fertilizers
and the production of manure from livestock husbandry
Since the occurrence of natural phosphorus in Canadian have increased very rapidly. The increases in nitrogen are
freshwaters is limited, in general the main cause behind much more rapid than those in phosphorus and potassium,
algal blooms in Canadian lakes and rivers seems to be the other two main elements in commercial fertilizer.
phosphorus pollution from human activities (Chambers et al Since records began in 1950, nitrogen fertilizer production
2001). In order to preserve Canadian freshwaters, stopping in Canada has increased about 75-fold, while uses of
phosphorus pollution is an urgent priority. However, nitrogen phosphorus and potassium have increased by only 5-
pollution is also very high in the country, and it is causing and 7-fold, respectively (Schindler et al. 2006).
problems like acid rain, eutrophication and algal blooms,
especially in marine estuaries (Chambers et al 2001). These The Canadian Government has recently announced it will
problems are very difficult and expensive to control once limit the amount of phosphorus in detergents, so that
they have reached critical stages, and it is environmentally by 2010, all laundry and dishwasher detergents sold in
urgent and economically sensible to stop nitrogen pollution Canada will contain no more than 0.5% phosphates, by
before the problems become acute (Schindler et al. 2006). weight (the current limit is 2.2%, by weight). However, these
Algal blooms and accompanying summer fish kills and measures might not have a significant result, since the impact
human poisonings have been observed both in east and of phosphorus detergents on overall nutrient overloading
west Canadian marine estuaries (Chambers et al. 2001). of Canadian waters is relatively very small compared to
17DEAD ZONES : HOW AGRICULTURAL FERTILIZERS KILL OUR RIVERS, LAKES AND OCEANS
agriculture runoff. In 1996, the average contribution of On average, 70% of wetlands in southern Canada have been
detergents to phosphorus pollution in Canadian municipal destroyed, with little regard for their role as important nitrogen
wastewaters was only 8% (Chambers et al. 2001). Besides, sinks or sites of denitrification. As a result, nitrogen has
municipal water discharges only contribute 12% to total increased greatly in many surface waters. Phosphorus has
phosphorus pollution, compared to 82% from agriculture. also increased, leading to rapidly increasing eutrophication
Thus, overall, contribution of phosphorus detergents would (Schindler et al. 2006).
represent only about 1% of total phosphorus pollution in
Canadian waters. NOx emissions from electricity generation, vehicles,
and oil and gas industries are also important contributors
After direct losses from agriculture, nitrogen atmospheric of nitrogen atmospheric deposition. Vehicles emit almost
deposition (both from ammonia and NOx gasses) is the 50% of total NOx emissions in Canada, followed closely
second largest contributor to nitrogen pollution, with up by the oil and gas industries. Countrywide emissions of NOx
to 30% of total nitrogen loading, mostly from ammonia are expected to increase 17% by 2020, due to oil and gas
from livestock manure, followed by manufacturing of extraction in the west and to coal-fired electrical power
commercial fertilizer (Chambers et al 2001). Ammonia (Schindler et al. 2006). This estimate may be low, due to
emissions increased by 9% between 1995 and 2000, rapid population growth and massive developments in the
largely in agricultural areas of the west (southern parts of Alberta oil sands, which are expected to cause enormous
the Prairie Provinces and the lower Fraser River watershed, increases in nitrogen emissions to the atmosphere (Schindler
where agriculture is concentrated). Ammonia emissions et al. 2006). The Athabasca oil sands in northeastern Alberta
are expected to increase by 50% between 2000 and 2020, are under rapid development and more oil sands plants
largely as the result of the increasing intensity of livestock are now operating or under construction. Huge trucks
and poultry production and commercial fertilizer and capable of carrying hundreds of tonnes of sand each are
pesticide manufacturing (Schindler et al. 2006). expected to produce NOx that will cause nitrogen emissions
to increase by 359% over 1998 values in the near future
Increased demands for meat and decreased financial (Environment Canada 2003, Schindler et al. 2006).
returns per animal have caused an explosive growth
in livestock in Canada. From 1996 to 2001, Canadian Due partly to the transport of acid rain from west to east
cattle increased by 4.4%, hogs by 26.4%, and chickens on the prevailing winds, the regions with highest nitrogen
by 23.4%, despite a human population growth of only 4.0% atmospheric deposition in Canada are in the east of the
(Schindler et al. 2006). Hogs are particularly large sources country, especially in the southern part of Ontario and
of phosphorus and nitrogen (Chambers et al. 2001). Quebec provinces (Aherne and Watmough 2006). At least
Nitrogen applications of both manure and commercial 860,000 km 2 of Quebec (1/4 of the territory) is affected
fertilizer are high, and in most cases, in excess of plant by this phenomenon (Government of Canada 2008, cited
needs. Most notably, areas with high populations of livestock, in Le Devoir 2008). In Manitoba, the southeastern region
like southern Alberta, southern Ontario and Quebec, and of the province (south and east of Lake Winnipeg) greatly
the lower Fraser Valley and Okanagan regions of southern exceeds the critical maximum load of nitrogen deposition
British Columbia, have nitrogen applications, in the form in forest soils (Figure 11, p. 31, in Aherne and Watmough
of manure, of 1000 kilograms and more, per hectare. 2006), which could endanger the future of forest and aquatic
Commercial fertilizer use in Canada has also increased by ecosystems in the area (Boggs et al. 2005). Because the
20 to 30% every 5 years (Schindler et al. 2006). In most Canadian Government decided to use sulphur emissions
regions of Canada, regulations for discharge of animal as the “yard-stick” for controlling acid rain in the last decade,
wastes are rudimentary; most wastes are simply spread nitrogen deposition may undermine some of the benefits
or sprayed on the land. Hog operations usually discharge of controlling sulphur emissions (Environment Canada 1999).
to surface lagoons, which have high ammonia losses to In fact, it seems that nitrogen deposition has not been
the atmosphere. Timing and rates of manure application are reduced as a result of measures to control sulphur
not well regulated (Schindler et al. 2006). Riparian corridors emission and acid rain (Watmough et al. 2005).
and wetlands are filled and destroyed in many regions.
18EXAMPLES OF NUTRIENT POLLUTION, HABS AND DEAD ZONES
Aquaculture contribution to nutrient pollution in surface The rapid growth of such species as a result of nutrient
waters is growing quickly. In 1996, aquaculture contributed pollution, in combination with other factors, has led to
about 1% of the nitrogen and phosphorus pollution in surface harmful algal blooms in the inter-tidal zone in the form
waters (Chambers et al. 2001), but rapid intensification of fish of dense, green macroalgal mats (usually Enteromorpha
farming is quickly affecting Canadian waters. Along Canada’s or Ulva species) covering the seabed. An increase in
coasts, the intensification of salmon farm operations has led Enteromorpha mats, covering more than 30% of the
to significant contributions of nutrients to the surrounding sediment, has been found adjacent to salmon farms in
environment, resulting in nutrient pollution and excessive the Bay of Fundy, impairing growth rates of mollusks due
algae growth (Mente et al. 2006; CCNB 2004; Robinson et to the creation of low oxygen conditions within and below
al. 2004; Strain 2005; Strain and Hargrave 2005). The most the mats (Fisheries and Oceans Canada 2003). A salmon
frequently observed impacts occur on the sea floor in areas farm of 200,000 fish releases amounts of nitrogen and
under aquaculture cages, as the result of nutrient pollution phosphorus roughly equivalent to the nutrient waste in
and oxygen depletion and, in extreme cases, resulted in the untreated sewage from 20,000 and 25,000 people,
the creation of a dead zone devoid of life beneath cages, respectively. The 49,600 tonnes of farmed salmon produced
surrounded by an area of decreased animal diversity in British Columbia in 2000 contributed as much nitrogen
(Goldburg et al. 2001). Research near finfish farms in the as the untreated sewage from 682,000 people, and as
Bay of Fundy in the 1990s showed that diversity of animal much phosphorous as the sewage from 216,000 people
fauna (macrofauna) was reduced close to farms throughout (David Suzuki Foundation 2008).
the area and, after five years of operation of farms, changes
were documented up to 200 meters away from cages
(Fisheries and Oceans Canada 2003). 1 The major manufacturers of laundry detergent (Proctor & Gamble, Lever
Brothers) have eliminated phosphorus from laundry detergents sold in North
America. Other manufactures that have not changed their formulations
Aquaculture wastes release nitrogen and phosphorous into represent only about 5% of the market (Chambers et al 2001).
the water, but because its wastewaters are poor in silica, 2 Alberta has the most cattle; 6.4 million in 2001, an increase of 11.3% since
1996. The stated goal of the Alberta government is to double that 2001 number.
aquaculture creates conditions less favorable to diatoms Hog increases have been greatest in Quebec and Manitoba, but numbers in
and more favorable to the slow growing phytoplankton Alberta, Saskatchewan and other provinces have also increased substantially.
Chicken numbers have increased most rapidly in British Columbia, by 37%
(dinoflagellates and cyanobacteria) (Mente et al. 2006). over the same 5-year time period (Schindler et al. 2006).
19DEAD ZONES : HOW AGRICULTURAL FERTILIZERS KILL OUR RIVERS, LAKES AND OCEANS
5 Mitigation options
Since nutrient loading is the root cause in most of the HABs events and dead zones worldwide, the control of nutrient pollution
from human-related activities is the most short-term and efficient mitigation option for eutrophication and HABs problems.
The following mitigation options stand out.
1. Eliminate human-related nutrient pollution (nitrogen and phosphorus) at their main
sources; these would be specific to the HAB or dead-zone event:
a. Stop fertilizer runoff from farms by promoting and b. Eliminate nutrient discharges from industry
establishing sound ecological agriculture practices as wastewaters, by minimizing waste and securing
follows: a proper wastewater treatment.
• Eliminate overuse of fertilizers and ensure that farmers
c. Secure collection and treatment of domestic wastes
use only the minimum amount necessary and in a non-
that remove nutrients, especially in high-populated
polluting way. If applicable in the specific country or
urban areas. Where water-borne infectious diseases
region, eliminate fertilizers subsidies, which promote
are the primary health concern, primary and secondary
the overuse and misuse of fertilizers, and implement
sewage treatment must be the highest priority, in order
strict, enforceable fertilizer reduction policies.
to make drinking water safe from human pathogens.
• Avoid any losses of fertilizers by improving timing and Where eutrophication and hypoxia in coastal waters
application techniques and applying the most efficient are growing environmental and economic concerns, the
plant nutrition practices. need for tertiary treatment must also be recognized, to
remove excess reactive nitrogen (UNEP and WHRC 2007).
• Promote addition of organic matter in cultivated soils,
as a way to reduce nitrogen losses and increase
d. Ban phosphorus-based products (e.g., detergents).
nutrient and water retention in the soil, and additionally
sequester carbon in the soils; for example, in apple
e. Move towards stopping the burning of fossil fuels,
orchards in the United States, organic practices
which contributes not only to climate change but also
reduced nitrate runoff from farm soils (Kramer et al.
to nutrient loading, by atmospheric deposition.
2006).
• Avoid bare soil. Studies show that the nitrate
concentration in runoff from a field planted with row
crops and left bare for some months a year is more
than 20 times as much as that from one that’s fully
covered year-round with plants—be they pasture
grasses or a succession of seasonal cover crops,
such as red clover and white rye (Raloff 2004).
20MITIGATION OPTIONS
2. Maximize natural nutrient retention by restoring vegetation along river courses, and on
estuaries and wetlands. This would reduce nutrient and sediment losses from land-based
activities (see more in Rabalais et al., 2007).
3. Fund research initiatives to understand the role of nutrients in HABs and dead zones and to
document the historical changes in nutrient loading. In many regions, the specific sources
of eutrophication and causes underlying HABs and dead zones are not well understood.
The preventing and mitigating of HABs needs a better Administration (NOAA), nitrate releases would have to be
knowledge base, using a quantification of nutrient inputs cut nearly in half from current amounts to significantly shrink
and modelling of future scenarios. For example, one of the the annual Gulf dead zone to a fourth of its current size
most important questions in mitigating a particular dead (a target set by the federal government in 2001: 5,000 km 2,
zone is how much cut in nutrient inputs in a watershed must from the current 20,000). But these cuts are not being realized
occur for its dead zone to shrink substantially. In the Gulf of and new market pressures, such as the growth in maize biofuel
Mexico, according to the National Oceanic and Atmospheric production, continue to increase nutrient loading in the Gulf.
21DEAD ZONES : HOW AGRICULTURAL FERTILIZERS KILL OUR RIVERS, LAKES AND OCEANS
References
6
Aherne, J., and S. A. Watmough. 2006. Calculating critical loads of acid Diaz, R. J., J. Nestlerode, and M. L. Diaz. 2004. A global perspective on
deposition for forest soils in Manitoba and Saskatchewan. Final report: the effects of eutrophication and hypoxia or aquatic biota. Pages 1–33 in
Data sources, critical loads, exceedance and limitations. Environmental 7th International Symposium on Fish Physiology, Toxicology and Water
and Resource Studies, Trent University, Peterborough, Ontario. Quality. US Environmental Protection Agency, Ecosystems Research Division,
Athens, Georgia, USA. EPA600/R-04/049, Tallinn, Estonia.
Baldia, S. F., M. C. G. Conaco, T. Nishijima, S. Imanishi, and K.-I. Harada.
2003. Microcystin production during algal bloom occurrence in Laguna Dodds, W. K. 2006. Nutrients and the “dead zone”: The link between
de Bay, the Philippines. Fisheries Science 69:110-116. nutrient ratios and dissolved oxygen in the northern Gulf of Mexico.
Frontiers in Ecology and the Environment 4:211-217.
Beman, J. M., K. R. Arrigo, and P. A. Matson. 2005. Agricultural runoff fuels
large phytoplankton blooms in vulnerable areas of the ocean. Nature Dumont, E., J. A. Harrison, C. Kroeze, E. J. Bakker, and S. P. Seitzinger.
434:211-214. 2005. Global distribution and sources of dissolved inorganic nitrogen export
to the coastal zone: Results from a spatially explicit, global model. Global
Bhat, S. R., and S. G. P. Matondkar. 2004. Algal blooms in the seas around Biogeochemical Cycles 19:GB4S02.
India-Networking for research and outreach. Current Science 87:1079-1083.
Environment Canada. 1999. The Canada-wide acid rain strategy for
Boggs, J. L., S. G. McNulty, M. J. Gavazzi, and J. M. Myers. 2005. Tree post-2000. Federal/Provincial/Territorial Ministers of Energy and
growth, foliar chemistry, and nitrogen cycling across a nitrogen deposition Environment, Halifax, Nova Scotia, October 19, 1998. Available at:
gradient in southern Appalachian deciduous forests. Canadian Journal http://www.ec.gc.ca/acidrain/strat/strat_e.htm.
of Forest Research 35:1901-1913.
Environment Canada. 2003. Submission to the Alberta Energy and Utilities
Bureau of Fisheries and Aquatic Resources. 2003. Basic information Board. Canadian Natural Resources Ltd. Horizon Oil Sands mine application
on red tide and harmful algal blooms (HABs). Department of Agriculture. 1273113. Sept. 2003.
http://www.bfar.da.gov.ph/infocorner/info_redtide.htm. Last accessed
28th March 2008. Fisheries and Oceans Canada. 2003. A scientific review of the potential
environmental effects of aquaculture in aquatic ecosystems. Volume 1.
Conservation Council of New Brunswick (CCNB). 2004. An eutrophication Far-field environmental effects of marine finfish aquaculture. (B. T. Hargrave.)
survey of bays in the Quoddy Region. Final 805 report to the New Brunswick Canadian Technical Report of Fisheries and Aquatic Sciences 2450: ix +
Environmental Trust Fund. 131 pp.
Chambers, P. A., M. Guy, E. S. Roberts, M. N. Charlton, R. Kent, C. Gagnon, Food and Agriculture Organization of the United Nations Statistical Database
and G. Grove. 2001. Nutrients and their impact on the Canadian (FAOStat). 2008. 2008 Sate of the world: Innovations for a sustainable
environment. Agriculture and Agri-Food Canada, Environment Canada, economy. Washington, DC: Worldwatch Institute.
Fisheries and Oceans Canada, Health Canada and Natural Resources
Canada. Glibert, P. M., J. Harrison, C. Heil, and S. Seitzinger. 2006. Escalating
worldwide use of urea—A global change contributing to coastal
Chantara, S., et. al. 2002. Relationship of amount of toxic blue-green algae eutrophication. Biogeochemistry 77:441-463.
to water quality in Mae Kuang Reservior, Chiang Mai.
http://www.scisoc.or.th/stt/28/web/content/Q_17/Q12.htm. Glibert, P. M., S. P. Seitzinger, C. Heil, J. M. Burkholder, M. W. Parrow,
Accessed July 25, 2007. L. A. Codispoti, and V. Kelly. 2005. The role of eutrophication in the global
proliferation of harmful algal blooms. New perspectives and new approaches.
Cheevaporn, V., and P. Menasveta. 2003. Water pollution and habitat Oceanography 18:198-209.
degradation in the Gulf of Thailand. Marine Pollution Bulletin 43:43-51.
Glennie, E. B., C. Littlejohn, A. Gendebien, A. Hayes, R. Palfrey, D. Sivil, and
Chu, Z., X. Jin, N. Iwami, and Y. Inamori. 2007. The effect of temperature K. Wright. 2002. Phosphates and alternative detergent builders—Final report.
on growth characteristics and competitions of Microcystis aeruginosa EU Environment Directorate.
and Oscillatoria mougeotii in a shallow, eutrophic lake simulator system.
Hydrobiologia 581:217. Goldburg, R.J., Elliot, M.S. and Naylor, R.L. 2001. Marine aquaculture in
the United States. Environmental impacts and policy options. Pew Oceans
Cortés-Altamirano, R., R. Alonso-Rodríguez, and A. Sierra Beltrán. 2006. Commission, Philadelphia, PA, USA. 44 pp.
Fish mortality associated with Chattonella marina and C. cf. ovata
(Raphidophyceae) blooms in Sinaloa (Mexico). Harmful Algae News 31:7-8. Government of Canada. 2008. Progress report on Canada-wide acid rain
strategy for post-2000 (Draft).
Dai, M., X. Guo, W. Zhai, L. Yuan, B. Wang, L. Wang, P. Cai, T. Tang,
and W.-J. Cai. 2006. Oxygen depletion in the upper reach of the Pearl River Government of Quebec, 2007. Plan d'intervention détaillé sur les algues
estuary during a winter drought. Marine Chemistry 102:159-169. bleu-vert 2007–2017.
http://www.mddep.gouv.qc.ca/eau/flrivlac/algues.htm.
Daijiworld.com. 2008. Mangalore: ‘Shellfish is an important source of cheap
protein.’ Report on international workshop, Safety of Shellfish from Harmful Gunter, A. 2005. Still striving to clean up the Baltic Sea. The Baltic Times,
Algae and Biotoxins. 25 Mar 2005.
http://www.daijiworld.com/news/archives_cat.asp?city=kar.
Guo, Q. G. 2007. Blue-green algae bloom in Dianchi Lake, the sixth largest
David Suzuki Foundation. 2008. Ocean pollution from salmon farming. freshwater lake in China. Water research and news, Rutgers University.
http://www.davidsuzuki.org/Oceans/Aquaculture/Salmon/Pollution.asp. http://waterresearch.blogspot.com/2007/06/bule-green-algae-bloom-in-
Last accessed March 28, 2008. dianchi-lake.html. Last accessed 28/03/2008.
Diaz R. J. 2001. Overview of hypoxia around the world. Journal of Howarth, R. W., A. Sharpley, and D. Walker. 2002. Sources of nutrient
Environmental Quality 30: 275-281. pollution to coastal waters in the United States: Implications for achieving
coastal water quality goals. Estuaries 25:656-676.
Huang, X. P., L. M. Huang, and W. Z. Yue. 2003. The characteristics
of nutrients and eutrophication in the Pearl River estuary, South China.
Marine Pollution Bulletin 47:30-36.
22You can also read