Investment Flow in the Artisanal Fishery Value Chain in Ghana Fjárfestingar í virðiskeðju smábátafiskveiða í Ghana - Hannah Antwi Supervisors: ...
←
→
Page content transcription
If your browser does not render page correctly, please read the page content below
Investment Flow in the Artisanal Fishery
 Value Chain in Ghana

 Fjárfestingar í virðiskeðju
 smábátafiskveiða í Ghana
 Hannah Antwi

 Final Thesis for MS-Degree in Environment and Natural Resources

 Supervisors:
 Professor Sveinn Agnarsson
 Dr Tumi Tomasson
Investment Flow in the Artisanal Fishery Value Chain in Ghana
 Fjárfestingar í virðiskeðju smábátafiskveiða í Ghana

 Hannah Antwi

60-credit thesis submitted in partial fulfilment of a Master of Science degree in
 Environment and Natural Resources

 Supervisors:
 Professor Sveinn Agnarsson
 Dr Tumi Tomasson

 Business Administration
 Faculty of Social Sciences at the University of Iceland
 School of Environment and Natural Resources
 University of Iceland. Reykjavik, 2021
Investment Flow in the Artisanal Fishery Value Chain in Ghana

This is a 60-credit thesis to obtain a MS degree in Environment and Natural Resources linked
to the School of Business Administration, from the School of Social Sciences at
 the University of Iceland.

© 2021 Antwi Hannah
this thesis can only be copied with the author’s permission.

Printed by: Prentsmiðja

Reykjavik, Iceland, 2021
ABSTRACT
The Ghana artisanal fishery sector continues to experience declining trends in catches and
high post-harvest losses because of overinvestment in fishing inputs and underinvestment
in value addition inputs, expressed as US$196,546,350 and US$ 4,849,204. The
overinvestment in fishing input is putting excessive pressure on the marine fisheries while
economic returns on the quantity of fish produced are minimal. The situation has forced
processors to rely on imported fish to sustain their livelihood. Yet, the Government of
Ghana contributes to the effort in the harvesting sector through subsidizing an estimated
US$48,920,565 of fishing inputs. Industrial trawlers add to the situation by illegally
catching 50,000 metric tons of small pelagics which is more than landings by artisanal
fishers in 2017. To better understand the drivers for investment, this study examines the
factors that determine investment among the actors in the artisanal value chain. Both
qualitative and quantitative data were collected from 90 fishery actors using
questionnaires. Three main actors were studied: canoe operators, fish mummies and fish
processors. Income generation to support household is the major factor that encourages
canoe operators to invest in bigger and additional canoes and illegal gear. Declining catch
volume and revenue encourages fish mummies to invest in fishing input whereas fish
processors invest in outdated capital goods because they lack capital for investment in
improved efficient technologies. Addressing the challenges in the artisanal sector will
require the government to enforce the law and redirect subsidies to the post-harvest sector
where value is added to the fish.

 3
Preface

This thesis is submitted for the degree of Master’s in Science at the University of Iceland.
The thesis focuses on addressing the challenges in the Ghana artisanal fishery value chain.
The research was conducted by Hannah Antwi under the supervision of Professor Sveinn
Agnarsson in the Department of Business Administration and Dr Tumi Tomasson, GRO-
Fisheries Training Programme (GRO-FTP) of Iceland. This thesis is a 60 ECTS and the
graduation date is February 2021.

This thesis was funded by the GRO Fisheries Training Programme (GRO-FTP) with
valuable support from CEWEFIA, USAID/SFMP, IAFI, University of Iceland and the
Ghana Ministry of Fisheries and Aquaculture.
In truth, I could not have reached this far without a strong support group. Firstly, my family
who supported me in prayers and love before and during the Covid-19 pandemic period.

Secondly, my supervisors, both providing patient advice. Thirdly, the fraternity of GRO-
FTP and CEWEFIA, who provided guidance throughout the research process.

Also, Ian Goulding of the International Association of Fish Inspectors for his great support
and advice. I also thank my mentors, Throstur Thorsteinsson and Mariana Lucia Tamayo
for their encouragement and support.
Finally, to Kristine Beran and Deborah Antwi for always standing by me through thick and
thin.
Thank you all for your unwavering support.

 4
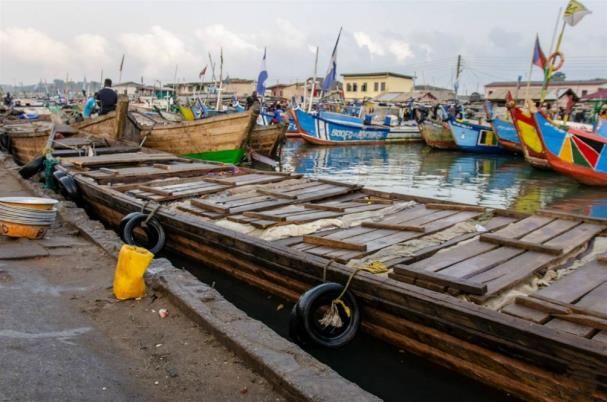
Table of Contents

List of Figures ................................................................................................................. 7
List of Tables................................................................................................................... 8
1 Introduction .............................................................................................................. 10
 1.1 Research goal .................................................................................................... 10
 1.1.1 Research questions ................................................................................ 10
 1.2 Thesis Structure ................................................................................................ 11
2 Overview of the Coastal Artisanal Fishery in Ghana .............................................. 12
 2.1 Impact of the industrial fishery on the artisanal sector ..................................... 14
 2.2 Overview of the Fisheries Management Policy: Focus on Artisanal Fishery... 14
 2.2.1 Implementation strategy ........................................................................ 15
 2.2.2 Policy Implementation Status ............................................................... 15
 2.3 The Artisanal Value Chain Actors and their Activities .................................... 16
 2.3.1 Canoe Operators ................................................................................... 17
 2.3.2 Fishers................................................................................................... 18
 2.3.3 Carriers (Porters) ................................................................................. 18
 2.3.4 Fish mummies ....................................................................................... 18
 2.3.5 Fish processors ..................................................................................... 19
 2.3.6 Drivers and mates ................................................................................. 19
 2.3.7 Lodging woman/middleman .................................................................. 19
 2.3.8 Wholesalers/ retailers ........................................................................... 20
 2.3.9 Consumers............................................................................................. 20
 2.4 Capital Goods Used for Fish Production in the Artisanal Value Chain ........... 20
 2.4.1 Gear 20
 2.4.2 Canoes................................................................................................... 24
 2.4.3 Generator .............................................................................................. 25
 2.4.4 Outboard Motors .................................................................................. 25
 2.4.5 Fuel Tanks ............................................................................................. 25
 2.4.6 Iceboxes ................................................................................................. 26
 2.4.7 Pans, baskets and buckets (seabags) .................................................... 26
 2.4.8 Smoking kilns ........................................................................................ 28
 2.4.9 Wooden Smoking Tray .......................................................................... 29
3 Theory ...................................................................................................................... 30
 3.1 Determinants of Capital Investment in the Fisheries Industry ......................... 31
 3.2 Impact of Capital Investment on Value Creation ............................................. 32
 3.3 Application of Net Present Value to Capital Investment Decision .................. 33
 3.4 The Net Present Value Model ........................................................................... 34
4 Methodology ............................................................................................................ 36
 5
4.1 Study Area ........................................................................................................ 36
 4.2 Sample population ............................................................................................ 36
 4.3 Data collection and Research Methods ............................................................. 37
 4.4 Data Analysis .................................................................................................... 37
5 Research Findings and Discussion........................................................................... 38
 5.1 Canoe Operators ............................................................................................... 38
 5.1.1 Sociodemographic data of canoe operators ......................................... 38
 5.1.2 Canoe operators’ investment ................................................................ 39
 5.1.3 Determinants of investment among canoe operators ............................ 42
 5.2 Fish mummies ................................................................................................... 44
 5.2.1 Sociodemographic data ........................................................................ 44
 5.2.2 Fish mummies investment ..................................................................... 45
 5.2.3 Determinants of investment among fish mummies ................................ 48
 5.3 Fish processors .................................................................................................. 49
 5.3.1 Sociodemographic information ............................................................. 49
 5.3.2 Fish processors investments ................................................................. 50
 5.3.3 Determinants of investment among fish processors.............................. 55
 5.4 Estimated investment in fishing and post-harvest capital goods ...................... 56
6 Concluding Discussion ............................................................................................ 53
7 Policy recommendation ........................................................................................... 56
8 References ................................................................................................................ 57
9 Appendices ............................................................................................................... 66

 6
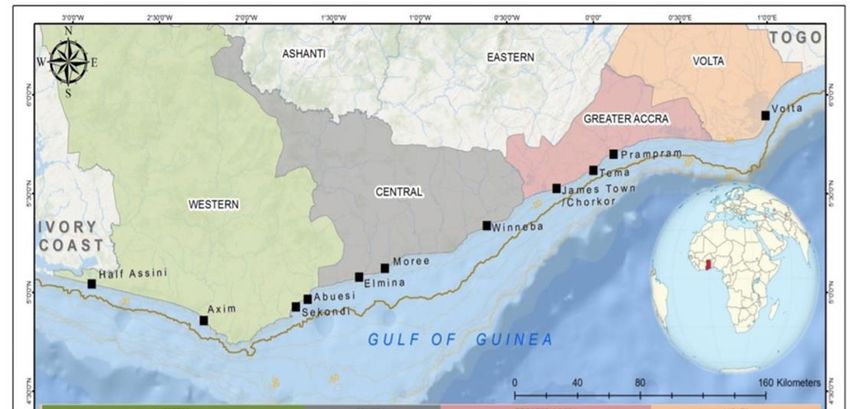
List of Figures

Figure 1: Coastline of Ghana and the regions where the artisanal fisheries sector
 operates (Asare et al., 2015) ................................................................................ 12
Figure 2: Annual average landings of small pellagic and effort in the artisanal
 coastal fisheries in Ghana (Lazar et al., 2018b) .................................................. 13
Figure 3: Artisanal supply chain actors, their activities, and roles (Overa, 1993) ......... 17
Figure 4: Large canoe used in the artisanal sector (Lomborg, 2020) ............................. 24
Figure 5: Service canoe (Aldred, 2019) ........................................................................... 24
Figure 6: Generators used for fishing in Ghana (Glover, 2017). .................................... 25
Figure 7: Icebox built into a fishing canoe (CEWEFIA, 2020)........................................ 26
Figure 8: Small pelagic measuring bucket (seabag) (CEWEFIA,2020) ......................... 27
Figure 9: Pans of different sizes used to measure the quantity of fish for sale
 (CEWEFIA, 2020) ................................................................................................ 27
Figure 10: Baskets for measuring fish (two baskets tied together) and a wooden
 tray for the display of fish in the market (CEWEFIA,2020) ................................. 28
Figure 11: Fish smoking tray (Kwarteng et al., 2016b) ................................................... 29

 7
List of Tables

Table 1: Summary of the attributes of the gear used in Ghana (Afoakwah et al.,
 2018; Aheto et al., 2012; Dovlo et al., 2016; Doyi, 1984; Koranteng,
 1995; Lazar et al., 2018a) .................................................................................... 23
Table 2: Sociodemographic information about canoe operators ..................................... 38
Table 3: Capital goods owned by canoe operators (number of respondents = 30) ......... 39
Table 4: Length distribution of the canoes (total number of canoes= 59) ....................... 40
Table 5: Sizes of engine used by the canoes (Number of engines = 57) .......................... 41
Table 6: Average quantity of fish caught by canoe operators per week in the
 bumper season (number of canoe operators=24) ................................................ 41
Table 7: Additional amount hook and line operators derived from the sale of a
 pan of fish using ice (average cost of ice per trip = US$ 8.60, Appendix 5). ...... 42
Table 8:Factors that encourage investment in effort-intensive capital goods
 among canoe operators ........................................................................................ 42
Table 9: Factors that prevent investment in value-addition capital goods
 (iceboxes, freezer and cold storage facilities) among canoe operators
 excluding the six hook and line operators ........................................................... 43
Table 10: Factors that encourage investment in iceboxes among hook and line
 operators (number of hook and line operators=6) .............................................. 43
Table 11:Summary of factors that prevent investment in gear with large mesh
 sizes among canoe operators ............................................................................... 43
Table 12: Sociodemographic information about fish mummies ....................................... 44
Table 13: Capital goods owned by fish mummies (number of respondents = 30) ........... 45
Table 14: The value of the capital goods deployed by fish mummies (total number
 of fish mummies= 30, Ghana Cedi to USD exchange value= 0.17) .................... 46
Table 15:Average quantity of fresh fish purchased by fish mummies per week
 during bumper season (number of fish mummies= 30)........................................ 47
Table 16: Quantity of fish lost to spoilage per week during the bumper season
 (Average quantity of fish purchased =18,706kg) ................................................. 48

 8
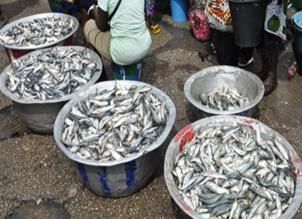
Table 17:Quantity of fish lost to breakage per week during the bumper season
 (Average quantity of fish purchased =18706kg) .................................................. 48
Table 18: Summary of factors that encourage investment in the fishing capital
 goods among fish mummies .................................................................................. 49
Table 19: Summary of factors that prevent the use of value-added (icebox) capital
 goods by fish mummies ......................................................................................... 49
Table 20: Sociodemographic information about fish processors ..................................... 49
Table 21: Capital goods owned by fish processors (number of respondents =30) .......... 51
Table 22: Common smoking kilns used by fish processors (sum of the smoking
 kilns=279) ............................................................................................................ 51
Table 23: Average quantity of fresh fish smoked by fish processors per week
 during bumper season (number of fish processors = 30) .................................... 52
Table 24: Quantity of fresh fish lost to spoilage by fish processors per week
 during the bumper season (Average quantity of fresh fish =6557kg) .................. 52
Table 25: Average quantity of fish left after dry smoking per week during bumper
 season by fish processors (Number of fish processors =30, conversion
 rate; 1kg fresh fish = 0.32kg dry smoked fish) ..................................................... 53
Table 26: Quantity of dry smoked fish lost to insect infestation by fish processors
 per week during the bumper season (Average quantity of dry smoked fish
 =2099kg) .............................................................................................................. 53
Table 27: Average quantity of fish lost to burning due to the smoking kilns used
 per week during bumper season (Average quantity of fish left after dry
 smoking =2099 kg) ............................................................................................... 54
Table 28: Smoking kilns that shrink and break fish per week during bumper
 season (Average quantity of fish left after dry smoking=2099 kg) ...................... 54
Table 29: Factors that encourage investment in outdated capital goods among fish
 processors ............................................................................................................. 55
Table 30:Factors that prevent investment in improved kilns (Ahotor and FTT)
 among fish processors .......................................................................................... 55
Table 31: Estimated capital investment in the artisanal sector in Ghana (GHS
 1.00 =US$ 0.17, FxchangeRate, December 18,2020) ......................................... 51

 9
1 Introduction
Small-scale fisheries worldwide are gradually being recognised for their contribution to
food security and alleviation of poverty (FAO, 2015). Nevertheless, value creation in
developing countries is low due to poor infrastructure, inadequate availability of capital
resources and inefficient and ineffective coordination in the value chain. Small-scale
producers in developing countries are at a disadvantage as they have limited capital to
invest, depend on family labour, rely on outdated techniques, and lack contact with
improved markets (De Janvry and Sadoulet, 2005; Daviron and Gibbon, 2002). The
methods and resources used for fish production in developing countries including Ghana
often have a negative environmental impact whilst value creation is very low (CRC, 2018:
Pemberton-Pigott et al., 2016)

 FAO (2015) advocates for “reductions of post-harvest loss and supports
investments in local, cost-efficient technologies and innovations that produce good quality
fish for both export and domestic markets responsibly and sustainably”. The United
Nations’ 2030 Agenda for Sustainable Development offers a transformative and integrated
approach to direct the world onto a sustainable and resilient path without leaving anyone
behind (United Nations General Assembly, 2015). It has become a global challenge to
sustain the fisheries resources while providing ample means of livelihoods and to reduce
post- harvest losses.

1.1 Research goal
This study aims to map investment flow in the artisanal value chain and how it impacts
value addition and development of the fisheries sector in Ghana.

1.1.1 Research questions
1. What are the prevailing capital goods in the artisanal sector?

2. What are the determinants of investment among the actors in the artisanal value
 chain?
3. How can challenges in the sector be addressed?

 10
1.2 Thesis Structure
In this thesis, chapter 1 gives the introduction and objectives of the study. In chapter 2 the
artisanal fishery is discussed, the impact of industrial activities on artisanal sector, the
artisanal management policy, the role of the actors in the value chain and the capital goods
used in the harvesting and post-harvest sectors are introduced and discussed. Chapter 3
discusses investment theory, the determinants of investment, the impact of investment on
value addition and the application of net present value model on capital investment in the
global context. Chapter 4 outlines the methodology used in conducting the research. In
chapter 5, the survey findings are presented and discussed. Conclusions are presented in
chapter 6 followed by policy recommendations in the final chapter 7.

 11
2 Overview of the Coastal Artisanal Fishery in Ghana
The artisanal sector operates across four coastal regions (Greater Accra, Central, Western
and Volta regions) within a total of 26 coastal metropolitans, municipal and district
assemblies (MMDAs) (Figure 1). There are 309 landing beaches in 189 fishing
communities within the MMDAs (FAO, 2016: MoFAD, 2015).

Figure 1: Coastline of Ghana and the regions where the artisanal fisheries sector
 operates (Asare et al., 2015)

 There are about 250,000 fishers and 500,000 individuals involved in fish processing
and distribution in the artisanal fisheries in Ghana in 2016 (FAO, 2016). The harvesting
part of the supply chain is primarily done by men whereas women dominate the post-
harvest part of the value chain (Asare, 2015). The artisanal fishers use motorized and non-
motorised vessels and harvest small pelagics (mackerel, sardine, and anchovy) which are
the major commercial species but are of low value. Other species targeted include white
grouper, tuna, and redfish, which are considered high-value fishes. The post-harvest actors
operate with rudimentary equipment to process and preserve the fish landed. An estimated
70-80% of all kinds of fish landed in the artisanal sector in Ghana are smoked. Other fish
are eaten fresh, except for a small portion which is fried, salted and dried (Aheto et al.,
2012; Gordon et al., 2011). Almost all the smoked fish is consumed locally but some is
marketed in neighbouring countries. High valued species are mostly exported to the
European Union and United State of America (Gordon et al., 2011; Nunoo et al., 2015).
 Since the 1980s the sector has been managed with a day closure per week, mesh
size restriction, subsidies and licensing (FAO, 2016; MoFAD, 2015). Approximately, 70%

 12
of the total marine capture fish supply in Ghana comes from the artisanal sector (FAO,
2016). Catches of small pelagics in the artisanal fisheries peaked at about 95,000 metric
tons in 1997, but were down to about 20,000 metric tons in 2015 whilst effort has continued
to increase (Figure 2) (Lazar et al., 2018b). The quality of the fish landed is generally poor
due to poor handling and lack of ice onboard vessels, leading to low profitability among
the actors (Pemberton-Pigott, 2016).

Figure 2: Annual average landings of small pellagic and effort in the artisanal coastal
 fisheries in Ghana (Lazar et al., 2018b)

 The decline in fish landings contributes to economic hardship, and as the population
in Ghana keeps rising, the demand for food and food products also keep increasing. There
is a growing demand for seafood among households, and local hotels and restaurants. To
close the gap, Ghana relies on imports of food products. In 2018, seafood and fish products
worth approximately $311 million were imported to supplement local supply (Ashitey,
2019). Imported fish are normally stored in cold storage facilities for further distribution
to processors at a wholesale or retail price. The storage of fish in cold storage facilities
reduces post-harvest losses at the importers' end but fish loss still remains a problem during
processing due to inadequate facilities (Ashitey, 2019). The importation of fish such as
sardinella and mackerel will continue to grow if the management system is not improved
(Failler et al., 2012).

 In 2015, the government of Ghana introduced a 5-year fisheries management
strategy to reduce fishing effort and rebuild the stocks to support socio-economic
development and food security. A scheme to certify hygiene and handling, labelling and
traceability was also adopted (MoFAD, 2015). In addition, the government spend
 13
approximately US$ 44 million to fuel subsidises and over US$ 4.5 million to subsidise
outboard engines annually (Tobey et al., 2016). The fish processors have been given access
to soft loans in order to adopt the certification scheme in 2019 (CRC, 2019).

2.1 Impact of the industrial fishery on the artisanal sector
 In 2014 there were144 vessels licensed to operate in the industrial sector including
107 trawlers, 20 tuna bait boats and 17 purse seiners (MoFAD, 2015). The trawlers target
demersal species like sparids and groupers, tuna bait-boats use pole and line and target skip
jack and yellowfin while the purse seiners target skipjack, yellowfin and bigeye tuna
(MoFAD, 2015). Approximately, 90% of the industrial trawl fleet are under Chinese
ownership but are fronted by Ghanaian companies who import the vessels and obtain
licenses to fish. This is illegal under the fisheries law passed in 2002 (EJF &Hen Mpoano,
2019).
 In recent years industrial trawlers have increasingly diverted attention from their
targeted species for which they were licenced, to commercially important species (sardine
and mackerel) targeted by artisanal fishers. In 2017 the industrial catch was estimated to
be 167,000 metric tons of which 100,000 metric tons are species considered illegal to be
caught by industrial trawlers (locally known as saiko). About half of the saiko is made up
of small pelagics which is more than what is landed by the artisanal small pelagic fisheries
in that year (Aheto et al., 2020: EJF & Hen Mpoano, 2019). The saiko fishing keeps
growing and a special service canoe has been designed to transport the fish from the
industrial fleets to shore. There are about 50 of these canoes operating in Apam, Mumform,
Elmina and Sekondi in the central and western regions of Ghana (Dovlo et al., 2016).

2.2 Overview of the Fisheries Management Policy: Focus on Artisanal Fishery
A fisheries management policy was developed in 2015 with consultative advice from
various stakeholders including fishers, fish processors, universities, and marine experts.
The policy aims to reducing effort in order to rebuild the fish stocks to support socio-
economic development and food security. The motivation for this policy was based on the
perception that open access and weak enforcement of the Fisheries Act are the fundamental
causes of the decline of fish stocks (MoFAD, 2015). The management policy for the small-
scale fishery in Ghana is broadly categorized under five key components, effort and fishing
capacity control, biology/stock assessment, marine habitat & biodiversity protection, post-
 14
harvest losses reduction, and social interventions and inter agency linkages (MoFAD,
2015).

2.2.1 Implementation strategy

A survey to identify and register canoes was to be done through engagement with all
stakeholder groups. Logbooks and at sea enforcement and port state measures were to be
implemented. Entry to the fishery was to be controlled by increasing license fees by 50%
and a moratorium set on new entrants to the fishery. Fishers were to be educated and trained
for alternative livelihoods and given financial and technical assistance to go into
aquaculture and other alternative livelihood. Co-management was to be done at the
community level through sensitizing fishermen on the fisheries regulations and encourage
voluntary co-management. Old canoes were to be replaced with new efficient vessels and
marine protected areas established for nursery and spawning. Failure to comply was to
result in the cancellation of the offenders' license. The traditional one day per week fishing
ban was to be increased to 2 days per week. Post-harvest losses were to be reduced through
minimisation of fish spoilage at sea through education and sensitization of fishers. Landing
facilities were also to be improved to increase food safety and hygiene. Social interventions
and inter- agency linkages were to be done through creation of women association of
community group processors and traders to national level. Micro-credit financial schemes
were to be provided to support their businesses. In addition, insurance and pension schemes
were to be provided to fishers as well as collaborate with key stakeholders such as
Environmental Protection Agencies, Oil companies and local government to minimise
negative trend in the ecosystem (MoFAD, 2015).

2.2.2 Policy Implementation Status

This section discuses the result of the policy implementation strategy. It is worth noting
that the current policy is silent about subsidies. However, fuel and engines are being
subsidized for artisanal fishers. In August 3, 2020 fisheries weekly news update indicated
that government has distributed 300 subsidized outboard engines to coastal fishermen in
the western region of Ghana. These 300 are said to be part of 1300 outboard engines
allocated to be distributed to fishermen at a subsidised price in Ghana. Following that,
September 28, 2020, the government presented 15 refrigerators, 150 pans, hand washing
equipment and cloth to fishmongers in Krachi East in the Oti region. In addition, the
Minister of Fisheries and Aquaculture Development announced to the fisher folks that
 15
5000 outboard engines have been procured and will be distributed across the fishing
communities to enhance productivity (USAID/GHANA SFMP, 2020).
 Considering the numerous policies to be implemented from 2015 to 2020, the
government has not been bold enough to reduce effort rather there is an increase in
industrial vessel licences and illegal, unreported and unregulated (IUU) fishing which
impact the small scale fishery in Ghana (Afoakwah et al., 2018: Cobbina, 2018). The
government of Ghana has failed to prevent the entry of new active canoes in the time frame
(World Bank, 2019). The artisanal fleet increased from 12,500 canoes in 2014 to over
13,650 in 2017 (Lazar et al., 2018a; World Bank, 2019). MoFAD has presented to
parliament a proposal for a 200 percent license fee increase, however, this awaits
parliament approval. A biological stock assessment has not been achieved due to lack of
reliable data (World Bank, 2019).
 The National Fish Processors and Traders Association (NAFPTA) was formed and
inaugurated in 2015 to support policy advocacy and research. Women dominate the
association which has contributed to creating awareness about the declining trend of
catches and increase in IUU fishing. Some of these women have refused to buy illegal
catches of juvenile fish for some time. Due to lack of government support the association
has not made much progress. Only twelve out of the 14,700 recognized fish processors in
Ghana have adopted the certification scheme (CRC, 2019). Alternative livelihoods
program has not been implemented even though there have been preparatory actions
(World Bank, 2019). There has been an increase in the use of illegal fishing methods, such
as light fishing, the use of monofilament nets and poisoning (Afoakwah et al., 2018)

 Conclusively, the government of Ghana has to date failed to reduce fishing effort.
Value addition remains minimal and economic returns from the sector keeps decreasing.

2.3 The Artisanal Value Chain Actors and their Activities
The Ghanaian artisanal value chain actors and their roles have received the attention of
researchers and practitioners over the years (Aheto et al., 2012; Entee, 2015b; Nunoo et
al., 2015; Odotei, 1991; Overa, 1993; Gordon et al., 2011; Quagrainie & Chu, 2019;
Samey, 2015; Tetteh, 2007; Torell et al., 2015). These studies show that the actors in the
Ghana artisanal value chain play different roles; even though some roles are minor. Yet,
each actor has a different interest which makes management of the sector a complex task.
The actors include canoe owners, fishers, fish mummies (standing/middle women),
carriers, family members, fish processors and traders (Figure 3). The chain of supply builds

 16
on the gender sharing of work tasks. The harvesting aspect is primarily done by men while
women control the post-harvest part of the value chain (Overa, 1993).

Figure 3: Artisanal supply chain actors, their activities, and roles (Overa, 1993)

2.3.1 Canoe Operators
Canoe operators can be broadly categorised as fish mummies and fishers due to the role
they play, yet men dominate. The canoe operators purchase the inputs (canoes, engines
and gear) for the fishing operation. They also employ fishers for the harvesting activities,
and some of them participate in the fishing (Gordon et al., 2011). The number of crew
employed per canoe ranges between 2 and 30 based on the size of the canoe (Tobey et al.,
2016). The medium and large canoes with a dimension of 2 and 3 metres width employ
20 to 30 crew while the smaller paddled canoes with a width of 1 metre, normally employ
2 to 4 crew. After each fishing trip, 50% of the revenues less the operational costs goes to
the crew and the canoe operator retains the rest (Gordon et al., 2011; Tobey et al., 2016).

 17
The most common gear used include purse seines, beach seines, hook and line, set nets and
drift nets, depending on the targeted species (Tobey et al., 2016).

2.3.2 Fishers
The fishers are the crew employed by the canoe operators. Fishing is traditionally carried
out by men. They typically fish daily except on Tuesdays which are observed as traditional
fishing holidays in most fishing communities (Gordon et al., 2011). A fishing trip takes
about 20 hours except for hook-and-line and drift net fishers who stay out for 3 to 4 days
and carry ice along for catch preservation (Gordon et al., 2011; Tobey et al., 2016). Fishers
fish typically during the bumper (upwelling) seasons. The major bumper season is from
July to September and the minor bumper season is February and March. During the bumper
season, 10-30% of catch get spoilt due to lack of usage of ice which makes the catch
downgraded to “stinky fermented fish” commonly referred to as “momone” in the Twi local
dialect in Ghana, with low market value (Gordon et al., 2011). The fishers’ fish little or not
at other times when catches do not cover fishing expenditure. However, in recent times
there has been an increase in illegal activities. Fishers use light to attract fish and nets with
tiny mesh sizes to catch even juveniles in reasonable quantity all year round (Afoakwah et
al., 2018: Dovlo et al., 2016; Gordon et al., 2011; Samey, 2015).

2.3.3 Carriers (Porters)
Carriers play a minor role in the value chain. They operate on a very small scale by helping
those with large operations to carry the fish from the canoe to the selling point as well as
the processing facility (Overa, 1993).

2.3.4 Fish mummies
Fish mummies are women with lucrative careers to the extent of owning a canoe and
houses. These women normally employ other women to process and trade for them. A fish
mummy plays a role as a wholesaler, large scale fish processor, canoe owner, market
trader, manager of fishing and creditor (Overa, 1993). Fish mummies are the financiers of
fishing trips, as such a proportion of the catch is handed to them to cover pre-financing
arrangements. Because they finance trips and own fishing equipment used by the fishers,
they control the supply chain (Torell et al., 2015). The head of the fish mummies in
consultation with the chief fisherman determines the price for the landed catch.
Notwithstanding, in the communities with improved landing facilities where landing fees
are charged, fishers are allowed to negotiate prices on an individual basis with fish
 18
mummies (Quagrainie & Chu, 2019). The fish mummies act as intermediaries between the
fishers and processors/consumers. Apart from the fish mummies pre-financing fishing
trips, they support fish processors by selling fish to them on credit depending on the
relationship between them (Gordon et al., 2011).

2.3.5 Fish processors
Fish processors add value to catch landed. Several methods are used to process the fish
including smoking, frying, salting, fermenting and sun-drying, but the most dominant
method is smoking (Entee, 2015b). Fish processing mostly takes place at the individual or
household level. Processing of fish is traditionally done by women in the coastal
communities. Basically, all species of fish caught in the country can be smoked and an
estimated 70-80 per cent are marketed locally by the processors (Samey, 2015). During the
lean season, fish processors buy cold storage fish and process or travel to other landing
sites where there is the availability of fish for purchase. Fish processors employ manual
labours to help in fish processing. The most commonly used processing kilns are the
Chorkor kilns which is easy to use, cheap to build, and fast in smoking, but produces fish
with high concentrations of polycyclic aromatic hydrocarbons (PAH) and consumes a lot
of fuelwood as compared with other kilns (Kwarteng et al., 2016b: Gordon et al., 2011;
Samey, 2015).

2.3.6 Drivers and mates
Processed fish are mostly transported to other districts and regions for sale and marketing.
Fish is normally transported using trucks, and these trucks are mostly operated by men
who are known as truck drivers and mates who help in loading and offloading of the fish.
Their work ends once fish is offloaded from the truck (Overa, 1993; Tetteh, 2007).

2.3.7 Lodging woman/middleman
Lodging woman and middleman provides accommodation for fish processors and traders
who have travelled from their community to the marketplace to sell fish but are not able to
return home on the same day. The main fish markets in Ghana are located inland, far from
the coastal communities where the fish is processed (Nunoo et al., 2015). The fish
processors who double as traders often require a cheap place to keep their items and a place
to sleep so the lodging women and middlemen who are mostly at the marketplace offer the
traders a place to sleep for a fee. The accommodation they offer does not necessarily belong
to them, thus they often act as caretakers of government facilities or private properties.
 19
They do not play any major role in the chain apart from the provision of accommodation
(Odotei, 1991; Overa, 1993; Tetteh, 2007)

2.3.8 Wholesalers/ retailers
Fish transported to the market is normally sold to wholesalers or retailers who then sell it
to the consumers. Even though fish processors transport the fish to the market, they do not
sell it directly to the consumers. There are mostly women who serve as intermediaries
(wholesalers and retailers) between consumers and fish processors. In some cases, the fish
is sold to wholesalers who then sell it on to retailers before it reaches the final consumer
(Overa, 1993; Gordon et al., 2011; Tetteh, 2007).

2.3.9 Consumers
The artisanal value chain ends once the fish reaches the final consumers where cash is paid
in exchange for the processed fish (Overa, 1993: Entee, 2015b).

2.4 Capital Goods Used for Fish Production in the Artisanal Value Chain

There are numerous capital goods deployed in fish production in Ghana. These can
be categorised into harvesting and post-harvest capital goods. The harvesting goods
include gear, canoes, engines, generators, and post-harvest capital goods include
pans, smoking kilns, smoking trays, vats for fermenting and drying racks (Gordon
et al. 2011). However, this section discusses the major capital goods used in both
parts of the artisanal value chain.

2.4.1 Gear

Various gear are used in the artisanal sector depending on the target species and the
size of the canoe (Table 1). Sardinella has been the most important species in the
artisanal sector and most gear are designed to catch it. The gear varies from one
fishing community to the other (Dovlo et al., 2016: Koranteng, 1995). Most gear are
made of synthetic materials and require frequent mending by fishers (Koranteng,
1995).

 The “Ali” a local name for a type of drift net was designed purposely to catch
Sardinella aurita. It is used mostly at night with engine powered canoe (Dovlo et al.,
2016: Doyi, 1984). The “Watsa” a local name for purse seine is a gear used to target
small schooling pelagics. However, it did not serve the purpose for which it was
 20
designed. It was further modified into a new seine net locally called “Poli-watsa”
(sieve purse seine). As the name implies, the Poli-watsa was designed to catch all
sizes of fish without focusing on value. Catches from these gears have low market
value (Aheto et al., 2012: Koranteng, 1995: Doyi, 1984).

 The monofilament gill net is recently introduced for fishing. Although it is
only allowed in freshwater fishing, it is used heavily in the marine sector to catch all
types of fish including juveniles. Fish caught by this type of net is low in value and
the use of the net is illegal in the marine waters of Ghana. The average mesh size is
0.5cm (Afoakwah et al., 2018: CRC, 2018: Lazar et al., 2018a).

 Setnet is a shallow net which is 230–350 m long with mesh size 50 mm. This
gear is used along aside paddle canoes (one-man canoes) to target clupeoids and
grunts (Doyi, 1984).

 Hook and line are used for both inshore and offshore fishing (Doyi, 1984).
Fishers stay out at sea for 2–4 days targeting demersal species such as groupers and
snappers. Due to their long duration on sea, ice is used to preserve the catch on sea.
Fish caught with this method have a high market value (Dovlo et al., 2016: Aheto et
al., 2012).

 Beach seine is another fishing gear used by artisanal fishers normally from shore.
The net is used to catch various small species such as anchovy (Dovlo et al., 2016: Doyi,
1984).

 21
Table 1: Summary of the attributes of the gear used in Ghana (Afoakwah et al., 2018; Aheto et al., 2012; Dovlo et al., 2016; Doyi, 1984;
 Koranteng, 1995; Lazar et al., 2018a)

 Gear
 Attributes Monofilament net Ali net Poli-watsa net Watsa net Hook& Line Beach Seine net

 Target species All kinds of small pelagic Sardine Sardine, anchovy All small Grouper, snapper and sparid Yellowtail sardine, anchovy
 pelagic
 species
 Length Varies 450- 650 m 450-540m 400-500m - 280-1800 m

 Mesh size 5 mm 45 mm 10-13 mm 50-60 mm - 18-22 mm

 Usage Use to catch all sizes of Used mostly at night Used when the Used when Uses bait placed on hooks Connected to a pair of drag ropes
 fish (juveniles) sardinellas are the sardinellas fixed to lines to catch fish to catch fish
 schooling are schooling

 Efficiency Haul large quantities of Haul large quantities of Haul large quantities Haul all kinds Catch small quantities of fish Haul various quantities of small
 juvenile fish sardine of sardines and of small fish
 anchovies pelagic
 species

 Duration of Mostly a day Mostly a day Mostly a day Mostly a day Two to four days Mostly a day
 fishing

 Market value Low Low Low Low High Low

 Use of Ice None None None None Uses ice for the operation None

 23
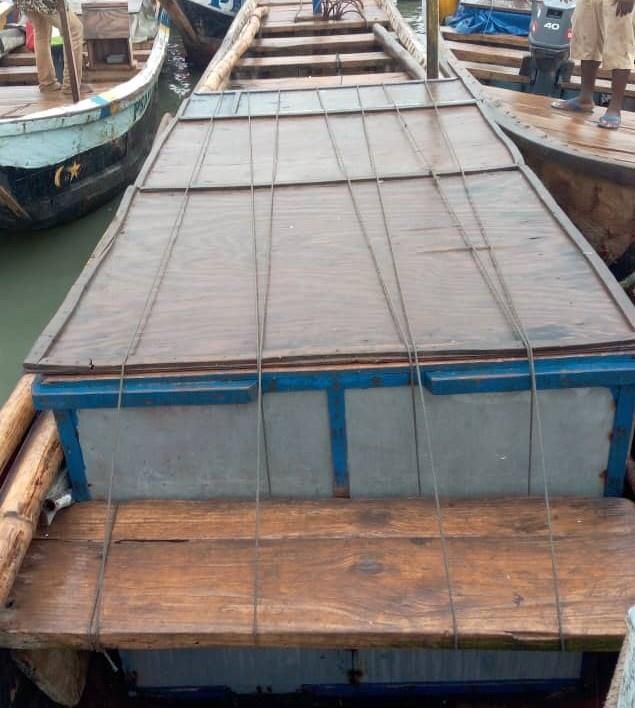
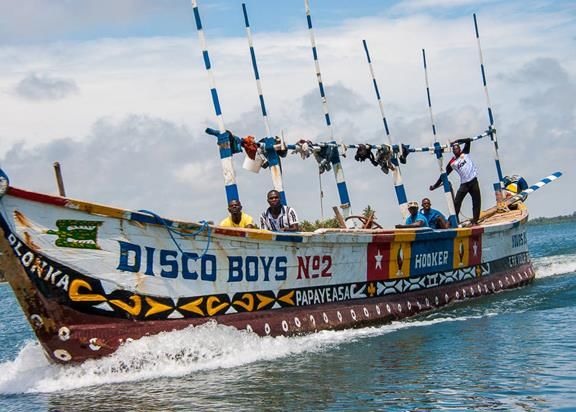
2.4.2 Canoes

There are different types of canoes used in the artisanal sector classified based on the length,
width and gear type used. They range from small (4-5 m long and 40-50 cm wide),
medium (6-11m long and 70-100 cm wide) and large (12-19 m long and 1.2 - 2.4 m
wide). The small canoes are propelled by paddles and the medium and large use outboard
engines. The small canoes use setnets whereas the large ones use hook and line, beach
seine, monofilament net “ali” “poli”, and “watsa” gear (Figure 4) (Dovlo et al.,2016:
Doyi, 1984).

Figure 4: Large canoe used in the artisanal sector (Lomborg, 2020)

 A recent canoe design is the service canoe (Figure 5). These are about 6- 18
m long and are not used specifically for fishing but rather to transport low value fish
from industrial trawlers to shore and sell to processors (Dovlo et al., 2016).

Figure 5: Service canoe (Aldred, 2019)

 24
2.4.3 Generator

Generators are used for fishing by light attraction. About 1000 Watts of bulbs are
connected to the generator. The bulbs are then set under the surface of the water. The
light attracts the fish, the net is then cast to catch the quantities attracted to the light.
This system catches all kinds of fish including juveniles and it is illegal (Figure 6)
(Afoakwah et al., 2018). The use of illegal gear is prevailing due to factors such as
poverty, depletion of fish stocks, weak law enforcement and increasing demand for
fish in the country (Afoakwah et al., 2018; Finegold et al., 2010).

Figure 6: Generators used for fishing in Ghana (Glover, 2017).

2.4.4 Outboard Motors

Outboard motors were first introduced in Ghana in 1959, alongside government
credit system to enable canoe operators to obtain them (Finegold et al., 2010). The
first engines were 25-30 hp and were used by the large canoes (Doyi 1984). However,
today the large canoes commonly use 40 hp motors. The introduction of the engine
has had a significant effect on catching power of the canoes and fishers’ behaviour.
The engines enable fishers to travel long distances offshore in following the fish
(Finegold et al., 2010). Until now, the government still subsidizes outboard motors
for canoe operators (USAID/GHANA SFMP, 2020).

2.4.5 Fuel Tanks

Most canoe operators use fuel tanks to store the fuel for fishing due to the unreliable
supply of fuel in the country (A. Nortey, personal communication, Sept 3, 2020)

 25
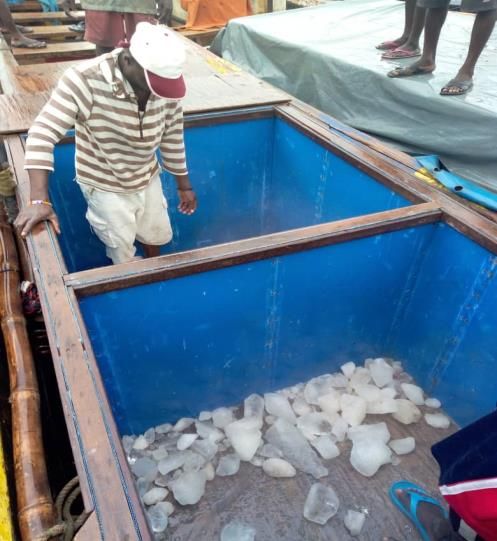
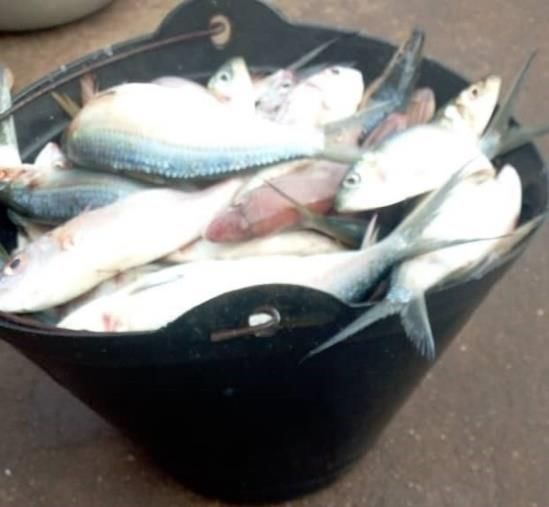
2.4.6 Iceboxes

Iceboxes are mostly used by the hook and line canoe operators to prevent fish from
spoilage because they spend a number of days at sea and target valuable fish species
(Figure 7) ( Aheto et al., 2012: Dovlo et al., 2016).

Figure 7: Icebox built into a fishing canoe (CEWEFIA, 2020)

2.4.7 Pans, baskets and buckets (seabags)

Pans, baskets and seabags (a local name for the common plastic bucket used by
fishers) are the major equipment for quantifying fish in the value chain (Dapaah &
Samey, 2015). The sea bags are used by the fishers to determine the quantity of fish
caught (Figure 8). The sea bags are of a standard size and hold on average 12.5 kg
of fish. Landed fish are first placed in the seabag, then transferred into the pans to
determine the price. Depending on the sizes of the fish, between 7-8 sea bags of fish
make one pan full. Therefore, the number of seabags of fish transferred into the pans
are used to determine the price per pan (A. Nortey, personal communication, Sept 3,
2020)

 26
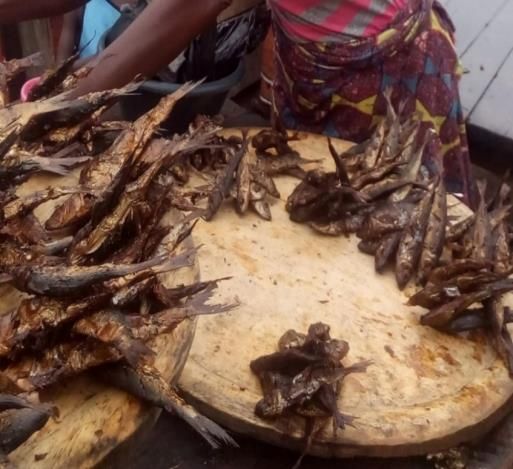
Figure 8: Small pelagic measuring bucket (seabag) (CEWEFIA,2020)

The pans are mostly used by fish mummies to measure the quantity of fish for sale.
They vary in sizes and price is determined per pan based on the number of seabags
of fish poured into it (Figure 9). Price of a pan varies; the average is GHS 300.00.
The estimated weight of a pan of fresh fish is 100 kilograms (A. Nortey, personal
communication, Sept 3, 2020).

Figure 9: Pans of different sizes used to measure the quantity of fish for sale (CEWEFIA,
 2020)

After dry smoking, the weight of one pan of fish is estimated to be 28 to 32 kg.
Baskets are used by the fish processors to package processed fish and price is
determined based on its quantity. An average quantity of fish per basket is 4 kg
(Figure 10) (A. Nortey, personal communication, Sept 3, 2020). In the local market,
the fish are scattered on a wooden tray where the price is allocated based on the

 27
number of fish gathered together (Figure 10) (Dapaah & Samey, 2015; Owusu-Adjei,
2011).

Figure 10: Baskets for measuring fish (two baskets tied together) and a wooden tray for
 the display of fish in the market (CEWEFIA,2020)

2.4.8 Smoking kilns

In Ghana, approximately 70-80% of all fish landed are smoked (Entee, 2015b).
Various smoking kilns have been introduced in Ghana such as Cylindrical, Chorkor,
Frismo, AWEP, Morrison, Ahotor and FAO-Thiaroye Technique (FTT) to smoke
fish. However, the dominating kiln is the “Chorkor” (Bomfeh et al., 2017; Kwarteng
et al., 2016a; Entee, 2015a; Pemberton-Pigott et al., 2016).

 The Chorkor trays hold about 300 kg of fresh fish, is easy to use, cheap to
build, and fast in smoking. Yet, it is associated with high Polycyclic Aromatic
Hydrocarbons (PAH) and consumes a lot of fuelwood as compared with other kilns
(Kwarteng et al., 2016a: Pemberton-Pigott et al., 2016). The PAH level in fish
smoked with Chorkor kiln is estimated to be 84 ug/kg, far above the European Union
(EU) standard of 12 ug/kg. This high PAH makes the fish unhealthy for human
consumption. The cost of constructing a Chorkor smoker is estimated to be GHS
400 (Owusu, 2019). Due to its low price as compared with the improved kilns, an
estimated 23,753 Chorkor kilns were in use in Ghana in 2013 (Samey, 2013).

 Ahotor and FTT kilns have recently been introduced to address the challenges
associated with the Chorkor kiln. The Ahotor kiln is comparatively fuel-efficient,
emits less smoke, is easy to use and produces less PAH than the Chorkor kiln. The

 28
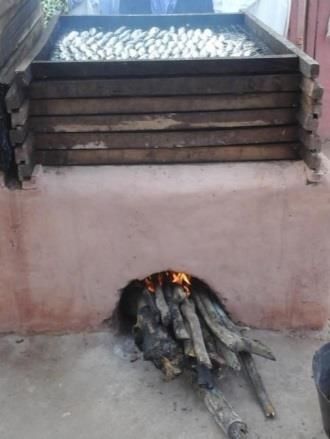
PAH level in fish smoked in the Ahotor oven is 10.9 µg/kg and the estimated
construction cost is GHS 1,768 for a double unit and GHS 903 for a single unit
without trays. The current challenges with the Ahotor oven are increased processing
time as compared with the Chorkor kiln and greater weight loss of the fish during
smoking which reduces the price at which it can be sold (Owusu, 2019).

 The FTT smoking oven was introduced in Ghana in 2014. This technology
meets the EU standard as the PAH is 12µg/kg (Bomfeh et.al, 2017; Kwarteng et.al,
2016a). Its smoking capacity is 200 kg, and although it is energy efficient, this is
offset by the low market value of the product in the traditional market. The main
challenge is its high cost of acquisition: estimated at GHS 4,000 (Pemberton-Pigott
et al., 2016: Owusu, 2019)

2.4.9 Wooden Smoking Tray

Trays are used to hold fish on the smoking kiln (Figure 11). Fish is arranged on trays
which are stacked in the kiln for smoking. During the smoking cycle, the trays are
rotated, where the upper trays are placed closer to the fire and the lower trays are
placed on top in sequential order. The process of rotating the fish is done two to four
times depending on the number of trays piled and the efficiency of the smoking kiln.
The tray is constructed based on the design of the kiln. Every smoking kiln has its
capacity, yet the Chorkor kiln has the highest capacity which holds about 10 to 12
trays for one cycle of smoking as compared with other smoking kilns (Entee, 2015a).
It is worth noting that every fish processor who owns a smoking kiln must have a
tray, however not everyone has it. Some processors hire or borrow trays from their
neighbours in order to process their fish due to their inability to afford both the kiln
and the trays (J. O. Addo, personal communication, November 15, 2020)

Figure 11: Fish smoking tray (Kwarteng et al., 2016b)
 29
3 Theory
Investment can be defined as a change in capital goods over time (Nøstbakken et al., 2011).
Investment contributes significantly to economic growth, helps to understand past and
future changes in an industry and market structure, yet, investment in firms, countries and
industries is poorly understood (Pindyck, 1991). This is partly linked to the limited success
in explaining and predicting changes in investment using econometric models and lack of
clear understanding of why there is variability in investment among industries or countries.
Existing models ignores the fact that investment expenditures are normally sunk costs
which are largely irreversible. Investment can be delayed providing an opportunity for
firms to acquire information about prices, costs and other market conditions before they
invest in resources. Firms ability to delay before investing in irreversible expenditure affect
investment decisions (Pindyck, 1991).

 The role of firms' investment dynamics in fisheries is increasingly being recognised
although empirical studies on capital changes and its drivers remain limited (Nøstbakken
et al., 2011) . Studies on changes in capital investment in fisheries have centred on two
alternative paths. While some focus on the determinants of optimal investment to achieve
desirable capital stocks level and assume that its management could be done by a sole
owner to benefit the society, others centre on incentives created through regulatory and
economic circumstances existing in the industries firms operate resulting in changes in
capital stock (Mesnil, 2008; Nøstbakken et al., 2011). From these studies, four distinct
types of capital have been identified for investment in marine fisheries: physical, human,
natural and immaterial. Physical capital is defined as the equipment and infrastructure
needed for the fishing operation. Natural capital is fish stock which is available to fishing
firms. Human capital is the labour input required to harvest and process the fish. The
immaterial is related to the right/licence to fish by fishing operators (Nøstbakken et al.,
2011).

 Past marine fisheries economic models suggest that in an open-access system,
changes in vessel numbers depend on fishery profitability (Gordon, 1954). A
representation of capital investment model in an open-access regime shows that entry and
exit in the fishery depend on economic incentive which is defined as an anticipated level
of returns associated with a given fishery and net of its opportunity cost (Smith, 1968).
Meanwhile, studies on developing fisheries show that capital goods continue to increase

 30
even after harvest has started to decline as a result of a decrease in fish biomass .The
increase in capital goods occurs due to partial substitutability between natural and physical
capital in the production chain. Also, the willingness of a fisher to exit from the fishery is
difficult due to limited diversified opportunities (Ikiara and Odink, 1999).

 Traditionally, most empirical investment analyses in the fisheries sector are done
at the vessel level which does not reflect the true picture of investment level as several
vessels operated in the fisheries sector can be owned by the same operator. In the artisanal
fishery, the operation may be carried out at household level contributing to broader
income-generating activities. Investment at the household level may be based on non-
fishing related factors. Firms which are vertically integrated are motivated by factors such
as processing (Nøstbakken et al., 2011).

3.1 Determinants of Capital Investment in the Fisheries Industry
Efforts applied in fishing is directed towards species that have economic value represented
by the consumer's willingness to pay a price to obtain it. This motivates fishers to develop
special fishing gear to target valuable species. The development of improved technologies
and increase in fishing fleet size and power is a result of fishers wish to increase fishing
profitability (FAO, 2008). Additionally, policies with financial considerations such as
subsidies, public-aids and tax exemptions are major contributing factors to the investment
decision. However, this could differ from one country to another influenced by short-term
and long-term considerations (Mesnil, 2008). An example of the influence of policies on
investment decision is based on a study carried out by Sumaila et al. (2008) which shows
that government normally assists the fishing sector in times when input cost of production
increases. The long-term impact of government assistance through for instance subsidies
leads to an increase in capital resources in many fisheries. Another empirical example of
the effect of policies on investment decision is the introduction of the ITQ system in
Icelandic fisheries. This policy has influenced the decision on the type of gears to invest in
to enhance fish value and profitability (Knútsson et al., 2016)

 Most small- scale fishers invest in all available resources (technologies, skill,
capital) that can increase harvest of fish as possible due to limited substitutability, poverty
and unemployment. Additionally, most small-scale fishers exist on a subsistence level and
have a short-term strategy to feed themselves and their households. Therefore, they have
high discount rate on resource use and focus more on food and profits in the short-term

 31
rather than a long-term continual flow of returns (Pomeroy, 1991). The post-harvest sector
of the small scale fishery investment is highly influenced by lack of improved technology,
poor infrastructure development and to some extent sociocultural dimensions of
vulnerability, lack of responsible governance, regulations and enforcement (Diei-Ouadi et
al., 2015).

Actions to direct investment to the right path require a holistic approach where all
stakeholders in the entire value chain are involved in decision making to select priority
areas of action to sustain the fisheries while minimising post-harvest losses (Diei-Ouadi et
al., 2015)

3.2 Impact of Capital Investment on Value Creation

The concept of creating value is directed through the supply chain (Haulihan, 1987). Porter
(1985) termed it as the value chain and Schonberger (1990) referred to it as the customer
chain. By definition, each of these terms refers to a set of activities carried out in
transforming inputs to outputs to obtain value out of the resource (Al-Mudimigh et al.,
2004). Value is created once supply chain activities are managed effectively by removing
various inefficiencies that affect outputs for consumers (Porter 1985). Yet, supply chains
do not capture consumer needs which brings discrepancies between what is needed and
what is produced. This pushes consumers to make a trade-off between what they receive
in terms of quality, worth and benefit, and what they sacrifice (price) to obtain such goods
and services (Al-Mudimigh et al., 2004).

 Authors like Barney (1991) and Grant (2009) have shown that value creation
depends heavily on resources such as capital equipment, process technology, building
facilities, labour skills, brand name, raw materials, finance and plant size. However, it is
worth mentioning that the tangible resources (machinery, plant, finance and human)
provide the ability to maximise productivity. Priem & Butler (2001) argued that the fact
that firms own and have invested in such resources does not guarantee the achievement of
value creation. A firm must gather, merge, exploit and manage the resources (Grant, 2009).
Kaplinsky (2000) suggested that the simple assembly and utilisation of the same resources
all the time can lead to falling of returns. One can achieve increased and/stable returns if
capital resources are upgraded to meet economic trends.

 32
You can also read