FIRST PORTRAYAL OF QUEBEC'S DIGITAL CREATIVITY INDUSTRY - Xn Québec
←
→
Page content transcription
If your browser does not render page correctly, please read the page content below
FIRST PORTRAYAL OF QUEBEC’S
DIGITAL CREATIVITY INDUSTRY

TABLE OF CONTENTS
Introduction............................................................................................................................. 8
  Mandate.................................................................................................................................. 8
  Partners................................................................................................................................... 9
  Study execution..................................................................................................................... 10
  Methodology...........................................................................................................................11
  Origin of respondents............................................................................................................. 12
Portrait.................................................................................................................................... 14
  Ten years ago: multimedia producers....................................................................................... 14
  Ten years later: a fragmented ecosystem................................................................................... 15
  Today: digital creativity sector.................................................................................................. 17
  Characteristics of Quebec’s industry......................................................................................... 20
     Young companies.................................................................................................................. 20
     Varied sectors of activities....................................................................................................... 22
     Funding sources................................................................................................................... 24
     Markets............................................................................................................................... 25
  Economic portrait................................................................................................................... 28
     Total revenue ............................................................................ ......................................... 28
     Profit margin........................................................................................................................ 29
     Number of employees............................................................................................................ 30
Economic impact of the industry in Quebec....................................................................... 31
International comparison: digital creativity in the world................................................... 37
  The concept of creative industries............................................................................................ 37
  Some national industries......................................................................................................... 39
     The United Kingdom, a champion of the creative economy............................................................. 39
     France: where gastronomy rubs shoulders with video games.......................................................... 40
     China: the new Cultural Revolution........................................................................................... 41
Needs, challenges and key issues........................................................................................ 44
  Workforce ............................................................................................................................. 44
  Recruitment and retention...................................................................................................... 45
  Training................................................................................................................................. 47
  Technical skills....................................................................................................................... 47
  Business skills........................................................................................................................ 47
  Financing.............................................................................................................................. 48
  Intellectual Property: A Multi-faceted Issue................................................................................ 50
Conclusion............................................................................................................................. 54

The opinions, findings, conclusions or recommendations expressed in this document are those of the
authors and do not necessarily reflect those of Export Quebec, the City of Montreal or the Canada Media
Fund. Export Québec, the City of Montréal and the Canada Media Fund are under no obligation to follow the
recommendations contained in this document.
This document was prepared by Yuani Fragata and Francis Gosselin from Groupe Sage and Danielle Desjardins
from La Fabrique de sens on behalf of Xn Québec (www.xnquebec.co).
FOREWORD

The aim of this study is to define the profile of a young and dynamic industrial
sector, whose emergence over the past thirty years has been marked by accelerated
growth in the last ten years.

The digital creativity sector is organized around the production - for commercial
purposes - of content and experiences using new technologies, the scope of which
has been amplified by the advent of the internet and the web. In short, it is the first
portrait of a complex sector operating within a complex ecosystem whose main
parameters are largely determined by major foreign transnational platforms.

Why “digital creativity”? Creativity is the raw material of the sector profiled here,
while digital - though it it has become a catch-all word that can designate as
many tools and means of communication as abstract concepts like revolution
and culture - is also essential for talking about everything that is part of the DNA
of the companies in our study, from technologies used, to production methods,
distribution and dissemination, content and products.

In this sector, technology, creativity, and culture are closely linked, much more
so than in any other cultural industry, where most of the processes, formats or
business models depicted here did not even exist ten years ago. As a result, the
activities and companies of this new sector and its multiple ramifications are not
compiled separately in the national statistics, but rather embedded by default in
various sectors and sub-sectors.

The more traditional cultural sectors, such as television and film production,
have benefited from strong government support which has historically helped
to standardize business models and facilitated the compilation of consolidated
data for these sectors. In the digital creativity sector, business models, business
practices and financing methods are diversified and often unprecedented.

                                                                                          3
In this context, this first portrait of Quebec’s digital creativity sector is a basic
profile, a snapshot of its current state that allows us to measure its vitality and to
define indicators for its future development.

                                                                                         4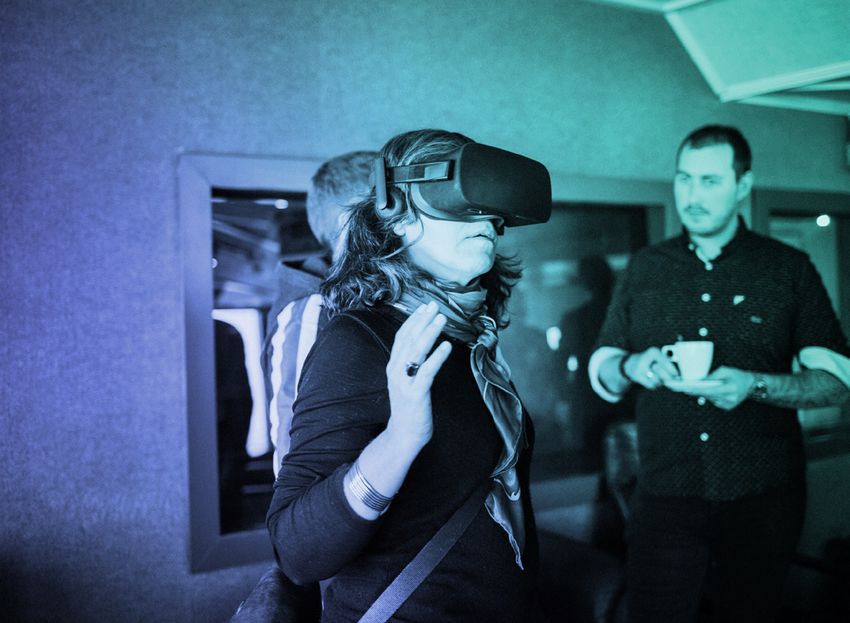
SUMMARY
Quebec’s digital creativity industry: sector engaged in commercial activities
that involve the production of content and experiences through computer
tools and digital technologies.

Xn Québec (the Digital Experiences Producers Association), whose mission is
to support the development, consolidation and outreach of digital creativity
companies, has partnered with Alliance numérique and Coop La Guilde to carry
out this study.

The mandate given: delineate the contours of the digital creativity industry, assess
its economic importance in Quebec and identify its main needs and issues.

To achieve this, the authors of the study solicited the participation of the 270
member businesses from these three associations. Sixty-seven of them agreed to
participate in a semi-structured interview. Respondents also received a link to an
anonymous online survey that focused on more sensitive elements, including the
financial dimension of their activities.

Based on the interviews conducted and the data collected through the anonymous
survey, the following portrait of companies in the sector can be drawn:

     • Digital creativity is a dynamic sector that contributes C$1.2 Billion to Quebec’s
       economy and is growing at an annual rate of more than 13%.
     • It consists of young companies with an average age of ten years, 20% of which
       are less than three years old.
     • As a skilled jobs sector, it contributes to the creation of tens of thousands of
       direct jobs, and employment growth in the sector is increasing by more than
       10% each year in Quebec.
     • It is a sector that depends on a variety of financing mechanisms, including
       public funds (subsidies and tax credits), but also self-financing through service
       activities.

                                                                                           5
• Half of the companies in the sector are small, with less than 10 employees.
     • Several companies operate according to a hybrid model between original
       production and service production: 38% have been self-financing.
     • 35% of them are involved in only one activity, primarily in the video gaming
       and corporate communications (video production, communications and
       marketing) sectors, while 22% maintain five or more activities.

The digital creativity sector has a strong growth:

     • Almost half of the companies had revenues of less than $ 500,000 in 2015,
       while today more than a third of them generate between $ 1M and $ 5M in
       annual billings.
     • The net profit margin reported by 42% of respondents exceeded 10% in
       2018 (compared with only 20% of firms reaching this level in 2015).
     • Beyond production intended for the local Quebec market, the main
       export markets are North America and Europe to a lesser extent. 39%
       of the companies surveyed are present in China. The markets outside
       Quebec that interest them
       most are North America and
       Europe. Among companies
       that are not present in China,
       less than 10% have expressed
       interest in this market.

In terms of the impact of the sector
on the Quebec economy, the latest
available data with a degree of
granularity relatively close to that
of our sample are those of the
“Interactive media” sub-category and
date from 2016.

                                                                                      6
According to Statistics Canada, this grouping of activities:

     • contributes $ 5.437 billion to the Canadian economy and $ 1.128 billion to the
       Quebec economy;
     • experienced a cumulative growth of 62% from 2010 to 2016, a figure that
       remains consistent with the growth rate of 10% per year reported by the
       companies that responded to our survey, which is almost double that of the
       audiovisual sector in which it is attached (+ 35%) and quadruple to the broader
       sector of culture (+ 17%) over this period.

Unsurprisingly, the main issue identified by respondents is workforce, especially
specialized labor. This challenge is expressed in terms of recruitment, retention
and training.

Several executives interviewed also mentioned that the search for funding was
complicated by the low level of understanding of the realities of the sector within
public and private organizations.

                                                                                         7
INTRODUCTION

Mandate
The digital creativity sector, which uses computer software and hardware to create
content and experiences, touches a wide variety of practices and forms and is
aimed at diverse audiences with different, and sometimes divergent, interests.

Digital technologies are at the heart of this sector’s business, and their extremely
rapid and unpredictable evolution regularly disrupts its environment, markets,
business models and infrastructure.

In this context, it has become urgent
to delineate the contours of the
digital creativity industry, to assess
its economic impact in Quebec and
to identify its main needs and issues.
This is the mandate that Xn Québec
(the Digital Experiences Producers
Association), whose mission is to
support the development, consolidation
and outreach of companies in the
digital creativity sector, gave to SAGE
Consulting and La Fabrique de sens.

In order to reach as many practitioners
as possible in a variety of fields, Xn
Québec has decided to join forces
with Alliance Numérique and Coop La
Guilde for this study.

                                                                                       8
Partners
Xn Québec (Digital Experiences Producers Association)

The Digital Experiences Producers Association, Xn Québec (formerly known as
RPM) brings together the main players in Quebec’s digital creativity industry,
representing more than 130 producers of original and commissioned content for
different technology platforms, various networking activities, conferences, clinics,
creative forums and international showcases, Xn Québec occupies a prominent
place in the Quebec digital creativity industry.

Alliance numérique

Since its creation in 2001, Alliance numérique has been the business network for
Québec’s new media and interactive digital content industry. The Alliance has more
than 100 active members in the video gaming and interactive digital entertainment
sector. It supports their development by offering them a wide range of services and
activities. It also multiplies the partnerships, the meetings and the exchanges on the
national and international scenes in order to favor the growth, the competitiveness
and the influence of the industry, in the respect of all its stakeholders. The Alliance
also acts as the industry’s primary point of contact with governments.

COOP La Guilde

The Independent Video Game Developers Guild of Quebec is the world largest
producer cooperative in the video games industry. In addition to developers, it
brings together creators and entrepreneurs from related fields in Quebec. Coop La
Guilde’s vision is to pool resources and services and to cultivate a fertile ground for
cooperation between developers of interactive technologies in order to strengthen
Quebec’s status as one of the world’s leaders in video games.

                                                                                          9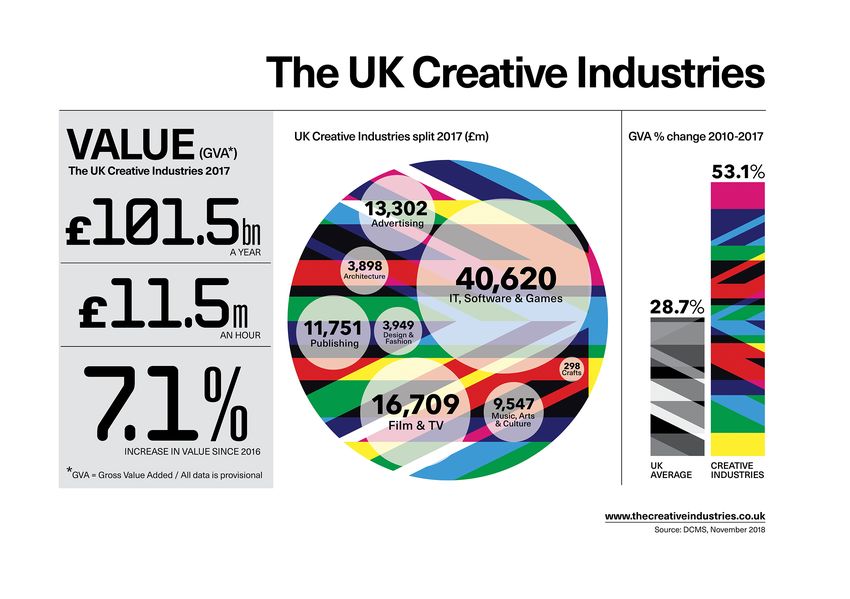
Study execution
Groupe SAGE

Groupe SAGE (formerly SAGE and FG8) works hand in hand with the leaders of some
of the most innovative and prestigious companies in the world since 1990. The firm
has developed a deep understanding of the role that strategy, innovation, change
management and leadership must play in redefining business models. Its economic
research department has earned mandates and led studies for the Canada Media
Fund, the Canadian Media Producers Association (CMPA) and numerous media
production companies. Its partners & researches have published countless articles
and white papers, including a review of Netflix’s economic dynamics & strategy.

La Fabrique de sens

La Fabrique de sens specializes in producing documents based on in-depth
research and rigorous analysis of proven facts and evidence. Thanks to its mastery
of strategic planning and monitoring processes and tools, La Fabrique de sens
offers an interpretation of the facts and trends and a decoding of the environmental
signals for its customers, who come mainly from the fields of culture and medias.
La Fabrique de sens has produced memoirs, articles, blog posts, reports and
studies for renowned organizations and institutions such as the ADISQ, the Canada
Media Fund, Télé-Québec, the CRTC and the Observatoire de la culture et des
communications du Québec.

                                                                                       10
Methodology
The authors conducted a consultation with members of the three partner
associations to produce this study. The sectors in which these companies operate
vary to a large degree. It includes producers of podcasts or linear content for
online markets (web series, web documentaries), creators of web portals or mobile
applications, companies that generate projections and assemble technical facilities
to support popular music concerts, video game studios, creators of interactive art
installations, interactive book designers.
The three partner associations in the study include 270 companies when duplicates
are eliminated, several firms being members of two or even three organizations.
Of those, 67 interviews were conducted. The interviews were conducted with
volunteer member companies from the associations mentioned above. Since
digital creativity activities do not have their own NAICS code, it is not possible to
know the total comprehensive population of the sector. Non-probability sampling
was therefore the only possible solution for this study
It is difficult t o a ccurately e stimate t he r epresentativeness o f s uch a s ample.
However, companies of various sizes and sub-domains were targeted for data
collection. With a response rate of 25%, we consider our sample representative of
the size of the three partner associations. In order to come up with useful economic
estimates, we have chosen to take these 270 companies as a proxy for the sector.
A proxy is a variable that is not significant in itself but acts as an unobservable or
non-measurable variable. As a result, the economic data published in this study
represent a minimum threshold for the size of the sector as a whole.
The interviews included seven qualitative and quantitative questions, with a num-
ber of sub-questions. The 67 participants were subsequently invited to respond
to an anonymous survey targeting sensitive topics (total revenue, profit
margin, payroll, employee status, growth data).
In order to link these results to the local and international context in which the
industry is evolving, a literature review of similar studies and specialized media arti-
cles has also been conducted.
11Origin of respondents
The interviews were conducted with the founders or senior executives of the
companies. The companies that answered the questions ranged from the very very
small start-up companies, to video game multinationals established in Quebec, to
small and medium-sized businesses in multiple domains and sizes. The interviews
were designed to document the industry sectors and the proportion of activities in
the sector as a whole.
The interview grid questions were grouped under six themes:
• Fields of activity Fig.1 : Origin of respondents
• Challenges
• Competition
• Growth factors and opportunities
• Funding 31%
• External support 53%
To determine the size of the sector and the scale of
the activities of the companies working in digital 16%
creativity, the following actions were undertaken:
a) Participants answered an anonymous survey
collecting more sensitive information such as: Xn Alliance Guilde
• total revenue,
• number of employees,
• level of activity,
• etc.
b) While economic research has been conducted to identify the number of
companies active in the Quebec digital creativity sector, it appears that the
disparity between the activities of the digital creativity sector and the codes
12used by institutions listing the Canadian industrial sectors has produced
inconclusive results;
c) A comparative assessment using the results of the survey, results of our secondary
research and the figures extracted from the interviews was carried out to give
indications as to the importance of the sector for the Quebec economy.
13PORTRAIT
Ten years ago:
multimedia producers
In 2009, Xn Québec’s previous instance, the Regroupement des producteurs
multimédia (RPM), commissioned a study on its industry. The research paper,
entitled “A full-fledged industry - The portrait of commissioned, convergent &
original multimedia production on new platforms in Quebec” presents a brief
history of multimedia production in Quebec that is relevant to reproduce here:
The production sector that we associate with multimedia has mainly developed over the last
fifteen years in Quebec. From the beginning of the 1990s, more or less interactive initiatives
appeared, integrating several media (text, sound, animated images). From there, a number
of further applications appeared, using CD-ROM or CD-i (Compact Disc Interactive of Philips)
supports. This multitude of applications included educational, edutainment, cultural content,
reference material, or others. (…)
Towards the end of this decade, while the dot-com bubble was as inflated as it would ever
be, Quebec had its own local companies like Netgraphe, Intellia, ZAQ, Branchez vous!, etc. At
the same time, in 1997, the installation of Ubisoft in Montreal set the stage for the electronic
gaming industry.
In the early 2000s, the commissioned audiovisual production sector lived through its own small digital
revolution. Starting from its roots in the industrial film sector dating back to the years 70-80, it evolved
towards corporate video in the 80s, and had to struggle to compete with the arrival of internet and its
unavoidable impact on corporate communication practices.
In terms of measures and public policies, a series of programs, some of which are still effective
today, were developed in this period. In the mid-1990s, the Government of Quebec created
the Information Highway Fund (IAF), set the foundation for the tax credit for the production of
multimedia titles and focused on the location of businesses in the ICT industry by announcing
the creation of the Cité du Multimédia in Montreal, the CDTI (Information Technology
Development Center) and the CNE (Center for the New Economy) in various locations in Quebec.
14Around this same time, the federal government made its first incursions into the sector by
creating a multimedia pilot program at Telefilm. On this basis, the Canada New Media Fund
was set and subsequently merged into the new Canada Media Fund (CMF) in April 2010. At
the federal level, under the auspices of the CRTC, specialized funds were created for the
production of interactive content related to broadcasting content, namely the Bell Fund and
the Quebecor Fund. 1
At the time, multimedia production was defined as the “production of original
media content with audiovisual segments and being used on a medium or in a
digital and potentially interactive environment.”
Ten years later:
a fragmented ecosystem
The 2009 study focused on web-centric production, including commissioned
production, convergence and original production. Video games were not taken
into account.
Ten years later, we cannot present a portrait of digital creativity without including
the video game industry.
Meanwhile, the economic landscape changed profoundly, and this transformation
is attributable, in large part, to a boom in this sector: in 2009, there were 48 video
game studios in Quebec while in 2017, there were 1982. It is also in 2009 that the
Canadian Television Fund and the Canada New Media Fund were merged into the
Canada Media Fund (CMF). The two funding streams of the new fund, the convergent
component (content for distribution on at least two platforms, including television),
and the experimental component (digital media content and interactive application
software) became effective in April 2010. In addition, alongside transnational giants
1. RADAR services médias, December 2009
2. Sources : Entertainment Software Association of Canada. 2009 Economic Impact Report
(online : https://bit.ly/2KQZEsN) and 2017 Economic Impact Report (online : https://bit.ly/2irw0w5)
15such as Ubisoft and Warner, there are a large number of independent studios (to
date, Coop La Guilde has 160 studios among its members).
It is to take this evolution into account that the members of three professional
associations — Alliance numérique, Coop La Guilde and Xn Québec — were invited
to participate in this study.
Members of these associations — companies as well as individual members – all
engage in commercial activities involving the production of content and experiences
through computer tools and digital technologies.
This is the definition we suggest to designate the industrial sector analyzed in
this study.
Digital content is now embracing a wide
variety of forms and increasingly breaks Digital creativity
off from conventional distribution Sector engaged in commercial
platforms and channels. After being activities that involve the production
dematerialized, content is transformed of content and experiences
through computer tools and digital
into collective experiences and
technologies.
deployed in public spaces. Companies
such as Moment Factory in Montreal,
Noctura in Quebec City, or Ingrid Ingrid, all create, at their own level, immersive
and interactive experiences in public environments and new narrative experiences
in physical space.
The digital creativity industry also includes eclectic companies like Urbania, a
content agency that makes both traditional TV production, branded content,
original web creation and webcasting.
The boundaries between different sectors are disappearing and circumscribing the
profile and scale of the industry is becoming a complex task. Its territory cuts across
traditional sectors including, among others, information and communication
technologies, broadcasting, audiovisual production and cultural industries.
16Today: digital creativity sector
A complex industrial fabric
As pointed out in the sectoral diagnosis of the ICT workforce by
TECHNOCompétences, the Sector Committee for ICT Workforce, it is “increasingly
difficult to establish an effective sectoral cohesion. Some industrial and market
niches tend to create their own ecosystem. In this context, the most publicized
examples — digital creation and artificial intelligence — contribute to “create
confusion in an already complex whole.3”
In a study on creative industries published in November 2018 by the Chamber
of Commerce of Metropolitan Montreal (CCMM), authors define digital creativity
as follows:
(...) companies and support organizations that revolve around digital creative centers. Although
digital is used to varying degrees in all creative sectors (whether for production, marketing
or distribution), it is for some fields the raw material present at all stages of the production
and distribution chain. The industries that make up the subset of “digital creativity” include:
video games; visual effects and animation; virtual and augmented reality; and immersive and
interactive environments. 4
Representative companies from the video game industry, virtual and augmented
reality, and immersive and interactive environments participated in our study. We
also sampled companies that produce different content for the web and mobile
media (web series, web documentaries, applications). We excluded the visual effects
sector from our study as it does not — in the current context — properly act as an
intellectual property-creating industry.
Despite this exclusion from our sample, the VFX contributes directly to the dynamism
and excellence of the Québec digital creation ecosystem. It participates by creating
3. TECHNOCompétences. Diagnostic sectoriel de la main-d’oeuvre dans le secteur des technologies de
l’information et des communications (TIC) au Québec 2018. Online : https://bit.ly/2MbqGvo
4. Chambre de commerce du Montréal métropolitain (CCMM). Industries créatives : réussir dans un
environnement en mutation rapide. Online : https://bit.ly/2KOXObN
17many jobs, taking part in the training and continuous development of the workforce
in the sector, in addition to getting international recognition thanks to the excellence
of its main players.
Characteristics
We chose to describe the object of this study under the name “digital creativity
sector”.
In order to come to this denomination, we aggregated the various meanings and
definitions adopted around the terms “creative industry” and “cultural industry”. In
conclusion, the UNESCO definition seemed most appropriate.
The UNESCO defines cultural and creative industries as “business sectors whose
principal object is the creation, development, production, reproduction, promotion,
dissemination or marketing of goods, services and activities which have a cultural,
artistic and/or heritage content.”
According to this organization, the main characteristics of these industries are:
• The intersection between economy and culture;
• Creativity at the heart of the activity;
• Artistic, cultural or inspired content from the creation of the past;
• Production of goods and services frequently protected by
intellectual property — copyright5 and related rights6;
• The dual nature: economic (wealth generation and employment) and
cultural (generation of values, meaning and identity) ;
• Innovation and creative renewal;
• Demand and public behavior difficult to anticipate;
5. Copyright refers to all the rights available to the creator on his original works. The holder of these rights is
generally the author of the work.
6. Related rights are moral and economic rights granted to artists (generally performers) in order to protect
their performance. These are rights related to copyright that protect persons who are not authors and
who, as such, are not entitled to exercise copyright.
18• A sector marked by the non-systematization of wage labor as a method of
remuneration for work and the predominance of micro-enterprises.7
Most of these characteristics are found in the industrial fabric that is the subject of
this study:
• Economy and culture interacts, and this is particularly true for the video
game industry, which is made up of billion-dollar companies and small
startups, where technology and artistic creation intersect, but also for the
interactive digital installations sector, which sits on the fence , being both
an artistic enterprise (performing arts) and an industrial enterprise based
on cutting-edge digital technologies.
• Intellectual property is an essential element in the activities of most of the
companies that participated in the study. The development and valuation
of these companies are among the most important issues facing the
industry.
• Its commercial activities also bear, to varying degrees, values and cultural
identity. These may take the form of promotional activities that necessarily
refer to a system of values, or video games that — in France at least — are
recognized as an element of national heritage in the same way that films
or books are. For instance, they have been subject to legal deposit at the
National Library of France since 1992.
• If innovation and creative renewal are assets for any company that wants
to ensure its sustainability, these are elements inscribed in the DNA of
companies in our study. They must navigate a complex industrial context,
in rapid and constant evolution, at the pace of accelerated transformations,
both in terms of market and consumer behavior.
• In fact, because of the innovative nature of their activities and offerings,
it is difficult for digital creativity companies to predict public behavior.
For this reason, investments carry a high level of risk that private sector
funding agencies are reluctant to run.
7. UNESCO. « Qu’entend-on par industries culturelles et créatives ? » En ligne : https://bit.ly/2dponUV
19• The wage system is not the systematic mode of remuneration for digital
creativity companies that rely heavily on freelance services. This practice is
inherent in the way businesses operate by project.
Characteristics of
Quebec’s industry
Young companies
The members of the three associations turn out to be quite young. Figure 2 shows
that 60% of firms have been created since 2010 and 19% of firms were launched in
the last three years.
The digital creativity industry is therefore a very young industry, which is
undoubtedly a direct consequence of the opportunities created by new digital
technologies in recent decades. The strong growth rates of the sector have also
favored the entry of new players.
Regional distribution of companies
Regarding the regional representation, 80%
of the firms sampled have offices in Montreal Fig.2 : Companies by year of establishment
only, while 11% of them have offices in other
Quebec regions only. The remaining 9% have
offices in Montreal and in other cities. For
8% < 2000
half of these latter cases, secondary offices 19% 2000-2005
are in Quebec City, while others prefer 14% 2005-2010
metropolises elsewhere in Canada, the 41% 2010-2015
19% 2015-2018
United States or Europe.
Based on discussions with executives from
firms with subsidiaries outside the major
centers, we find that regional companies tend
20to carry out their commercial activities abroad more than in the local Quebec
market, and tend to do more business development abroad. Some say that they
come to Montreal or Quebec City almost exclusively to fly abroad.
It can therefore be presumed that several activities taking place outside of Montreal
and Quebec City are not documented due to the fact that these companies are
not members of the organizations representing the industry, and do not maintain
intensive commercial links with the local ecosystem.
This dominance of the greater Montreal area in the sector is also highlighted in the
2018 sectoral diagnosis of the workforce in the information and communication
technologies (ICT) sector produced by TECHNOCompétences. According to their
compilation of Statistics Canada data, the greater Montreal area, which is home
to major centers in video games, virtual reality, animation and digital
creation, employs 75% of ICT workers in Quebec. The Quebec City Region
accounts for 8.8% of Quebec’s ICT jobs.8
8. TECHNOCompétences. Diagnostic sectoriel 2018 de la main-d’oeuvre dans le secteur des technologies de
l’information et des communications (TIC) au Québec. Online : https://bit.ly/2MbqGvo
21Varied sectors of activities
Figure 3 illustrates the industry activity sectors. The results were obtained by
asking respondents the percentage of their individual activities in the sectors
mentioned. 9
For example, a firm claiming to deploy 60% of its production capacity making
digital installations and 40% to offer its services for third-party projects
contributed 0.6 points to the “installation” category and 0.4 points to the category
“related services”.
Fig.3 : Detailed industry activity sectors (>1%)
VIDEO GAMES 36,4%
REL ATED SERVICES 10,6%
COMMUNICATIONS & MARKETING 6,5%
INSTALL ATION 4,8%
CONVERGENCE PRODUCTION 4,5%
CORPORATE VIDEO PRODUCTION 4,5%
VIRTUAL / AUGMENTED REALIT Y / OTHER 3,9%
DIGITAL ARTS 3,8%
EDUCATIONAL GAMES & YOUTH CONTENT 3,5%
MOBILE APPLICATIONS 2,6%
TRAINING (E-LEARNING) 2,4%
WEB DOCUMENTARIES 2,0%
INTERACTIVE BOOK 1,6%
CINEMA PRODUCTION 1,4%
TELEVISION PRODUCTION 1,3%
WEBSERIES 1,0%
We thus obtain a distribution which shows a strong concentration in the video game
industry. This percentage (36%) is related to the high proportion of respondents who
are members of Coop La Guilde and Alliance numérique (47% of respondents).
It should also be noted that while a large proportion of respondents provide related
services (services for a third-party), this represents only 11% of total sector activity.
9. Convergence production is digital content related to and complementary to a television production.
22Number of business sectors
Figure 4 shows the large quadrants in terms of the number of business sectors.
It should be noted that 35% of the companies manage to specialize in one
sector, mainly in the video game and corporate communications sectors (video
production, communications and marketing).
In the same vein, 29% of companies have only one second sector of activity,
often by offering services that exploit their surplus production capacity to third
parties. It should also be noted that 22% of companies have gone the route of
diversification, by choice or necessity, by maintaining five or more activities. One
of the companies interviewed
was active in 11 industries. Fig.4 : Number of business sectors
We did not observe any
relationship between the size
of firms and the number of
activities they carry out.
35% 1
29% 2
9% 3
5% 4
22% 5 & more
23Funding sources
Figure 5 illustrates the extent to which firms used different types of financing.
Fig.5 : Funding sources
SUBSIDIES 47%
TA X CREDITS 44%
SELF-FINANCED 38%
LOANS 36%
LOVE MONE Y 28%
ANGEL INVESTORS 17%
VENTURE CAPITAL 11%
CROWDFUNDING 5%
Nearly half of digital creativity firms (47%) used subsidy programs and a nearly
similar proportion benefited from a tax credit program (44%). 28% of the firms
appealed to family and friends (love money) to raise the necessary capital for
start-up or growth.
Regarding funding from angel investors, it should be noted that this category included
instances where founders lent to the company and repaid themselves over a short
period of time, thus adopting angel investor behavior. Otherwise, the proportion that
benefited from investments from angel investors proper is closer to the proportion
that benefited from venture capital, around 10%.
24If the proportion of funding from venture capital or angel investors is minimal, it is
likely because most firms in the industry are growing rapidly, but not explosively.
Angels and venture capitalists (VCs) are looking for companies that will grow quickly,
a hundred times their size (100X). Smaller growth firms are generally less attractive
to them.
Crowdfunding is a mechanism that is almost exclusively used by small video game
studios to test interest in a project and raise seed money. As such, it operates as a
marketing and funding mechanism.
Finally, 38% of the firms financed themselves through their own business activities
or the profits of an associated company. This hybridization is indicative of a reality
experienced by several companies: service activities for other companies serve as
a basis from which the original productions will be developed. According to some
stakeholders, this situation is rooted in the financing issues of original productions.
For example, a few respondents mentioned that they would like to work solely on the
development of their IP, but that as long as their cash flows would not allow it, they
would continue to focus on secondary activities.
Markets
Figure 6 illustrates the markets in which the surveyed businesses conduct their
economic activities. The percentage indicates the proportion of firms operating in
each relevant market.
Fig.6 : Companies’ markets
QUEBEC 88%
CANADA 75%
UNITED STATES & MEXICO 61%
EUROPE 55%
CENTRAL / SOUTH AMERICA 44%
OCEANIA 39%
CHINA 39%
ASIA (OTHER THAN CHINA) 38%
AFRICA & MIDDLE-EAST 34%
25There is a strong trend: the concentration of export activities in the markets of North
America and Europe. This trend is also reported by the Entertainment Software
Association of Canada. According to its report Economic Impact Report 201710, 75%
of the revenues of the Canadian video game industry come from exports, with 46%
of these revenues coming from the US and 42% from Europe.
Fig.7 : Markets of interest
88%
Quebec 94%
6%
Canada 75%
(other than 94%
Quebec) 19%
61%
United States 82%
& Mexico 21%
55%
Europe 70%
15%
44%
Central / 47%
South America 3%
39%
Oceania 43%
4%
39%
China 47%
7%
38%
Asia 45%
(other than China) 8%
CURRENTLY ACTIVE IN THE MARKET
34%
Africa & INTENT TO ENTER/REMAIN IN THE MARKET
41%
Middle-East 7% ▲
Figure 7 illustrates respondents’ current geographic areas of business
activity (yellow) and areas where companies wish to offer their products or
services in the future (black).
10. Entertainment Software Association of Canada. Canada’s Video Game Industry 2017.
Online : https://bit.ly/2Ed9z8Z
26In gray we calculated the difference between the desire to be active or to remain
active in a market and the current markets. This differential can be understood
as future interest for a particular market among respondents. Thus, although the
Chinese market is part of many conversations in the business environment, it
appears, from the results, that those wishing to be there already are, and that the
appetite for this market in others is pretty weak.
It can be understood from this indicator that the expansion markets of interest
to the most respondents are North America (21% of members) and Canada
(19%), followed by Europe (15%). It should be noted that some members
indicated that although the Mexican market is part of NAFTA, the per-capita
GDP of the country makes it a less attractive market for more expensive
products and is therefore not as interesting as the United States11. However, at
the technological and creative levels, Mexico seems to be appreciated and at
the same level as Quebec, making it an interesting market for partnerships or
commissioning of certain activities.
The fact that companies in our sample favor future growth strategies focused on
the Canadian, North American and European markets can probably be attributed
to their proximity. The cultural, administrative, geographical and economic
distances being reduced between these markets
and the Quebec market, and legislative frameworks,
linguistic bases and similar cultural norms, naturally
makes business environments easier to penetrate
and decipher than other proposed markets.12
11. GDP per capita: United States: $59k; Canada: $46k; Mexico: $18k (World Bank, 2017).
12. According to Pankaj Ghemawat’s CAGE model, cultural, administrative, geographical and economical
distances between two countries - i.e. the degree of distance between these parameters - have an impact
on the ease of doing business there and, therefore, on the development of internationalization strategies.
27Economic portrait
Total revenue
While just over half of the companies were making less than $ 500K in 2015,
today just over one-third generates a total revenue between $ 1M and 5M. This
$ 1-5 million segment of sales had the largest growth in three years, from 21%
of businesses surveyed in 2015 to 36% in 2018.
Fig.8 : Companies’ annual total revenue ( 2015, 2018 )
27%
< 100K
19%
27%
100K - 500K
22%
12%
500K - 1M
8%
21%
1M - 5M
36%
3%
5M - 10M
6%
3%
10M - 20M
3%
6%
20M - 50M
0%
0%
> 50M
6%
The growth rates of firms’ total revenue vary enormously, but it is possible to
release an average of about 10-20% annual growth. That’s more than the growth
of the payroll (about 8% per year). Considering that the profit margins are quite low,
which is normal for a fast-growing industry where the majority of the profits are
reinvested, this indicates that firms invest a little less than 50% of their surplus in
human capital.
28The other half would be, in all probability, redirected to tangible assets such as
infrastructure and equipment, debt repayments or dividends.
Profit margin
The profit margins of the majority of firms in the sector were very low in 2015.
This is consistent with the financial situation of fast-growing companies whose
net revenues are reinvested into the firm to finance this growth.
Note, however, that the situation has improved in the last three years, with 42%
of the firms surveyed saying that they had a net profit margin of 10% or more in
2018, whereas this was the case for only 20% of firms in 2015.
Fig.9 : Companies’ net profit margin ( 2015, 2018 ) Fig.10 : Net profit margin
(2015, 2018)
57%
< 10%
20% 42% 10% <
33%
17%
15%
12% 12%
9% 9%
7% 7%
6%
3% 3% 3% 3% 3%
80% 58%
0-2% 3-5% 5-10% 10-15% 15-20% 20-25% 25-30% over > 30% 2015 2018
29Number of employees
Digital creativity is a sector dominated by small businesses, with 50% of firms employing
less than 10 people. This said, growth appears through a significant shrinking of this
number since 2015, when 61% of firms had less than 10 employees. As Figure 11 below
shows, many of these firms have graduated to a higher number of employees, with the
firms totaling 25-50 employees growing from 6% in 2015 to a fifth of our sample in 2018.
90% of the companies surveyed use freelancers. Between 2015 and 2018, the number of
freelancers employed by these firms also increased by 66%. The average budget of firms
dedicated to hiring freelancers increased by 20% while their payroll increased by 25% for
the same period.
Fig.11 : Number of employees by business size ( 2015, 2018 )
61%
< 10
51%
24%
10 - 25
20%
6%
25 - 50
20%
0%
50 - 100
3%
6%
100 - 250
6%
3%
250 - 500
0%
0%
500 -1000
0%
0%
> 1000
3%
30ECONOMIC IMPACT OF
THE INDUSTRY IN QUEBEC
As discussed above, it is difficult to accurately define the size of the digital creativity
sector and its precise economic footprint as its activities and businesses are not
separately identified in the System of National Economic Accounts of Canada
(SCENC). Moreover, many “out-of-sample” organizations (traditional multimedia
producers, telecom companies, software publishers) are engaged in digital creation
activities without being able to distinguish them from their consolidated activities.
It also excludes the design, implementation and management of digital creation
infrastructure, such as Mila13, an institution dedicated to developing & promoting
Quebec’s excellence in artificial intelligence, or Zu14, Cirque du Soleil founder Guy
Laliberté’s “creative hub” project aimed at encouraging incubation and staging of
digital creation. These ancillary activities, both founded in recent years, are closely
linked to the digital creativity industry in Quebec. Yet neither are counted in the
official statistics, nor represented in our sample.
The economically transversal aspect of digital creation manifests itself in many
other sectors of economic activity, such as real estate. It will be interesting to
examine how the evolution of Quebec’s institutional and real estate portfolio,
with the advent of smart buildings for example, will integrate digital creation in
the coming years.
In general, the culture sector contributes 3.4% of Canada’s GDP. This includes all
activities of the cultural and creative industries. More specifically, the “Audiovisual
and Interactive Media” category represents 35.8% of the cultural sector, or just over
1% of Canadian economic activity. This category, however, includes traditional film
13. https://mila.quebec/
14. https://zumtl.com/
31and television production activities that are not included in this study. However,
Statistics Canada and the Institut de la Statistique du Québec published more
granular data until 2016.
A contribution of more than $1 billion to Québec’s economy
We surveyed the members of Xn, Alliance numérique and Coop La Guilde, among
other things by asking them to anonymously provide us with their financial results
for the past three years. According to the data collected in this context, the digital
creativity sector in Quebec represents at least $1,250 billion, achieving growth of
nearly 50% compared to 2015. We use the sample surveyed among the 270 unique
members of the three organizations. It is therefore a minimum.
This result is quite close to the “interactive
media” sub-category obtained in national
statistics. This sub-category is the one closest
to our own sample. According to Statistics
Canada, this grouping of activities contributed
$5.437 billion to the Canadian economy and
$1.128 billion to the Québec economy in
2016. This means that the Statistics Canada
indicator is more restrictive than the activities
selected for this study. According to Canadian
official data, the “interactive media” sub-
sector has experienced a cumulative growth
of 62% from 2010 to 2016, nearly double the audiovisual sector to which it belongs
statistically (+ 35%) and quadruple the broader sector of culture (+ 17%). This is
consistent with our observations of an annual growth rate of these activities of
between 10% and 13%.
32Growing exports
Exports to all commercial partners (x 1 000 000) CANADIAN DOLLARS
Domain 2012 2013 2014 2015 2016
Film & video 1 867,7 1 876,6 1 945,0 2 343,9 2 087,1
Broadcasting 140,9 94,3 100,8 104,3 107,9
Interactive Media 642,4 934,2 937,4 887,9 1 092,4
Total 2 651,0 2 905,1 2 983,2 3 336,1 3 287,4
Source: Statistics Canada. Table 12-10-0117-01 International trade in culture and sport products by domain and
sub-domain, and trading partner (x 1,000,000)15
Based on this same categorization, the review of the “Interactive Media” sub-
category reveals a marked growth in the export of content. A detailed qualitative
study of the export of television fiction content was also conducted by our team on
behalf of the Canadian Media Fund in 2016, and many of the observations made at
the time are still valid today.
Data on the export of content from digital creation is consistent with the
respondents interviewed in the study. For the 2012-2016 reference period, Canadian
cultural exports grew by an average of 24%, just over half of the 41% growth in
digital creative product exports. In general, Quebec is at the top of the Canadian
provinces in terms of its cultural product export capacity (overall), with a 46%
increase over this period, compared with 40% for Ontario and 34% for British
Columbia. In the more specific context of interactive media, Quebec’s growth was
83%, with the sector’s exports increasing from $138M in 2012 to $ 253M in 2016.
This compares favorably with the notably high growth of 75% digital media exports
from Ontario, and 51% in the case of British Columbia.
15. https://www150.statcan.gc.ca/t1/tbl1/fr/cv.action?pid=1210011701
33International and interprovincial trade in culture and sport products by domain and
sub-domain, provinces and territories (x 1,000,000) DOLLARS CANADIENS
Geography 2012 2013 2014 2015 2016
Newfoundland and
31,7 32,8 35,4 39,1 40,2
Labrador
Prince Edward Island 7,2 8,8 9,2 10,7 11,6
Nova Scotia 93,2 124,7 124,2 140,1 141,5
New Brunswick 68,1 74,2 75,6 83,1 87,0
Quebec 2 037,7 2 722,2 2 653,3 2 914,8 2 975,0
Ontario 6 569,3 7 609,3 7 601,2 8 953,1 9 202,2
Manitoba 629,3 880,4 426,6 512,8 514,8
Saskatchewan 91,6 104,6 109,4 123,6 127,0
Alberta 421,2 685,7 690,7 749,6 777,5
British Columbia 1 564,0 1 723,4 1 953,7 2 240,5 2 102,3
Yukon 4,4 6,2 6,4 7,3 7,6
Northwest Territories 8,6 10,0 12,8 15,8 13,2
Nunavut 1,0 0,9 3,8 5,6 6,1
Outside Canada 0,0 0,0 0,0 0,0 0,0
Source : Statistics Canada. Table 12-10-0116-0116
Good financial health
In general, the decade that has ended has been a good time for the digital cultural
industries. According to the Office of the Superintendent of Bankruptcy Canada,
the insolvency rate for Information and cultural industries companies decreased
from 2.6% to 1.3% between 2010 and 2017. Again, digital creation activities are an
integral part of this category that is difficult to extract accurately.
Annual Business Insolvency Rates by NAICS Economic Sectors — 2000-2009
Taux 2010 2011 2012 2013 2014 2015 2016 2017
Information and Insolvency 2,6 2,4 1,9 1,4 1,8 1,6 1,5 1,3
Cultural Industries
Bankruptcy 1,6 1,6 1,6 1,1 1,3 1,2 1,2 1
Proposal 1 0,8 0,3 0,3 0,5 0,4 0,3 0,3
Source : Statistics Canada17
16. https://www150.statcan.gc.ca/t1/tbl1/en/tv.action?pid=1210011601
17. https://www.ic.gc.ca/eic/site/bsf-osb.nsf/fra/br02234.html
34From an individual point of view, programmers and interactive media developers
earn on average 15% more than the Quebec median, with a median salary of
$68,000 per year. For the Greater Montreal area, the median wage is even higher
at $71,000. According to Emploi Québec data, the occupation is marked by a
significant overrepresentation of young people aged 25-44 (72% versus 43% in the
general population) and men (82% versus 53% in the general population). Almost
all jobs in the field (95% +) are full-time jobs.
Employement by age group
Computer programmers &
100%
interactive media developers
Employment in 2016 32 000
80%
Annual income in 2015 68 000
60%
Chosen occupation
Estimated hourly wage in Quebec (2016-2018)
Total occupation
40%
Minimum 18,00
Median 30,05 20%
Maximum 46,00
0%
15-24 25-44 45-54 55+
Part-time & full time
Employment by gender employment
100% 100%
80% 80%
60% 60%
40% 40%
Part time
Full time
Women
20% 20%
Men
0% 0%
Chosen Total Chosen Total
occupation occupation occupation occupation
Source : Emploi Québec18
18. http://imt.emploiquebec.gouv.qc.ca/mtg/inter/noncache/contenu/asp/mtg122_statprof_01.
asp?pro=2174&PT2=17&lang=FRAN&Porte=1&cregn=QC&PT1=0&PT3=9&PT4=53
35Statistics poorly adapted to a new industrial reality
The lack of accurate statistics for a general profile of the cultural and creative sectors
creates significant methodological and statistical challenges that can affect their
development. On a website dedicated to cultural economics, the European Union
describes these effects as follows:
“The difficulties faced by these sectors are compounded by the lack of clear data
and information about them, which limits the capacity of funders to recognize their
potential, as well as other legislative obstacles, such as intellectual property rights,
disparate tax regimes and mobility issues”19.
The Working Group of Experts from the Member States of the European Union on
Access to Finance for the Culture and Creativity Sectors made a recommendation
on this subject in a recent study: “Providing better data on the culture and creativity
sector (CSC) and businesses
in these sectors. It is difficult
to measure the impact and
dynamics of CSC. It is therefore
necessary to support initiatives
and cooperation aimed at
collecting relevant and accurate
data on the CSC, as a sector in its
own right but also as a driver of
innovation and growth in the rest
of the economy20.”
19. https://ec.europa.eu/culture/policy/cultural-creative-industries_fr
20. European Union, 2016. Towards more efficient financial ecosystem. Innovative instruments to facilitate
access to finance for the cultural and creative sectors (CCS) : good practice report — Study.
Online : https://bit.ly/2ToxnjS
36INTERNATIONAL
COMPARISON:
DIGITAL CREATIVITY
IN THE WORLD
The concept of creative industries
The concept of creative industries appeared in Australia in the 1990s, but it was
really developed in the United Kingdom in the late 1990s as a result of a shift in the
government of the day, aimed at highlighting the role in the British economy of a
rather wide and heterogeneous range of sectors of economic activity grouped under
the label of creative industries.
In the United Kingdom, the creative industries have thus become a central issue
in support policies for the economy. Gradually, “the notions of creative industries
and economics became prominent in the debates affecting the cultural industries,
and in particular they helped to highlight the importance of the role of the cultural
sector in economic development and growth policies at local, national and
international levels.21”
Other national jurisdictions have followed suit and adopted their own definition of
cultural and creative industries. These definitions vary according to the areas that
each chooses to include, the importance that is attached to their economic and
cultural scope, and serve to guide and justify supportive programs and policies.
21. Felipe Verdugo, CEIM, dans Culture, commerce et numérique, volume 11, numéro 7 (octobre 2016).
« Industries créatives et jeux vidéo : vers une redéfinition des contenus culturels à l’ère du numérique ? »
Online : https://bit.ly/2DyANaO
37If we add to this the diversity of methodologies, modeling, scope of economic value
and impact estimates adopted by the various organizations, making comparisons
between the value of the cultural and creative industries of different territories
becomes a perilous exercise. This is truer for the digital creativity sector, often
considered as a sub-sector of the cultural and creative industries, for which
separate data are difficult to find.
By conducting a review of the recent literature on this subject, we can, in the
absence of precise indicators, identify certain parameters that make it possible to
understand the environment in which the sectors of digital creativity evolve, both
internationally and in some territories.
This environment, as highlighted in a recent report of the UN Conference on
Trade and Development (UNCTAD)22, is robust : the global creative economy — at
the heart of which the creative industries are evolving — has gone through the
economic crisis of 2008 without too much damage, and has even experienced
growth, demonstrating in general that it is a business sector with a high return
potential.
After all, it is an industry whose raw material, human creativity, is inexhaustible.
Some observers also point out the fact that consumer demand is not likely to
decrease, unlike what happens for fossil fuel-based industries, for example.
UNCTAD report shows significant growth in trade in the creative economy: in just
over a decade, from 2002 to 2015, the size of the global creative goods market has
more than doubled from $ 208 billion in 2002 to $ 509 billion in 2015.
That said, the report also points to a decline in the export of creative goods in
2015, down almost 14% from 2014. The report speculates that this could be partly
explained by a weaker demand in developed countries, political and economic
tensions in developing countries and a difficult international environment. This is
perhaps an indicator that the strength of this economy is not guaranteed.
22. UNCTAD (2018). Creative Economy Outlook : Trends in international trade in creative industries, 2002-2015.
En ligne : https://unctad.org/en/pages/PublicationWebflyer.aspx?publicationid=2328
38You can also read