Micro and Nanoplastics Identification: Classic Methods and Innovative Detection Techniques - Frontiers
←
→
Page content transcription
If your browser does not render page correctly, please read the page content below
REVIEW
                                                                                                                                             published: 26 February 2021
                                                                                                                                           doi: 10.3389/ftox.2021.636640

                                                Micro and Nanoplastics
                                                Identification: Classic Methods and
                                                Innovative Detection Techniques
                                                Stefania Mariano 1 , Stefano Tacconi 1 , Marco Fidaleo 2 , Marco Rossi 3,4,5 and
                                                Luciana Dini 2,4,5*
                                                1
                                                  Department of Biological and Environmental Science and Technology, University of Salento, Lecce, Italy, 2 Department of
                                                Biology and Biotechnology “Charles Darwin”, Sapienza University of Rome, Rome, Italy, 3 Department of Basic and Applied
                                                Sciences for Engineering, Sapienza University of Rome, Rome, Italy, 4 Research Center for Nanotechnologies Applied to
                                                Engineering, CNIS Sapienza University of Rome, Rome, Italy, 5 National Research Council Nanotec, Lecce, Italy

                                                Micro and nanoplastics are fragments with dimensions less than a millimeter invading all
                                                terrestrial and marine environments. They have become a major global environmental
                                                issue in recent decades and, indeed, recent scientific studies have highlighted the
                                                presence of these fragments all over the world even in environments that were thought
                                                to be unspoiled. Analysis of micro/nanoplastics in isolated samples from abiotic and
                                                biotic environmental matrices has become increasingly common. Hence, the need to
                                                find valid techniques to identify these micro and nano-sized particles. In this review, we
                          Edited by:            discuss the current and potential identification methods used in microplastic analyses
                  Luisa Campagnolo,
                                                along with their advantages and limitations. We discuss the most suitable techniques
  University of Rome Tor Vergata, Italy
                                                currently available, from physical to chemical ones, as well as the challenges to enhance
                         Reviewed by:
                        Elijah Petersen,        the existing methods and develop new ones. Microscopical techniques (i.e., dissect,
   National Institute of Standards and          polarized, fluorescence, scanning electron, and atomic force microscopy) are one
    Technology (NIST), United States
                      Michael Riediker,         of the most used identification methods for micro/nanoplastics, but they have the
            SCOEH: Swiss Centre for             limitation to produce incomplete results in analyses of small particles. At present, the
     Occupational and Environmental
                                                combination with chemical analysis (i.e., spectroscopy) overcome this limit together
                    Health, Switzerland
                                                with recently introduced alternative approaches. For example, holographic imaging
                   *Correspondence:
                          Luciana Dini          in microscope configuration images microplastics directly in unfiltered water, thus
              luciana.dini@uniroma1.it          discriminating microplastics from diatoms and differentiates different sizes, shapes, and
                                                plastic types. The development of new analytical instruments coupled with each other
                    Specialty section:
          This article was submitted to         or with conventional and innovative microscopy could solve the current problems in the
                        Nanotoxicology,         identification of micro/nanoplastics.
                a section of the journal
                 Frontiers in Toxicology        Keywords: microplastics, nanoplastics, characterization, microscopy, spectroscopy, analytical methods,
                                                environmental matrices
       Received: 01 December 2020
        Accepted: 22 January 2021
       Published: 26 February 2021
                                                INTRODUCTION
                             Citation:
    Mariano S, Tacconi S, Fidaleo M,
                                                The strong impact of environmental plastic pollution on the development, growth, and survival
 Rossi M and Dini L (2021) Micro and
   Nanoplastics Identification: Classic
                                                of several living species, including humans, has prompted the scientific community to develop
   Methods and Innovative Detection             new monitoring and decontamination systems. Despite the various advantages in daily use,
Techniques. Front. Toxicol. 3:636640.           the consumption of plastic materials increases environmental pollution due to their low
     doi: 10.3389/ftox.2021.636640              biodegradability, inappropriate use, and inefficient disposal. The exposure of plastic derivatives

Frontiers in Toxicology | www.frontiersin.org                                         1                                          February 2021 | Volume 3 | Article 636640
Mariano et al.                                                                                                      Micro and Nanoplastics Identification

in the environment promotes physical, chemical, and biological                transport into the environment. While MPs transport toxic
degradation processes leading to the accumulation of small                    chemicals into ecosystems, they are themselves, on the other
plastic fragments both in the terrestrial and aquatic ecosystems,             hand, a cocktail of hazardous chemicals that are voluntarily
i.e., freshwater (Eerkes-Medrano et al., 2015), sediments (Yang               added during their production as additives to increase the
et al., 2020), soil (Li et al., 2020), air (Prata, 2018), and foodstuff       properties of polymers and prolong their life.
(Kwon et al., 2020).                                                              Toxic chemicals, attached through adsorption processes to
    In function of their size, plastic fragments can be classified            MPs, can cause effects in both the biotic and abiotic environment,
in macro- and mesoplastics (> 5 mm), microplastics (MPs,                      as they can be ingested by inhalation or contact (Bradney et al.,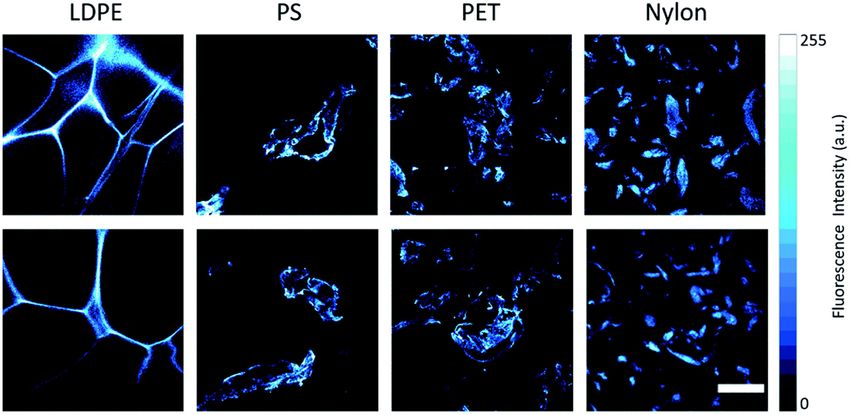
Mariano et al.                                                                                                    Micro and Nanoplastics Identification

strongly influence diffusion processes through biological barriers,        their combination and new approaches to solve MPs/NPs
adhesion to the epithelium and bioaccumulation in deep tissues             identification issues.
(Prata et al., 2020a). Similarly, in recent in vitro studies, the
absorption, translocation and cytotoxic effects of engineered NPs
                                                                           IDENTIFICATION METHODS
are affected by their size, charge, and shape (Elliott et al., 2017;
Stock et al., 2019; Wu B. et al., 2019). The bioaccumulation               Microscopy
potential of MPs increases with decreasing size, indicating                Stereo- (or Dissecting) Microscopy
both in vivo and in vitro the widespread risk of exposure to               The stereomicroscope allows three dimensions analysis by
health (Deng et al., 2017; Schirinzi et al., 2017). Ingestion of           observing the sample from two slightly different angles to
contaminated food is considered the main route of exposure to              obtain the two images necessary for stereoscopic vision.
MPs, which is related to potential effects on the gastrointestinal         Thus, it is possible to observe objects mainly by means of
system, impaired epithelial permeability, localized inflammatory           reflected light at low magnification, typically between 8 and
processes and changes in the composition of gut microbiota                 50 times. The illumination system of stereoscopic microscopes
(Campanale et al., 2020). In addition to ingestion, inhalation,            comes from above, conversely to the optical microscope in
and contact with the respiratory tract represent a dangerously             which the light beam comes from below and crosses the
risky route of exposure due to the high rate of diffusion of               sample. In some stereomicroscope models there is a double
MPs in the air flows. Aside from differences in metabolism and             lighting. Differing from the optical microscope with higher
individual susceptibility, the response to MPs inhalation can be           magnifications, it is therefore suitable for the observation of
summarized as immediate bronchial reactions, diffuse interstitial          whole fresh microorganisms, cells, fungi, and permanent slides.
fibrosis, inflammatory and fibrotic changes in bronchial and               Although the lower magnification of the stereomicroscope may
peribronchial tissue, and interalveolar lesions (Prata, 2018).             seem like a limit, it has, in fact, advantages for its very easy to use
Conversely, the diffusion through the stratum corneum is limited           for studying objects that can be observed with the naked eye.
to nano-sized plastics below 100 nm, so absorption of MPs                      The stereomicroscope is a useful and widely used for the
through the skin is improbable (Revel et al., 2018). Once in the           identification of MPs whose dimensions fall within the range
bloodstream, MPs can reach peripheral tissues triggering various           of hundreds of microns. Figure 1 reports some examples
toxic effects, such as oxidative stress, inflammatory processes,           of different shapes of MPs in seawater samples. Magnified
metabolic disturbances, neurotoxic effects, etc. Accumulation of           microscope images provide detailed surface structure and
MPs in the liver and spleen has been described in mouse models             structural information of the objects, essential for identifying the
after exposure by ingestion and inhalation (Jani et al., 1990; Eyles       ambiguous plastic particles typology. Although many particles
et al., 2001). Furthermore, the oral administration of polystyrene         in the size of few microns are visible under the microscope,
MPs induces accumulations in the gut, intestine, and kidney,               particles smaller than 100 µm that are transparent or have a
with evident effects on the redox balance, alteration in energy            particular shape are difficult to characterize (Song et al., 2015).
homeostasis and neurotoxicity (Deng et al., 2017).                         Also, particularly dense sediment samples can interfere with the
    Monitoring of MPs in various biotic and abiotic                        microscopic identification of MPs on filter paper. Also, when a
environmental matrices is necessary to define the state of                 sample contains material that cannot be eliminated by chemical
pollution, flow and risk of exposure by organisms. Monitoring              digestion, the identification is compromised.
studies require reliable and comparable methods. However,                      Several studies report that the percentage of plastic-like
identifying MPs of different composition, shape, and size with a           particles identified by stereomicroscopy, and subsequently
single technique is a rather difficult goal.                               characterized by other techniques, is about 20–70% of the total
    In general, the analysis of MPs consists of two phases:                particles found, in the case of transparent particles (Eriksen et al.,
physical characterization of the displayed fragments, followed by          2013; Song et al., 2015). Furthermore, synthetic and natural fibers
chemical characterization thus confirming the chemical nature              (very abundant elements in water, sediment, and biota samples)
of the particles found. Microscopical techniques (i.e., stereo,            are difficult to identify using stereomicroscope (Browne et al.,
fluorescence, atomic force, transmission, and scanning electron            2010; Lusher et al., 2013). Stereomicroscope is used to identify
microscopy) are the most exploited strategies to achieve the goal.         MPs based on their physical appearance. This is a first fast-
The main objective of this review is to describe the microscopical         screening method that allows rapid identification of shape, size,
and analytic methods for the detection, characterization and               and color of the particles which will be further characterized by
identification of MPs in different environmental matrices.                 other methods. Hence, the need to couple the stereomicroscopy
Among the analytical methods, chemical characterization                    with other techniques such as spectroscopy.
techniques such as spectroscopy and thermal analysis will
be described, although some microscopic techniques, such as                Fluorescence Microscopy
TEM, SEM, and fluorescence microscopy have an analytical                   Unlike the optical microscope which relies on the contrast of
potential that allows to identify and determine the chemical               the image given by the reflection of light on the sample, the
and physical properties of many polymers. We discuss the                   fluorescence microscope collects fluorescent emission from the
advantages and limitations of the different microscopic and                samples that are excited by a specific wavelength. The sample
analytical techniques (reported in Table 1 together with the               to be analyzed, consisting mainly of living organisms such as
estimated TRL present level for each method), as well as                   cells, bacteria, or tissues, contains a substance called fluorophore,

Frontiers in Toxicology | www.frontiersin.org                          3                                     February 2021 | Volume 3 | Article 636640
Mariano et al. Micro and Nanoplastics Identification
TABLE 1 | Advantages and limitations of the current methods for MPs characterization and the relative estimated TRL present range.
Identification method Advantages Limitations Estimated TRL
present range
Stereo microscopy - Fast and easy - Not confirmative of plastic nature of the particle 5–7
- Identification of shape, size, and colors - No polymer composition results
- Lack of data of transparent or small particles
Transmission Electron - Very high resolution ( 100 nm
Scanning Electron - Clear and high-resolution images of particles - Expensive 4–6
Microscopy - Elemental analysis of particles if coupled with EDS - Long time and effort for analysis
- No gas into the chamber if coupled in ESEM mode - Lack of information on the type of polymer
- No sputtering if coupled in ESEM mode
- Small detected particles in STEM mode
- No treatment of sample in FE-SEM mode
Atomic Force Microscopy - No radiation damage of the sample - No prevention from outside factors like 2–4
- Preserved sample surface contaminations
- 3D images of the surface structure of the polymers - Damage caused by the interaction of the tip with
- Best resolution obtained (0.3 nm) the sample
Fluorescence microscopy - Easy - Laser in the ultraviolet can be harmful and toxic 4-6
- Detection of transparent particles for the sample
- Immediate visualization of the particles - Chemical additives can interfere with fluorescence
Raman Spectroscopy - Detection of small MPs (1 µm) and NPs (Mariano et al. Micro and Nanoplastics Identification FIGURE 1 | Images of different shapes of MPs in biological samples. The arrows indicate fibers (A–D), fragments (E,F), the film (G) and granules (H,I). Scale bar = 100 µm. This figure is reproduced from Ding et al. (2019) with permission of Royal Society of Chemistry (RSC). MPs in different matrices can also be based on the quantitation the chemical additives used in the synthesis process which can of fluorescent spheres with microscopy techniques (Batel et al., also influence the fluorescent properties (Piruska et al., 2005). 2018; Dawson et al., 2018; Catarino et al., 2019, Schür et al., For example, additives may exhibit fluorescent properties and 2019). So far, however, the investigation of biological membrane interfere with microscopic fluorescence measurements (Lee et al., crossing evidence by MPs has been inconclusive, as labeled NPs 2020). Therefore, it is necessary to eliminate these impurities solutions may have residual free dye that peels off in an altered as much as possible with adequate pre-treatment (Elert et al., medium (i.e., pH, salts, or biological affinity) and the intensity 2017). Surface rinsing with acids or oxidants (e.g., hydrogen of total fluorescence in cells after exposure can be mistakenly peroxide) and enzymatic digestion is usually used (Löder et al., attributed to the presence of nanoparticles, when in fact it is 2017). These pre-treatments can only remove surface impurities caused by free fluorophore (Tenuta et al., 2011; Andreozzi et al., or contaminants, but they do not reduce potential inferences 2013). Another limitation in the visualization of MPs is given by from the chemicals contained within MPs. Frontiers in Toxicology | www.frontiersin.org 5 February 2021 | Volume 3 | Article 636640
Mariano et al.                                                                                                   Micro and Nanoplastics Identification

   A novel technique used for identification of MPs utilizes               of MPs (PP, PE, PET, and PVC) on microalgae, as the inhibition
a fluorescent dye, i.e., Nile Red, to label plastic fragments, in          growth and the cell structure variation, TEM characterization
particular when analyzing tissues or organisms (Cole et al., 2013).        was performed (Song et al., 2020). The need to characterize
Details will be described in the paragraph “new approaches and             MPs based on their size, surface characteristics, thickness, and
new identification strategies”.                                            other physicochemical properties pushes toward the use of other
                                                                           microscopic techniques such as SEM, fluorescence microscopy
Transmission Electron Microscopy                                           and AFM, as described below.
The electron microscope has a very high-resolving power that
allows the observation of samples of infinitesimal sizes thanks to         Scanning Electron Microscopy
the wave properties the electrons, emitted by a very thin filament         Scanning electron microscopy (SEM) is a microscopic technique
of thermoionic material (W or LaB6 ) or by a field emitter source,         able to provide information about the morphological surface
for the top-level TEMs. Then, the electrons pass into the magnetic         structure of MPs, generating high-resolution images of the
capacitor through a hole located in the anode (the capacitor has           surface state. Furthermore, it can provide data about the
the purpose of regulating the intensity of the convergence of              chemical composition of the samples, since it can be equipped
the electron beam). Transmission electron microscopy (TEM)                 with detectors for EDS (Energy Dispersive X-ray-Spectroscopy)
is the most used technique in characterizing nanomaterials in              (Figure 2C). The primary electrons penetrate the solid specimen,
electron microscopy, providing chemical information and images             and different (both elastic and inelastic) scattering processes
of nanomaterials at a spatial resolution equal to the level of             are generated, and the related different signals are collected by
atomic dimensions (Dini et al., 2015). The electron beam through           different detector systems to make an image (Bogner et al., 2007).
which incident light is transmitted via a thin foil specimen is            In particular, the secondary electrons provide a detailed image
transformed into elastically or inelastically scattered electrons          that helps to understand the morphology of objects, while the
when the electron beam interacts with the specimen. Detection              back-scattered electrons passing through the specimen produce
methods are in an early stage of development and no NPs have               an increasing intensity that provides information about the
actually been detected in soft matrices by TEM, so far. TEM is not         topography and contrast of the material based on the atomic
effective to visualize NPs because of their amorphous structure; in        number (Z). Samples with elements composed of a higher
fact, NPs and MPs are not electrondense and heavy-metal stains             atomic number (Z) produce more back-scattered electrons than
are required. Polymers are generally composed of elements that             lower Z elements. This phenomenon can be used to distinguish
show poor contrast in TEM because their elastic interactions               differences in the composition of samples (Reimer, 1993). EDS is
with electrons are weak. As such, the use of heavy element                 not a separate technique from SEM, but an additional detector
stains remains a popular method that enables the visualization             which allows the observer to get qualitative and quantitative
of the microstructure of organic specimens in TEM (Sawyer                  information about the elemental analysis of the sample. It
et al., 2008). However, the stains themselves have been shown to           consists of an electron beam generated by an electron microscope
change the chemical structure of the polymers. The electrons are           cathode. When primary electron beam hits the surface of
inelastically scattered as a result of various physical phenomena:         the sample many interactions are generated, in particular X-
phonon excitation, plasmon excitation (collective oscillations of          ray. These return data about the elements and their spatial
valence electrons), and the ionization of core shell electrons.            distribution which characterize the sample.
These inelastically scattered electrons are able to be analyzed               The SEM-EDS is often considered an expensive technique.
spectroscopically using a technique called electron energy loss
Mariano et al. Micro and Nanoplastics Identification FIGURE 2 | Microplastic particles extracted from laboratory medaka GI tracts. For all FTIR spectra, extracted MPs (red) are compared to the original reference MPs (blue). (A) 150 µm PVC and (B) 300 µm PET particles prepared in 10% KOH, showing strong FTIR peaks for proteins and fats (red arrows) and potassium salts (green arrows). (C) SEM/EDS of KOH-treated microplastic showing redeposited particulate material and strong potassium peak. (D) 150 µm PS, 250 µm PE, 250 µm PET, and 150 µm PVC extracted with ultrapure H2 O and PUE, exhibiting reduced FTIR protein and fat peaks and no salt peaks. This figure is reproduced from Wagner et al. (2017) with permission of Royal Society of Chemistry (RSC). Frontiers in Toxicology | www.frontiersin.org 7 February 2021 | Volume 3 | Article 636640
Mariano et al.                                                                                                  Micro and Nanoplastics Identification

make an EDS analysis as well. When investigating light elements,          (iii) Tapping mode: this is the method that allows maximum
it is possible to adopt moderate energy for the analysis of non-                resolutions but requires levers with high elastic constants.
conductive particles, avoiding adding additional signals in the                 The lever is vibrated at frequencies close to that of resonance
EDS spectrum resulting from coverage. Otherwise, it is necessary                and is kept at a distance such that the tip makes transient
to use higher energy which however can cause a charge effect of                 contact with the sample surface when the amplitude of
the sample.                                                                     the oscillation is maximum. The force applied by the tip
    At last, SEM is a versatile instrument allowing also the                    is absorbed without damage by the sample in most cases
NPs to characterized since it can be equipped with a STEM                       unless dealing with particularly soft materials. Changes in
holder to analyse sample on a grid. Small particles can be                      the amplitude of the oscillation are recorded to obtain
visualized without high energy and voltage typical of classical                 the image.
TEM (Mitrano et al., 2019).
                                                                          In AFM, different types of forces that are established between
                                                                          sample and tip can be used to produce images. In the “no
Atomic Force Microscopy                                                   contact mode,” the images are produced by van der Waals
The need to perform measurements on non-conductive materials              forces, or by electro-static, magnetic and capillary forces. In the
without resorting to surface metallization led to the use of              “contact mode,” the ion repulsion forces prevail. Furthermore,
atomic force microscopy (AFM), which, although like the other             the friction force acting between the tip and the surface is
previous microscopies in some general characteristics, is based           particularly important for a complete and detailed analysis of
on a completely different operating principle. In AFM, a small tip        the sample. In addition to be an indicator of the properties
of very rigid conductive material is fixed to the end of a rod or         of the sample, friction or “lateral force” or “lateral deflection”
micro-lever (cantilever) that presses the tip on the sample during        provides information about the interaction between the tip and
the process of measure. The cantilever flows on the surface of a          the surface.
sample which moves along the three Cartesian axes through a                   AFM has been used extensively in the characterization of
movement induced by a piezoelectric mechanism. A system of                several nanoscale samples, from engineered nanoparticles (Fu
control allows the tip to be kept in conditions of “constant force”       and Zhang, 2018) to soil particles (Cheng et al., 2009), polymeric
(to acquire information on the interaction strength between               membranes (Fu and Zhang, 2017), and other nanostructures
the sample surface and the tip) or of “constant height” (to               (Nguyen et al., 2017). In comparison with SEM analysis, AFM
acquire information on variations in height of the sample). The           allows additional characterizations to be performed including
oscillations of the cantilever are detected by an optical system          stiffness (Zhang et al., 2012), hydrophobicity (Fu and Zhang,
which also records very slight movements of the bar that supports         2018), conductivity (Trotsenko et al., 2016), or magnetization
the tip. The actual image of the sample is reconstructed by               (Middea et al., 2015).
processing the information relating to (i) relative movement                  As all microscopic techniques, the AFM also presents
mode between sample and tip and (ii) punctual results on the              advantages and limitations. Advantages: (i) AFM produces
sample-tip distance (Haggerty and Lenhoff, 1993). According to            images with a high resolution of a few nm; (ii) AFM preserves
the interaction modes of the tip with the sample surface, AFMs            the sample surface as it involves simple sample preparation; (iii)
can be used in:                                                           AFM can be used to investigate the surface of non-conducting
                                                                          polymers, as in the case of MPs; (iv) AFM provides direct
(i)  Contact mode: the tip is in physical contact with the surface
                                                                          3D images of the surface structure of the polymers. Using
     to be analyzed and responsible for the bending of the lever
                                                                          lateral force, phase contrast modes, or nanomechanical imaging,
     are the Van der Waals repulsive forces and the electrostatic
                                                                          it permits the discrimination between the type of materials
     interactions, with an average value of 10−9 N. The lever
                                                                          on the surface of polymer blends; (v) AFM is useful for the
     must have a small elastic constant, thus avoiding excessive
                                                                          analysis of nanocomposite materials; (vi) AFM avoids radiation
     pressure to the sample and altering its surface. The height
                                                                          damage of the sample as a combination for SEM and TEM;
     of the lever can be kept constant or can be adjusted by the
                                                                          (vii) the best resolution obtained is 0.3 nm, which is better
     feedback loop to avoid damaging the tip. This method of
                                                                          than SEM. Recently, the technique has been exploited to study
     analysis is used for hard samples, which are not damaged by
     contact with the tip. The most critical phase of the analysis        the process of degradation of MPs in marine environmental,
     is the engagement, that is the approach of the probe to the          in presence of adherent bacteria on the surface (Dussud
     surface: an error in this process can lead to the tip breaking       et al., 2018). In another study, Luo et al. (2020) successfully
     or to the damage of the sample surface.                              prepared a nano-TiO2-coated polypropylene MPs, and explored
(ii) Non-contact mode: the tip is kept at a distance of a few             the nanoscale infrared, thermal, and mechanical properties
     nanometers from the sample and is sent into resonance                of MPs before and after photoaging combing AFM with
     in order to obtain a continuous vibration. Variations in             analytical technique. However, AFM presents some limitation.
     oscillation frequency due to Van der Waals interaction               First, AFM cannot prevent outside factors like contaminations;
     forces depend on the distance of the tip from the sample             also, the tip can produce artifacts derived, for example, from
     and are used to reconstruct the surface image. This type of          the damage caused by the interaction of the tip with the
     analysis is used with materials that are too soft, which could       sample (Jagtap and Ambre, 2006). Moreover, the contact
     be damaged by contact with the tip.                                  could release fragments, in case of adhesive polymers, to the

Frontiers in Toxicology | www.frontiersin.org                         8                                    February 2021 | Volume 3 | Article 636640
Mariano et al. Micro and Nanoplastics Identification
tip and could produce an incorrect image of the sample errors prevent you from having a correct signal. Furthermore,
(Ukraintsev et al., 2012). the lateral resolution is limited to a diffraction range and sample
Thus, AFM is a promising method to characterize MPs or with a dimension of < 20 µm are not detectable (Löder et al.,
NPs, but a combination with other techniques is needed. In 2015). µ-FTIR have been widely used in MPs works to find and
the following paragraphs, the coupling with other analytical characterize them within the sediment (Harrison et al., 2012;
techniques will be better described. Peng et al., 2017), marine organisms (Zhang et al., 2020), surface
water (Wu P. et al., 2019), food (Li et al., 2018b). The technique
Analytical Methods allows to collect IR signals at a high spatial resolution, also it is
FT-IR Spectroscopy useful for the characterization of complex samples. For example,
Infrared spectroscopy or IR spectroscopy is an absorption Zhang et al. (2020) performed a µ-FTIR analysis on microplastic
spectroscopic technique normally used in the field of material pollution in surface sediments from 28 stations in Sishili Bay,
characterization for the study of chemical bonds. When an identifying eight polymer types including rayon, PE, PP, PA, PET,
infrared photon is absorbed by a molecule, it passes from its PS, PMMA, and PU.
fundamental vibrational state to an excited vibrational state. As already described above, AFM is used to scan the surfaces
In a typical infrared spectrum on the abscissa we find the of materials and then generate an image of their height; however,
wavenumber of the incident photon and on the ordinate the the technique cannot easily identify the molecular composition of
transmittance. The vibrations can be of two types: stretching the observed materials. Researchers developed a combination of
of the chemical bond (stretching) and deformation of the bond AFM and IR spectroscopy, called the AFM-IR technique. AFM-
angle (bending). Fourier transform IR or FTIR spectroscopy is IR is a widely used method for the acquisition of IR absorption
performed using an interferometer, which allows the scanning spectra and absorption images with a spatial resolution of 50–
of all the frequencies present in the IR radiation generated by 100 nm (Dazzi and Prater, 2017). It is achieved by coupling
the source. Scanning is possible thanks to a moving mirror AFM equipment with a pulse tunable IR source, which has a
which, by moving, introduces a difference in the optical path, pulse length of 10 ns and covers a wide range of mid-infrared
which causes constructive or destructive interference with the ray regions. The AFM-IR microscope uses a micro-lever, connected
reflected from a fixed mirror. In this way, an interferogram is at one end to the support, while a sharp tip is connected to the
obtained which shows the representation of intensity in the time other end; the measurement of the imperceptible movements
domain. By applying the Fourier transform, the interferogram of the introduced sample is carried out using an infrared laser
is transformed into a spectrum with peaks corresponding beam. The absorption of light by the sample generates a slight
to specific chemical bonds or molecular vibration (Smith, expansion, with a consequent deflection of the micro-lever, which
2011). FTIR involves four techniques: transmission (Turner and therefore produces an infrared signal. Thermal expansion of the
Holmes, 2011), reflectance (Guo et al., 2017), true specular sample due to the absorbing of pulsed light by a sample produces
reflectance/reflection-adsorption (Rodenko et al., 2018) and heat and generates an impulse on AFM cantilever, causing the
attenuated total reflection (Song et al., 2014). Among the main cantilever to oscillate, which is called a “ring-down” (Dazzi et al.,
advantages of FT-IR, which guarantees higher performance, the 2015). In this study, AFM-IR technique in different modes was
high availability of energy results in a much better signal/noise used to explore the nanoscale infrared, thermal and mechanical
ratio than traditional IR spectroscopy. Furthermore, the analysis properties of TiO2 -pigmented MPs before and after aging. AFM
times are significantly reduced. topographical images showed that the surface of unaged MPs
Together with Raman spectroscopy, FTIR is much used was relatively smooth, but the aged MPs had a rough surface
to characterize MPs (Lefebvre et al., 2019; Schwabl et al., with more granular domains. Combined AFM-IR technique
2019; Corami et al., 2020). Figures 2A,B,D show the FTIR and photothermal infrared spectroscopy are used to locate,
spectra of some MPs extracted from Medaka (Oryzias latipes) image, and chemically identify the beads in the mussel siphons
gastrointestinal tracts. In every study, MPs samples are excited (Merzel et al., 2019). Some works have successfully exploited
giving specific detected vibrations which allow a spectrum with the technique by investigating samples that were known to be
a fingerprint range to be obtained. This spectrum describes the contaminated with plastic particles. Indeed, the characterization
nature of the material, which can be identified by comparing it of unknown samples can highlight some limits of the technique
with the known reference spectra. Larger particles (>500 nm) as it is tough and time-consuming to scan and find nano-sized
can be analyzed by using ATR-FTIR, but small particles require particles in an unknown sample.
the micro-FTIR (µ-FTIR) that permit to get a simultaneous
visualization, mapping, and collection of spectra. It can be Raman Spectroscopy
performed both in ATR and reflectance mode. Jung et al. (2018), Raman spectroscopy is a technique based on the interaction
for example, provided a definitive validation of ATR FTIR to between radiation and material. This technique exploits a laser
identify ingested plastic polymer types in sea turtle. ATR permits radiation that interacts with the vibrational motions of the
to obtain high-quality spectra but needs infrared-transparent molecules and causes the re-emission of light at wavelengths
substrate. The reflectance mode is used for thick samples, but that are characteristic of those specific atomic groups. A Raman
irregular surfaces of particles can interfere with analysis because spectrum is therefore generated by the inelastic scattering
of refractive error (Harrison et al., 2012). Therefore, only samples between the photons of an incident radiation and the molecules
with particular properties can be analyzed, otherwise, reftractive that constitute the sample (Ribeiro-Claro et al., 2017). By
Frontiers in Toxicology | www.frontiersin.org 9 February 2021 | Volume 3 | Article 636640Mariano et al. Micro and Nanoplastics Identification
irradiating the sample with a monochromatic light beam at intensity of the Raman diffusion. However, some fluorescence
frequency ν0, a part of the radiation is elastically diffused at the interference can be overcome by applying an algorithm or more
same initial frequency ν0, i.e., with photons of the same energy efficient detectors (Araujo et al., 2018).
(a phenomenon defined as Rayleigh scattering). The spectrum
of the scattered radiation will also present a series of lines with Thermal Analysis
a higher or a lower frequency than the Rayleigh line, due to Apart from different IR absorption or Raman scattering
inelastic diffusion (Kauffmann et al., 2019). properties, plastic polymers also differ in their thermal stability.
Raman spectroscopy is another useful chemical analytical The MPs identification through thermo-analytical techniques
technique for identification of MPs in different environmental exploits changes in the physical and chemical properties of
matrices: Van Cauwenberghe et al. (2013) analyzed plastic polymers (Majewsky et al., 2016). The methodology is based on
particles sized in the micrometer range in deep-sea sediments the identification of the polymer according to its degradation
collected at four locations representing different deep-sea products. The development of thermal methods is pivotal for the
habitats ranging in depth from 1100 to 5000 m; Cole et al. (2013) characterization of low-solubility MPs and additives that cannot
identified that 13 zooplankton taxa had the capacity to ingest be easily dissolved, extracted, or hydrolysed. The thermal analysis
1.7–30.6 µm polystyrene beads, with uptake varying by taxa, life- includes techniques like differential scanning calorimetry (DSC),
stage and bead-size; Murray and Cowie (2011) found balls of thermogravimetry (TGA), pyrolysis-gas chromatography-mass
tightly tangled plastic threads were found in the intestines of the spectrometry (py-GC-MS), and combinations of these methods.
Norway lobster, Nephrops norvegicus and Raman spectroscopy DSC is a thermal analysis technique that can be used to
indicated that some of the microfilaments identified by the measure the temperature and the heat flux associated with
intestinal contents could be derived from fishing waste; Imhof the transitions that occur in a sample, the melting enthalpies,
et al. (2013) collected sediment samples from two beaches at Lake the glass transitions and crystallization kinetics of polymeric
Garda for the identification of MPs. Detection and quantification materials. The basic principle of this technique is to obtain
were performed using Raman micro-spectroscopy which allows information about the material by heating or cooling it in
the analysis of particles down to the µm-range. Conventional a controlled manner. In particular, the DSC is based on the
Raman usually detects MPs larger than 10 µm, while micro- measurement of the difference in heat flow between the sample
Raman spectroscopy (µ-Raman spectroscopy) permits to analyse under examination and a reference sample, while both are bound
MPs up to 1 µm. It is an integration between the Raman to a variable temperature defined by a pre-established program.
spectroscope and an optical microscope that makes it possible DSC is a useful technique for the study of polymeric materials,
to visually select the specific area of the sample to be analyzed. but it requires reference materials. Indeed, it is mostly used for
This allows it to be used in many and varied scientific fields, with the identification of primary MPs like PE microbeads which
applications above all in the environmental, forensic, materials have known characteristics (Castañeda et al., 2014). However,
sciences, biology and medicine, geology, pharmaceuticals, and the use of DSC for the analysis of plastics such as polycarbonate
restoration of works of art fields. In the last years, it has been (PC), polystyrene (PS), polymethyl methacrylate (PMMA), and
used at the university research level for the identification of MPs acrylonitrile butadiene (ABS), among others, has limitations
in bottled water in order to analyse the release of MPs from the as these plastics melt over a wide range of temperatures.
packaging (Di et al., 2019; Tong et al., 2020). Other applications Furthermore, quantification of the mass of MPs in environmental
of µ-Raman spectroscopy are reported in Table 2, regarding the samples has also been reported (Majewsky et al., 2016; Shim
identification of MPs in different environmental matrices like et al., 2016). Among other limitations, DSC results in a lack of
sediment, organisms, freshwater, drink, cosmetics, etc. specificity when characterizing a mixture of MPs with closely
Raman spectroscopy presents many advantages with respect spaced melting points (Majewsky et al., 2016) and the overlap of
to FTIR spectroscopy. It allows non-destructive analysis of melting peaks.
materials, in any state of aggregation, with generally reduced Thermogravimetry (TGA) is another classical technique that
sample preparation using lasers of different power able to affect allows the quantitative thermal analysis of a sample by measuring
the material, generating a Raman spectrum characteristic of the the weight lost from the sample at a certain temperature,
analyzed material. Also, the thickness of samples is not important however, without identifying the nature of the components.
in the measurement. Analysis of samples in solution, gas, film, From this analysis, it is possible to obtain graphs (the mass as
surface, solids, and single crystals is possible. Analysis can be function of the temperature) thermogravimetric details. It is a
performed at various temperatures. The low-temperature spectra thermal analysis technique widely used in the case of polymeric
(10 K) allow: (i) to minimize any damage caused to the sample materials. It is known how the thermal degradation mechanism
by local heating induced by the laser; (ii) can be compared with of polymers can be significantly influenced by the experimental
studies obtained with other methods that provide good results at conditions in which the heating is performed. Therefore, the
low temperatures. Among the disadvantages, fluorescence can be reproducibility of polymer thermogravimetry data requires as
a very serious problem if combined with Raman spectroscopy. In detailed control as possible of the operating conditions of the
fact, the Raman and the fluorescence are intimately connected experiment, such as the size and the shape of the sample, the
since in both phenomena the photon emitted comes from rate of heating, the type of atmosphere in which the sample is
excitation in the absorption band and the quantum yield of the heated (Peñalver et al., 2020). In TGA a loss of mass is measured,
fluorescence is often of an order of magnitude higher than the whereas the degradation of polymeric materials begins frequently
Frontiers in Toxicology | www.frontiersin.org 10 February 2021 | Volume 3 | Article 636640Mariano et al. Micro and Nanoplastics Identification
TABLE 2 | Application of µ-Raman spectroscopy in MPs characterization.
Origin/matrix/reference MPs type MPs size Results
Northwestern Pacific/seawater PE, PP, NYLON 0.5 and 1.0 mm µ-Raman spectroscopic analysis results indicate that the major
(Pan et al., 2019) compositions of MPs are PE (57.8%), PP (36.0%) and nylon (3.4%) and
the origin of the MPs at these stations are the same, namely, the nearby
land in Philippines, Taiwan, and China Mainland
Caspian Sea/sediment PS, PE 250–500 µm µ-Raman spectroscopy detected only PS and PE in studied samples. In
(Mehdinia et al., 2020) general, the polymer types indicated lower diversity in comparison with
those reported in such areas in the world.
East Dongting Lake/sediment PET, PP, PE PS, 0.05–5 mm Eight types of MPs with different polymer compositions were identified by
(Yin et al., 2020) PA, PVC, PMMA, µ-Raman spectroscopy. The study found that the abundance of MPs in
CL the urban area sediment of Dongting Lake is lower than that of the rural
area.
Germany/soil (Paul et al., 2019) PE, PP, PS, PET < 125 µm MPs of the materials PE, PP, PS, PET, and PVC can be detected in soils
at levels of about 1 mass% after minimal conditioning, e.g., sieving and
drying of the material
Italy/white wine (Prata et al., PE 38–475 µm µ-Raman spectroscopy was used for the first time in complex beverages
2020b) in the identification of MPs particles in white wines, allowing identification
of at least one synthetic particle for each bottle, except in two cases.
Malaysia/fish meals (Karbalaei PE, PP 855.82 µm ± 1082.90SD Chemical composition of extracted MP-like particles was confirmed using
et al., 2020) µ-Raman spectroscopy. Out of 336 extracted particles, 64.3% were
plastic polymers, 25% pigment particles, 4.2% non-plastic items, and
6.5% were unidentified. Fragments were the dominant form of MPs
(78.2%) followed by filaments (13.4%) and films (8.4%).
with enthalpy changes. Enthalpy changes cannot be detected particles (Fries et al., 2013). One of the main limitations of the
in TGA and are obtainable by DSC measurements. Therefore, characterization of Py-GC-MS for MPs is the lack of particle
a combination of two methods is suggested in MPs analysis size information. Therefore, in some studies this technique has
(Golebiewski and Galeski, 2007). Many MPs can be identified, been coupled with others such as microscopy and FTIR Primpke
but for other polymers detection is impossible due to their et al. (2020), for example, compared the results of hyperspectral
overlapping phase transition signals (Majewsky et al., 2016). FTIR imaging analysis and Py-GC/MS analysis performed on
One of the analytical techniques that has been successfully a set of environmental samples that differ in complexity and
applied in the analysis of plastic materials is Py-GC-MS. It degree of microplastic contamination. With this combination,
is ideal for simultaneously identifying and quantifying the they harmonized data sets that are either mass or particle
most abundant MPs in complex samples. The semiquantitative number related.
calculation for each type of plastic present, particularly for The thermal analysis gives an alternative method to
trace concentrations (ppb or lower), represents the specific spectroscopy for some polymer’s identification. However, it is
identification of the polymer in environmental and animal a destructive technique that prevent to analyse MPs with other
samples and the external calibration curve. Research software following methods. For this reason, it is disadvantageous to use
and libraries dedicate to polymers and additives speed up these analytical methods for MPs identification, but they could be
identification. The analytical method is independent of useful for the first screening of bulk samples to be later analyzed
mechanical preselection or particle appearance, however proper by spectroscopy.
sample preparation is essential and needs to be evaluated
according to the nature and origin of the sample (Peñalver
et al., 2020). The sample, with a mass up to 350 mg, is thermally NEW APPROACHES AND NEW
degraded in an inert atmosphere and the resulting fragments of IDENTIFICATION STRATEGIES
the polymer structure can be separated by GC and characterized
by MS. As we have described above, the detection of MPs usually requires
The information obtained by the technique derives from the a microscope. However, the method still has limitations, due
type of chemical product derived from pyrolysis. Each polymer to the possibility to perform characterization and identification
is characterized by its own degradation products and ions (Lenz et al., 2015; Song et al., 2015). Therefore, it is expected
that are exploited for identification (Chen et al., 2019; Yang to be coupled with analytical techniques. An FT-IR or Raman
et al., 2019). It has advantages and limitations. First of all, the spectroscope equipped with a microscope has generally been used
method does not require any pre-treatment of the sample, it also for the chemical identification of polymers at the microscale,
allows the characterization of polymers and additives present including qualitative confirmation of polymer types (Peng et al.,
in the sample and reduces time and cost compared to other 2017; Pan et al., 2019; Mehdinia et al., 2020; Prata et al.,
solvent extraction techniques used in the analysis of marine MPs 2020b; Zhang et al., 2020). They also allow the identification
Frontiers in Toxicology | www.frontiersin.org 11 February 2021 | Volume 3 | Article 636640Mariano et al. Micro and Nanoplastics Identification FIGURE 3 | Representative confocal fluorescence microscopy images of MPs dispersed in water and stained with Nile Red. From left to right: low-density polyethylene (LDPE), polystyrene (PS), polyethylene terephthalate (PET), and polyamide (nylon). Fluorescence emission signals are acquired in the range of 520–720 nm at λex = 500 nm. The scale bar is 200 µm. This figure is reproduced from Sancataldo et al. (2020) with permission of Royal Society of Chemistry (RSC). of MPs with dimensions of tens of microns, but it is often polymers, how this substance, NR, is selectively and targeted necessary to repeat the analysis several times to obtain reliable when it comes into contact with certain chemicals (Erni-Cassola spectra of very small plastic particles. Analytical methods require et al., 2017). One of the limitations of the method is the co- expensive instruments and a very long analysis time, especially staining of natural organic material. Thus, the first step of in the case where the number of particles to be investigated the scientists was to verify, during the experimentation, that is high. This applies not only to environmental samples with the dye did not also identify products similar to MPs such as complex matrices but also to the quantification of controlled fatty substances or small fragments of wood, for this reason, laboratory experimental samples. Therefore, it is necessary to the team of researchers decided to wash the analyzed particles develop new alternative approaches that allow a quick and simple with nitric acid, a substance effective in the “digestion” of all identification of MPs both to be monitored in the field and types of biogenic material. The next step was the sampling of to be investigated in the laboratory, evaluating their toxicity, sand and water on the coast of the city of Plymounth and the accumulation, aging, etc. comparison between the measurements obtained with traditional A staining technique could provide a new alternative or methods and the new fluorescent color. The result highlighted complementary method to address these problems. “Nile Red” a greater amounts of MPs
Mariano et al.                                                                                                                         Micro and Nanoplastics Identification

   Recently, another study conducted by researchers from the                             that can be made in portable configurations for in situ water
CNR Institute of Applied Sciences and Intelligent Systems (Isasi-                        quality analysis.
Cnr) has identified a new method, called digital holography                                 This new and alternative technique has only recently been
(DH), capable of distinguishing MPs from microplankton or                                proposed, so there are no other groups in the literature that have
microalgae within marine samples (Bianco et al., 2020). Using                            adopted this method in the detection of MPs.
artificial intelligence and a holographic sensor, the method
proposed allows information to be acquired from the analyzed                             CONCLUSIONS AND FUTURE
elements thanks to the use of a holographic microscope. This
                                                                                         PERSPECTIVES
provides a wide and unprecedented range of highly distinctive
parameters that characterize MPs (Mandracchia et al., 2017;                              In recent decades, plastic has been produced and used by humans
Paturzo et al., 2018). The holographic microscope is a digital                           with increasing frequency, so much so that, to date, this material
microscope that is based on the classic principle of holography:                         has become the largest polluting anthropogenic debris in the
storage of visual information with the use of lasers whose                               environment. However, there is a lack of information about the
holographic registration is carried out through a plate. The                             presence of MPs in different environmental matrices such as their
difference is that the digital microscope projects the hologram                          effect on human health and rapid monitoring.
through a sensor and not on a plate. In addition, three-                                     Currently, there is no unique method of identification
dimensional imaging requires three laser sources in the visible                          and characterization that can be efficient for each different
range to obtain as many images, thus receiving an increase in                            case examined here. In this review, we have reported the
spatial resolution. In this way, the information acquired makes                          different techniques most used to detect and characterize MPs
it possible to “train” an artificial intelligence system, which                          in environmental samples, highlighting their advantages and
will thus be able to distinguish the polluting material from                             limitations. The combination of microscopic techniques with
other natural materials, whose dimensions and shapes are very                            analytical methods could overcome some problems highlighted.
similar to those of MPs. DH allows the problem of detecting                              Recent studies introduced other approaches that improve this
MPs present in a water sample to overcome. It is an optical                              research area as those described at the end of this review. It
technique for 3D imaging that is quantitative and completely                             is good to remember that there are still no sufficiently valid
label-free. The use of a digital camera without mechanical                               methods to identify MPs quickly and without a doubt. It is
scanning allows the recognition of transparent objects at different                      essential to develop new methods that are reliable and practical
depths, investigating the presence of MPs in large volumes of                            and that can indicate the future direction of development of
water (Merola et al., 2018). Thanks to this technique, it is                             methods and tools for identifying MPs.
possible to carry out the detection, counting and quantitative
measurement of the physical dimensions of the MPs in the entire                          AUTHOR CONTRIBUTIONS
volume. The combination of digital holography and artificial
intelligence makes possible to recognize tens of thousands of                            SM and ST write the manuscript. MF performed bibliographic
objects belonging to different classes with an accuracy > 99%.                           research. MR contributed to constructive revising of the
Moreover, the new digital holography method, provides objective                          manuscript. LD designed, write, and critically revised the
recognition of a statistically significant number of samples, up                         manuscript. All authors contributed to the article and approved
to hundreds of thousands of objects per hour, with microscopes                           the submitted version.

REFERENCES                                                                               Bradney, L., Wijesekara, H., Palansooriya, K. N., Obadamudalige, N., Bolan, N. S.,
                                                                                            Ok, Y. S., et al. (2019). Particulate plastics as a vector for toxic trace-element
Andreozzi, P., Martinelli, C., Carney, R. P., Carney, T. M., and Stellacci,                 uptake by aquatic and terrestrial organisms and human health risk. Environ.
   F. (2013). Erythrocyte incubation as a method for free-dye presence                      Int. 131:104937. doi: 10.1016/j.envint.2019.104937
   determination in fluorescently labeled nanoparticles. Mol. Pharm. 10, 875–882.        Browne, M. A., Galloway, T. S., and Thompson, R. C. (2010). Spatial patterns of
   doi: 10.1021/mp300530c                                                                   plastic debris along Estuarine shorelines. Environ. Sci. Technol. 44, 3404–3409.
Araujo, C. F., Nolasco, M. M., Ribeiro, A., and Ribeiro-Claro, P.                           doi: 10.1021/es903784e
   (2018). Identification of microplastics using Raman spectroscopy:                     Campanale, C., Massarelli, C., Savino, I., Locaputo, V., and Uricchio, V. F.
   latest developments and future prospects. Water Res. 142, 426–440.                       (2020). Detailed review study on potential effects of MPs and additives
   doi: 10.1016/j.watres.2018.05.060                                                        of concern on human health. Int. J. Environ. Res. Public Health 17:1212.
Batel, A., Borchert, F., Reinwald, H., Erdinger, L., and Braunbeck, T. (2018).              doi: 10.3390/ijerph17041212
   Microplastic accumulation patterns and transfer of benzo[a]pyrene to adult            Castañeda, R. A., Avlijas, S., Simard, M. A., and Ricciardi, A. (2014). Microplastic
   zebrafish (Danio rerio) gills and zebrafish embryos. Environ. Pollut. 235,               pollution in St. Lawrence river sediments. Can. J. Fish. Aquat. Sci. 71,
   918–930. doi: 10.1016/j.envpol.2018.01.028                                               1767–1771. doi: 10.1139/cjfas-2014-0281
Bianco, V., Memmolo, P., Carcagn, I. P., Merola, F., Paturzo, M., Distante, C.,          Catarino, A. I., Frutos, A., and Henry, T. B. (2019). Use of fluorescent-
   et al. (2020). Microplastic identification via holographic imaging and machine           labelled nanoplastics (NPs) to demonstrate NP absorption is
   learning. Adv. Intell. Syst. 2:1900153. doi: 10.1002/aisy.201900153                      inconclusive without adequate controls. Sci. Total Environ. 670, 915–920.
Bogner, A., Jouneau, P. H., Thollet, G., Basset, D., and Gauthier, C. (2007). A             doi: 10.1016/j.scitotenv.2019.03.194
   history of scanning electron microscopy developments: towards “wet-STEM”              Chen, M. F., Liu, Y. H., Lin, J. H., and Liu, C. P. (2019). Characterization
   imaging. Micron 38, 390–401. doi: 10.1016/j.micron.2006.06.008                           of a novel silicon containing hybrid polymer by thermal curing, pyrolysis

Frontiers in Toxicology | www.frontiersin.org                                       13                                            February 2021 | Volume 3 | Article 636640
Mariano et al. Micro and Nanoplastics Identification
behavior, and fluorescence analysis. J. Appl. Polym. Sci. 136:6. doi: 10.1002/app. Eyles, J. E., Bramwell, V. W., Williamson, E. D., and Alpar, H. O.
47403 (2001). Microsphere translocation and immunopotentiation in systemic
Cheng, S. Y., Bryant, R., Doerr, S. H., Wright, C. J., and Williams, P. R. tissues following intranasal administration. Vaccine 19, 4732–4742.
(2009). Investigation of surface properties of soil particles and model materials doi: 10.1016/S0264-410X(01)00220-1
with contrasting hydrophobicity using atomic force microscopy. Environ. Sci. Foley, C. J., Feiner, Z. S., Malinich, T. D., and Höök, T. O. (2018). A meta-analysis
Technol. 43, 6500–6506. doi: 10.1021/es900158y of the effects of exposure to MPs on fish and aquatic invertebrates. Sci. Total
Cole, M., Lindeque, P., Fileman, E., Halsband, C., Goodhead, R., Moger, J., Environ. 631–632, 550–559. doi: 10.1016/j.scitotenv.2018.03.046
et al. (2013). Microplastic ingestion by zooplankton. Environ. Sci. Technol. 47, Fries, E., Dekiff, J. H., Willmeyer, J., Nuelle, M.-T., Ebert, M., and Remy, D. (2013).
6646–6655. doi: 10.1021/es400663f Identification of polymer types and additives in marine microplastic particles
Corami, F., Rosso, B., Bravo, B., Gambaro, A., and Barbante, C. (2020). A using pyrolysis-GC/MS and scanning electron microscopy. Environ. Sci. Proc.
novel method for purification, quantitative analysis and characterization Improv. 15, 1949–1956. doi: 10.1039/c3em00214d
of microplastic fibers using micro-FTIR. Chemosphere 238:124564. Fu, W., and Zhang, W. (2017). Hybrid AFM for nanoscale physicochemical
doi: 10.1016/j.chemosphere.2019.124564 characterization: recent development and emerging applications. Small
Dawson, A., Huston, W., Kawaguchi, S., King, C., Cropp, R., Wild, S., et al. 13:1603525. doi: 10.1002/smll.201603525
(2018). Uptake and depuration kinetics influence microplastic bioaccumulation Fu, W., and Zhang, W. (2018). Measurement of the surface hydrophobicity
and toxicity in antarctic Krill (Euphausia superba). Environ. Sci. Technol. 52, of engineered nanoparticles using an atomic force microscope. PCCP 20,
3195–3201. doi: 10.1021/acs.est.7b05759 24434–24443. doi: 10.1039/C8CP04676J
Dazzi, A., and Prater, C. B. (2017). AFM-IR: technology and applications in Gagné, F., Auclair, J., and Quinn, B. (2019). Detection of polystyrene nanoplastics
nanoscale infrared spectroscopy and chemical imaging. Chem. Rev. 117, in biological samples based on the solvatochromic properties of Nile red:
5146–5173. doi: 10.1021/acs.chemrev.6b00448 application in Hydra attenuata exposed to nanoplastics. Environ. Sci. Pollut.
Dazzi, A., Saunier, J., Kjoller, K., and Yagoubi, N. (2015). Resonance Res. Int. 26, 33524–33531. doi: 10.1007/s11356-019-06501-3
enhanced AFM-IR: a new powerful way to characterize blooming Gaston, E., Woo, M., Steele, C., Sukumaran, S., and Anderson, S. (2020).
on polymers used in medical devices. Int. J. Pharm. 484, 109–114. MPs differ between indoor and outdoor air masses: insights from
doi: 10.1016/j.ijpharm.2015.02.046 multiple microscopy methodologies. Appl. Spectrosc. 74, 1079–1098.
Deng, Y., Zhnag, Y., Lemos, B., and Ren, H. (2017). Tissue accumulation of MPs doi: 10.1177/0003702820920652
in mice and biomarker responses suggest widespread health risks of exposure. Giese, B., Klaessig, F., Park, B., Kaegi, R., Steinfeldt, M., Wigger, H., et al.
Sci. Rep. 7:46687. doi: 10.1038/srep46687 (2018). Risks, release and concentrations of engineered nanomaterial in the
Di, M., Liu, X., Wang, W., and Wang, J. (2019). Manuscript prepared for environment. Sci. Rep. 8:1565. doi: 10.1038/s41598-018-19275-4
submission to environmental toxicology and pharmacology pollution in Gigault, J., Baudrimont, M., Pascal, P., Gauffre, F., Phi, T., El Hadri, H., et al.
drinking water source areas: MPs in the Danjiangkou Reservoir, China. (2018). Current opinion: what is a nanoplastic? Environ. Pollut. 235, 1030–1034.
Environ. Toxicol. Pharmacol. 65, 82–89. doi: 10.1016/j.etap.2018.12.009 doi: 10.1016/j.envpol.2018.01.024
Ding, J., Li, J., Sun, C., Jiang, F., Ju, P., Qu, L., et al. (2019). Detection of Golebiewski, J., and Galeski, A. (2007). Thermal stability of nanoclay
microplastics in local marine organisms using a multi-technology system. Anal. polypropylene composites by simultaneous DSC and TGA. Compos. Sci.
Methods 11, 78–87. doi: 10.1039/C8AY01974F Technol. 67, 3442–3447. doi: 10.1016/j.compscitech.2007.03.007
Dini, L., Panzarini, E., Mariano, S., Passeri, D., Reggente, M., Rossi, M., et al. (2015). Guo, C., Luo, X., Zhou, X., Shi, B., Wang, J., Zhao, J., et al. (2017).
Microscopies at the nanoscale for nano-scale drug delivery systems. Curr. Drug Quantitative analysis of binary polymorphs mixtures of fusidic acid by
Targets 16, 1512–1530. doi: 10.2174/1389450116666150531160851 diffuse reflectance FTIR spectroscopy, diffuse reflectance FT-NIR spectroscopy,
Duis, K., and Coors, A. (2016). MPs in the aquatic and terrestrial environment: Raman spectroscopy and multivariate calibration. J. Pharm. Biomed. Anal. 140,
sources (with a specific focus on personal care products), fate and effects. 130–136. doi: 10.1016/j.jpba.2017.02.053
Environ. Sci. Eur. 28:2. doi: 10.1186/s12302-015-0069-y Haggerty, L., and Lenhoff, A. M. (1993). STM and AFM in biotechnology.
Dussud, C., Meistertzheim, A. L., Conan, P., Pujo-Pay, M., George, M., Fabre, P., Biotechnol. Prog. 9, 1–11. doi: 10.1021/bp00019a001
et al. (2018). Evidence of niche partitioning among bacteria living on plastics, Hahladakis, J. N., Velisa, C. A., Weberb, R., Iacovidoua, E., and Purnella, P. (2018).
organic particles and surrounding seawaters. Environ. Pollut. 236, 807–816. An overview of chemical additives present in plastics: migration, release, fate
doi: 10.1016/j.envpol.2017.12.027 and environmental impact during their use, disposal and recycling. J. Hazard
Eerkes-Medrano, D., Thompson, R. C., and Aldridge, D. C. (2015). MPs Mater. 344, 179–199. doi: 10.1016/j.jhazmat.2017.10.014
in freshwater systems: a review of the emerging threats, identification of Hanna, S. K., Cooksey, G. A., Dong, S., Nelson, B. C., Mao, L., Elliott, J.
knowledge gaps and prioritisation of research needs. Water Res. 75, 63–82. T., et al. (2016). Feasibility of using a standardized Caenorhabditis elegans
doi: 10.1016/j.watres.2015.02.012 toxicity test to assess nanomaterial toxicity. Environ. Sci. Nano 3, 1080–1089.
Egerton, R. F. (2011). Electron Energy-Loss Spectroscopy in the Electron doi: 10.1039/C6EN00105J
Microscope. Boston, MA: Springer Science and Business Media. Hanna, S. K., Montoro Bustos, A. R., Peterson, A. W., Reipa, V., Scanlan,
doi: 10.1007/978-1-4419-9583-4 L. D., Hosbas Coskun, S., et al. (2018). Agglomeration of Escherichia coli
Elert, A. M., Becker, R., Duemichen, E., Eisentraut, P., Falkenhagen, J., Sturm, H., with positively charged nanoparticles can lead to artifacts in a standard
et al. (2017). Comparison of different methods for MP detection: what can caenorhabditis elegans toxicity assay. Environ. Sci. Technol. 52, 5968–5978.
we learn from them, and why asking the right question before measurements doi: 10.1021/acs.est.7b06099
matters? Environ. Pollut. 231, 1256–1264. doi: 10.1016/j.envpol.2017.08.074 Harrison, J. P., Ojeda, J. J., and Romero-González, M. E. (2012). The applicability
Elliott, J. T., Rösslein, M., Song, N. W., Toman, B., Kinsner-Ovaskainen, A., of reflectance micro-Fourier-transform infrared spectroscopy for the detection
Maniratanachote, R., et al. (2017). Toward achieving harmonization in a nano- of synthetic MPs in marine sediments. Sci. Total Environ. 416, 455–463.
cytotoxicity assay measurement through an interlaboratory comparison study. doi: 10.1016/j.scitotenv.2011.11.078
ALTEX 34, 201–218. doi: 10.14573/altex.1605021 Heinlaan, M., Kasemets, K., Aruoja, V., Blinova, I., Bondarenko, O., Lukjanova, A.,
Eriksen, M., Mason, S., Wilson, S., Box, C., Zellers, A., Edwards, W., et al. (2013). et al. (2020). Hazard evaluation of polystyrene nanoplastic with nine bioassays
Microplastic pollution in the surface waters of the Laurentian Great Lakes. Mar. did not show particle-specific acute toxicity. Sci. Total Environ. 707:136073.
Pollut. Bull. 77, 177–182. doi: 10.1016/j.marpolbul.2013.10.007 doi: 10.1016/j.scitotenv.2019.136073
Erni-Cassola, G., Gibson, M. I., Thompson, R. C., and Christie-Oleza, J. A. (2017). Hidalgo-Ruz, V., Gutow, L., Thompson, R. C., and Thiel, M. (2012). MPs in
Lost, but found with Nile red: a novel method for detecting and quantifying the marine environment: a review of the methods used for identification and
small MPs (1 mm to 20 µm) in environmental samples. Environ. Sci. Technol. quantification. Environ. Sci. Technol. 46, 3060–3075. doi: 10.1021/es2031505
51, 13641–13648. doi: 10.1021/acs.est.7b04512 Iannilli, V., Pasquali, V., Setini, A., and Corami, F. (2019). First evidence of
Ettinger, A., and Wittmann, T. (2014). Fluorescence live cell imaging. Methods Cell. MPs ingestion in benthic amphipods from Svalbard. Environ. Res. 179:108811.
Biol. 123, 77–94. doi: 10.1016/B978-0-12-420138-5.00005-7 doi: 10.1016/j.envres.2019.108811
Frontiers in Toxicology | www.frontiersin.org 14 February 2021 | Volume 3 | Article 636640You can also read