Insurance Expansions and Hospital Utilization: Relabeling and Reabling? - Bureau of ...
←
→
Page content transcription
If your browser does not render page correctly, please read the page content below
Insurance Expansions and Hospital Utilization:
                   Relabeling and Reabling?
                             Abe Dunn,∗ Matthew Knepper,† and Seidu Dauda‡

                                            March 22, 2021

           The 2010 Patient Protection & Affordable Care Act (ACA) significantly expanded
       access to private and public health insurance for low-income individuals through income-
       based subsidies and income-based eligibility expansions, respectively. In this paper, we
       use the universe of hospitals from 2009-2015 to characterize how these expansions
       affected the financing of hospital visits, along with price, utilization, and potential
       spillovers in the quality of care. The insurance coverage expansions generated a shift
       in the composition of payers and a modest increase in the utilization of hospital out-
       patient services. While concerns have been raised that these shifts in utilization could
       cause negative spillovers to the already insured population (e.g., Medicare enrollees),
       we find no significant change in the quality of care experienced by those already insured.
       The primary result of both federally funded insurance expansions was to increase the
       profits generated and prices charged by the hospitals providing such services.

       Key Words: Affordable Care Act, Medicaid Expansions, Uncompensated Care

       JEL Codes: H51, I13, I18

   ∗
     Bureau of Economic Analysis. email: Abe.Dunn@bea.gov
   †
     University of Georgia. email: mknepper@uga.edu
   ‡
     The World Bank. email: sdauda@worldbank.org
     Declaration of interests: none. Please note that the views expressed in this paper are solely those of the
authors and do not necessarily reflect the views of the Bureau of Economic Analysis or the World Bank.
We would like to thank various participants at the International Health Economics Association Conference,
the Western Economic Association International Conference, and the 2017 BEA-Census Joint Workshop for
their insightful comments, including Nathan Blascak, Alice Ellyson, Kevin Chiu, Kristin McCue, and others.
We would also like to thank Lasanthi Fernando for research assistance and providing useful comments.

                                                      1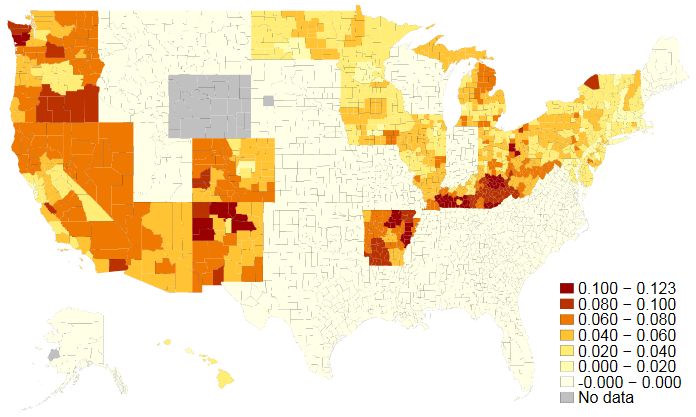
1       Introduction
Upon the passage and subsequent implementation of the Patient Protection & Affordable
Care Act (ACA) in 2010, nearly 20 million Americans gained access to health insurance for
the first time (Garrett and Gangopadhyaya, 2016). The effects of such a momentous influx of
new patients onto this uniquely important market have been the subject of relentless political
and academic debate. Although considerable attention has been devoted to the insurance
gains begotten by the Medicaid expansion component of the ACA, the establishment of
private market insurance subsidies has accounted for no less than 40% of the overall coverage
gains resulting from the law’s implementation (Frean et al., 2017). However, markedly less
focus has been placed upon how these gains may have impacted utilization behaviors and
the prices faced by patients, both new and old, as well as the financial health of hospitals. In
this paper, we chip away at these questions by studying how the dual insurance expansions
have affected the provision of hospital-based care along the price and quantity dimensions.
In light of the many changes occurring as a result of the law, we also investigate potential
spillovers to the quality of care received by the patient population that was already insured
pre-ACA. A better understanding of how this surge in newly insured patients affects the
hospital industry is critical for gauging the impact of the new law as hospitals account for
approximately 47 percent of health care services consumed.1
    Many papers studying the effects of the ACA often focus on the impact in a particular
state (e.g., Duggan et al. (2019a) examining Calfornia, or Baicker and Finkelstein (2011);
Finkelstein et al. (2012); Taubman et al. (2014), who study the Oregon Health Insurance
Experiment) or rely on state-level variation in Medicaid expansion decisions (Courtemanche
et al., 2016; Pines et al., 2016; Kaestner et al., 2017). In contrast, our paper focuses measure-
ment on hospitals across the entire U.S. and identifies the impact of the law by exploiting
county-level variation in the degree to which the population is exposed to the Medicaid
expansion and to private, non-group premium subsidies.2 To gain an even more precise
measure of the reform’s impact on individual hospitals, we combine these exposure variables
with patient flow data to estimate the fraction of a hospital’s patient population that gains
insurance through the ACA reforms. Using these precisely targeted measures, we examine
the effects of the insurance expansions on utilization, the financing of care, and the poten-
tial for spillovers in the quality of care received by the already insured population. Our
    1
     It accounts for roughly 37 percent of total health care consumption expenditures, including prescription
drugs and other medical care goods.
   2
     Our approach overlaps most completely with that of Courtemanche et al. (2019a), who exploit local
variation in the pretreatment uninsured rate to identify the effect of ACA insurance expansions on risky
health behaviors.

                                                     2
paper adds to the substantial yet growing literature on the effects of health insurance expan-
sions on hospital utilization, and on how such care is financed (Manning et al., 1987; Miller,
2012a,b; DeLeire et al., 2014; Rudowitz and Garfield, 2015; Anderson et al., 2016; Blavin,
2016; Kaufman et al., 2016; Nikpay et al., 2016). We also contribute to the more recent
literature examining potential spillover effects of insurance expansions on the outcomes of
patient populations that are not directly affected by the ACA (McInerney et al., 2017; Glied
and Hong, 2018; Carey et al., 2020).
We find that the ACA insurance expansions, which lowered the cost of care for millions of
newly insured individuals, led to a modest increase in outpatient hospital visits following the
passage of the new law. The effect on utilization is consistent with a large body of literature
on the effects of insurance expansions, including evidence from the Oregon Health Insurance
Experiment (Baicker and Finkelstein, 2011; Finkelstein et al., 2012; Taubman et al., 2014)
and prior ACA evidence (Pines et al., 2016; Duggan et al., 2019a). The outpatient utilization
effects are also consistent with Garthwaite et al. (2019), who examine hospital claims level
data from 20 states and show that even the most recent round of Medicaid expansions
generated heterogeneous utilization effects across states, varying positively with the size of
the group gaining coverage and negatively with the pre-expansion level of uncompensated
care costs.3 Unlike Garthwaite et al. (2019), however, we do not find convincing evidence
that the recent round of insurance expansions increased the use of inpatient care.
The effects on emergency department care are ambiguous. While the cost of emergency
care falls for newly insured individuals, the use of primary care services could potentially
offset this effect. We find no evidence of a change in emergency department visits, which is
consistent with the Oregon Health Insurance (Baicker and Finkelstein, 2011; Finkelstein et
al., 2012; Taubman et al., 2014) and prior ACA evidence (Pines et al., 2016). Our results
contrast with Miller (2012a,b), who find that insurance provision decreased the incidence
of emergency department visits without sacrificing health outcomes, an apparent efficiency
gain. Our results also differ from that of Duggan et al. (2019a), who find evidence of increases
in emergency department visits caused by the Medicaid insurance expansion in California.
One potential reason for the divergence of our results with that of Duggan et al. (2019a)
is that unlike in our paper, they use individual claims data, which allows them to observe
outcomes specifically for the 21-64 year-old age group targeted by the reforms. By contrast,
our hospital-level results necessarily include outcomes for unaffected groups, and so our
estimated effects are a percent increase relative to a larger base. The magnitudes of our
3
Our identification strategy, indeed, also exploits this former source of heterogeneity to produce our main
estimates. While we use variation in exposure to the ACA across counties, Garthwaite et al. (2019) use even
finer variation at the zip-code level.
3percent change estimates accordingly fall below those of Duggan et al. (2019a).
While we estimate that the effects on total hospital utilization are modest, we find that the
law’s primary impact was to produce both a shift in how hospital care has been financed–from
uncompensated care to Medicaid and private payers–and an increase in prices and profits as
reimbursement rates have become relatively more lucrative. The positive effects on prices,
revenues, and profits are primarily driven by the Medicaid expansion, which matches the
results from Duggan et al. (2019a) in the case of California. The concordance of our results
with Duggan et al. (2019a) related to the pricing and financing of hospital services suggests
the effects they find in California may be more generalizable to the effects of the ACA more
broadly. In fact, we find nearly identical results, even after excluding California from our
sample. Our results also corroborate and complement earlier evidence of the ACA effects on
hospital finances (Blavin, 2016; Pines et al., 2016; Freedman et al., 2017).
In addition to altering patterns of utilization and hospital financing, the changes created
by the ACA insurance expansions have raised concerns of potential spillover effects that could
impact the quality of care for the population already insured prior to the ACA. As discussed
in Carey et al. (2020), the potential negative spillover effects could arise if the expansion
overburdened the health care system and affected outcomes for those already insured. Carey
et al. (2020) examine the potential negative spillovers on utilization for the Medicare pop-
ulation and find no effects on primary care services. On the other hand, McInerney et al.
(2017) find evidence of spillover effects from Medicaid expansions in the 2000s that reduced
spending within the Medicare population but find no effects on the quality of care. Glied and
Hong (2018) also find that prior insurance expansions generate negative spillover effects on
the utilization for the Medicare population. Although not directly concerned with spillover
effects, Kolstad and Kowalski (2012) find that the Massachusetts Health Reform insurance
expansion reduced the length of hospital inpatient stays.
While this literature focuses on negative spillovers, it is also possible for positive spillovers
to arise from the ACA, as hospitals may improve quality to compete for a newly-insured
and more profitable patient population. We examine potential spillover effects on hospital
services by primarily focusing on the already insured Medicare population. We find that
the influx of newly-insured patients has no effect on Medicare inpatient utilization and no
effect on a diverse set of quality indicators including measures of mortality and readmissions
for the Medicare patient population. We also find no effects on quality for the full patient
population based on patient surveys and process of care measures (i.e., does hospital follow
standard medical care protocols?). Thus, this paper contributes to the spillover literature
by showing that the public and private insurance expansions have no effect on the quality
of care for those already insured, as is consistent with McInerney et al. (2017).
4It should be emphasized that these quality measures do not capture changes in the
health of the newly-insured population, but only changes in the quality of the treatment
provided. Indeed, recent research by Sommers et al. (2012); Sommers (2017); Goldin et al.
(2021); Miller et al. (forthcoming) detect significant decreases in mortality for the Medicaid
population following state Medicaid expansions.
The remainder of the paper proceeds as follows. The next section briefly summarizes
the reforms. Section 3 describes the data sources from which the study sample is extracted,
Section 4 lays out the identification assumptions and strategy, and Section 5 details how
the insurance expansions affected healthcare utilization, prices, and finances. Section 6
ties together the study’s findings by directly linking federal dollars provided for insurance
expansions with hospital revenues, and then decomposing them into utilization and price
effects. Finally, Section 7 provides some closing remarks and illuminates promising avenues
for future research on these and related topics.
2 Background
The ACA was a major legislative reform intended to transform several aspects of the U.S.
health care system. Facing an uninsurance rate of 16.3 percent in 2010,4 one of the primary
goals of the law was to increase coverage by expanding access to both private and public
health insurance.
As originally written, the law set out to increase public coverage through the expansion
of Medicaid eligibility for all non-Medicare eligible individuals under the age of 65 with
incomes up to 138 percent of the federal poverty line (FPL). A 2012 Supreme Court ruling
upheld the constitutionality of the expansion, but limited the ability of the U.S. Department
of Health and Human Services agency to enforce it, leaving the decision of whether to
expand Medicaid coverage to the states.5 As of January 2014, when the Medicaid expansion
initially took effect, 25 states opted to expand Medicaid eligibility (including the District
of Columbia).6 The geographic differences in adoption of the Medicaid expansion generated
differential effects of the law on coverage rates across areas.
A separate provision of the law expanded private insurance coverage by providing means-
tested subsidies to eligible individuals to be applied toward purchasing insurance plans on
the incipient exchanges. Specifically, individuals and families earning between 100 percent
to 400 percent of the FPL, and who are ineligible for Medicaid coverage, would qualify for
4
This is based on the 2011 Current Population Survey, which indicates that there were 49.9 million
uninsured individuals out of a population of 306.1 million.
5
See National Federation of Independent Business v. Sebelius 567 U.S. 519 (2012).
6
However, several states, such as CA, DC, MN, and WA, had elected to expand earlier than 2014.
5these government-provided subsidies. The subsidy amount is determined according to a
sliding scale, so that as an individual’s income rises, the subsidy amount falls. For example,
individuals and families earning up to 133 percent of the FPL would receive a subsidy limiting
the amount they would need to pay toward premiums to no more than 2.5 percent of their
income. Those whose incomes are between 300 and 400 percent of the FPL, by contrast,
are required to pay no more than around 9.5 percent of their income toward premiums.7
When income rises above 400 percent of the FPL, the subsidy is eliminated completely.
While private insurance subsidies were made available across the country, the law will tend
to affect more dramatically those areas with a higher share of individuals in the targeted
income range, and who would have remained uninsured absent the insurance subsidies.
The size and scope of the ACA insurance expansions may have also engendered changes
to different facets of hospital operations. The expansions could have affected the provision
of services, prices, and the finances of hospitals in numerous ways. The increase in insurance
eligibility and coverage may have increased the use of medical care services at hospitals, as
the out-of-pocket price of treatment would have fallen for newly-insured individuals. Given
that Medicaid payments are lower than the private sector payments, but higher than uncom-
pensated care, the effect of the Medicaid expansion on hospital profits should be positive.
The average prices paid by private insurers tend to be even higher and so an expansion of
these types of payers should have also increased hospital prices and profits. Moreover, unlike
with Medicare and Medicaid, the prices paid by non-public payers are affected by market
forces, as the short-term capacity of hospitals is limited and insurers must compete for access
to hospital services.
All of these changes have potential implications for spillovers on the quantity and quality
of treatment for the already insured population, but the expected direction of any effect
is unclear. The greater utilization of hospital and physician services could strain resources
and reduce the quality of care, affecting the quality of care for Medicare enrollees and other
already privately-insured patients. The lower payment rates received from Medicaid pa-
tients, relative to those received from the privately insured, could also drive the quality of
treatment down as hospitals attempt to control costs. Alternatively, the ACA could lead to
greater incentives to improve quality to attract a newly-insured and more profitable patient
population.
7
More precisely, the subsidy amount, in turn, is determined by the premium of the second lowest cost
silver plan in the area.
63 Data and Sample Construction
3.1 American Community Survey Data
Though Medicaid expansion decisions were made at the state-level, we construct county-
level measures of exposure to the Medicaid expansion by calculating, for each county, the
fraction of the population comprised of low-income individuals who would have become newly
eligible for Medicaid; that is, those earning less than their state’s Medicaid income eligibility
limit (typically 138% of the Federal Poverty Line) but more than their state’s pre-ACA
Medicaid income eligibility limit and who were uninsured during the last pre-reform year. In
states that opted out of the Medicaid expansion in 2014-2015, this treatment variable equals
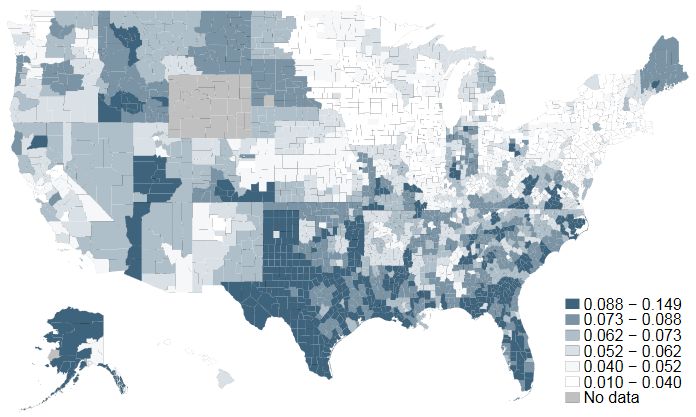
0. Figure 1 shows the geographic distribution of this exposure measure across the United
States. Constructing the treatment in this way allows us to exploit both across and within-
state heterogeneity in the expected impact of the public insurance expansion. To capture
variation in exposure to private market subsidies, we similarly construct a county-based
measure of the fraction of the population made up of individuals in this intermediate income
range (those earning between one and four times the Federal Poverty Level who are also
ineligible to receive insurance through their state’s Medicaid program) who are uninsured
just prior to the ACA’s private market exchange rollout. The geographic distribution of
this latter treatment, in turn, is depicted in Figure 2. Combining state expansion decisions
with county-level data on pre-reform income levels, Duggan et al. (2019b) employ a similar
strategy for examining the effects of insurance expansions, though they focus primarily on
labor market outcomes.
We use American Community Survey (ACS) data from the 2009-2013 five-year sample
to construct our baseline controls and eligibility measures in the pre-reform period. We
construct our main treatment variables–exposure to Medicaid eligibility and exposure to
private market subsidies–by feeding 2013 county demographic data through 2014 and 2015
insurance eligibility rules for the uninsured population, similarly to how Courtemanche et
al. (2019a) construct uninsured rates for MSAs in 2013, the last pre-reform year. We assess
future eligibility for both Medicaid and private subsidies in this way, rather than using
contemporaneous measures of eligibility at the time of ACA adoption. We use data from
prior years because previous research has uncovered mixed evidence on how labor supply
responds to altering the availability of public insurance, which in turn directly impacts the
very income measures used to assess eligibility (Garthwaite et al., 2014; Shi, 2016; Kaestner
et al., 2017). Thus, our approach avoids conflating our eligibility measures with policy-
induced changes in income that might otherwise affect the size of the group who meets the
relevant standards. In Appendix A.1, we further incorporate 2014 and 2015 ACS data on
7Figure 1: The above map shows county-level variation in the level of exposure to the Medicaid
expansion by 2015. That is, each county is shaded in proportion to the fraction of individuals
who are earning less than their state’s 2015 Medicaid eligibility threshold and are uninsured.
Medicaid and private insurance participation in order to assess both the predictive power of
our treatment variables and the extent to which any crowd-out may have occurred.
For descriptive purposes, we further partition our sample of hospitals according to the
intensity of treatment of the counties in which they are located on both the public and
private subsidy eligibility margins. Specifically, we split counties (and associated hospitals)
according to whether the population lies above or below the median level of eligibility for
participation in ACA-commissioned Medicaid expansions, which equals approximately 5.1%
in the sample. Doing so allows for a comparison of how the outcome variables change over
time for three distinct groups: a ‘no exposure’ group (counties in a non-expansion state), a
‘low exposure’ group (counties in expansion states but fall below the median level of Medicaid
eligibility), and a ‘high exposure’ group (counties that exceed the median level of Medicaid
eligibility). We use a similar procedure to characterize counties that are less or more exposed
to exchange subsidies; here, the median fraction of the population eligible to receive such
subsidies is 6.5%.
8Figure 2: The above map shows county-level variation in the level of exposure to the private
non-group insurance expansion by 2015. That is, each county is shaded in proportion to the
fraction of individuals who are earning between one and four times the federal poverty level,
are ineligible for Medicaid, and are uninsured.
3.2 American Hospital Association Survey and Center for Medi-
care and Medicaid Services Healthcare Cost Report Data
The study’s primary outcome measures are extracted from two separate but interconnected
sources of U.S. hospital data; the American Hospital Association (AHA) Survey and the
Center for Medicare and Medicaid Services Healthcare Cost Reporting Information System
(HCRIS). Each data source includes approximately 4,000 hospitals covering the periods
between 2009 and 2015. The AHA Survey captures a variety of hospital utilization measures
while the HCRIS data include summary measures from hospital financial reports such as
costs, revenues, and profits–some of which are aggregated by payer. Both are national
samples that include the full population of hospitals residing in the U.S. and its territories,
although AHA survey response rates are missing for some small, rural hospitals.8
The AHA Survey includes hospital identifiers alongside a plethora of institutional details,
8
Perez and Friedman (2017), who use the HCRIS data to the exclusion of the AHA Surveys, cite previously
documented evidence of reporting biases in the AHA survey. In particular, survey compliance rates among
small, rural hospitals are relatively low, which artificially suppresses their prevalence in the data (Mullner
and Chung, 2002; Schrag et al., 2002).
9such as total annual expenditures, the components of those expenditures (wages, facility ex-
penses, depreciation, etc.), staffing levels by occupation, hospital type (non-profit, for-profit,
and federal), bed counts, and the location of each hospital. Additionally, these data include
utilization measures such as yearly discharges, emergency department visits, inpatient days
and visits, and outpatient visits. We construct our primary dependent variables from these
measures.
Specifically, we track the annual number of inpatient visits by payer type, including the
annual number of inpatient visits financed by private (non-public) payers, those financed
by Medicaid, and those financed by Medicare, the residual category. By aggregating across
payer types, we are also able to track the total annual number of inpatient visits. While we
are able to separate inpatient visits by payer type, the AHA Survey does not disaggregate
other types of utilization by payer. Thus, we track aggregated measures of outpatient visits,
emergency department visits, non-emergent visits, and total utilization, which combines
outpatient and inpatient visits in the manner detailed in Section 4.
The HCRIS data are comprised of a national census of hospital financial reports. These
data include a detailed set of annual revenue and cost measures, such as the cost of un-
compensated care, the cost of Medicaid patients, total operating expenses, and net patient
revenue. Our primary set of outcomes include annual measures of total patient revenue,
operating expenses, and the profit margin, which is the ratio of total hospital revenues to
costs. These two data sources, in turn, are combined to produce price per episode of care,
the details of which also appear in Section 4.
Table 1 presents summary statistics on hospital utilization and finances before the roll-
out of the 2014 Medicaid expansions and private health insurance exchanges according to
the intensity of the private subsidy availability treatment in each county. It also displays
analogous summary statistics for hospitals based on their enveloping counties’ exposure to
ACA-generated increases in public insurance availability. While there exists substantial
differences in pre-reform levels across most utilization and finances measures by level of ex-
posure to the law, our difference-in-differences strategy requires only that the trends in these
outcome variables do not differ prior to the implementation of the treatment. Assessment of
the validity of this parallel trends assumption is deferred until Section 5.
3.3 Hospital Compare data
Several hospital quality measures are derived from the CMS Hospital Compare Database.
The database includes more than 4,000 Medicare-certified hospitals, from which we cull the
quality measures available surrounding the reform, from 2011 to 2016. The reported quality
10Table 1: Pre-ACA Summary Statistics, by Exposure to each Insurance Expansion
Medicaid exposure Private exposure
none low high low high
(1) (2) (3) (4) (5)
Inpatient
Non-public Visits 12,477 15,406 12,419 14,832 11,527
[20,514] [21,866] [17,225] [20,698] [19,454]
Medicaid Visits 8,571 11,458 9,801 10,542 8,650
[15,163] [21,555] [16,662] [19,129] [16,376]
Non-public Share IP Days 0.296 0.313 0.289 0.305 0.292
[0.161] [0.181] [0.135] [0.143] [0.178]
Medicaid Share IP Days 0.179 0.193 0.206 0.187 0.192
[0.163] [0.192] [0.166] [0.160] [0.184]
Total Visits 38,968 47,914 39,478 46,145 36,429
[53,860] [62,271] [48,009] [58,307] [50,753]
General
Total OP Visits 135,422 185,594 149,516 186,131 115,883
[204,868] [250,031] [246,595] [260,532] [183,041]
ED Visits 28,469 30,833 29,189 31,062 27,363
[32,271] [33,082] [29,097] [31,604] [31,795]
Total Admissions 7,380 8,629 7,886 8,669 6,943
[10,034] [10,863] [9,282] [10,532] [9,529]
Days per Admission 9.339 8.857 8.099 8.786 9.040
[27.711] [16.435] [25.199] [22.009] [27.122]
ψ
Total Utilization 77,422 100,615 81,934 98,998 69,335
[102,327] [121,784] [108,654] [121,747] [92,877]
Finances
φ
Patient Revenue 152 206 177 202 141
[235] [310] [265] [298] [221]
Operating Expenses φ 147 210 174 202 137
[236] [327] [264] [306] [222]
Profit Margin 1.120 1.102 1.109 1.114 1.111
[0.528] [0.459] [0.542] [0.690] [0.209]
Uncompensated Care Cost φ 7.373 6.414 7.980 6.657 7.923
[22.0] [13.2] [62.4] [15.4] [47.9]
Uncompensated Care Share 0.048 0.034 0.040 0.033 0.052
[0.048] [0.053] [0.063] [0.036] [0.065]
Total Medicaid Costs φ 15.1 24.4 24.5 22.7 21.4
[35.4] [53.5] [130] [48.2] [37.6]
Hospitals 2,138 1,120 1,116 2,227 2,147
Counties 1,330 642 571 1,157 1,250
Each cell reports the average pre-2014 annual values [standard deviations] of the vari-
able indicated in the first column. Column (1) reflects values for the average hospital
in a county with no Medicaid expansion, Column (2) does so for those with below-
median Medicaid expansion exposure, and Column (3) for those with above-median
Medicaid expansion exposure. Columns (4) and (5) report corresponding values for
hospitals with below and above median-level exposure to the private expansions. All
values are derived from the 2009-2013 HCRIS and AHA databases.
ψ
Total Utilization is calculated by taking the revenue-weighted sum of inpatient and
outpatient visits, where outpatient visits are weighted by the ratio between revenue
generated by one outpatient day to that generated by one inpatient day.
φ
Values listed in millions of dollars.
11measures are all built from retrospective data and are typically lagged one year, so that the
quality measures contained in the 2011 to 2016 Hospital Compare Database pertain to the
time period from 2010 to 2015. Since quality effects may propagate relatively slowly and
because some of the quality measures use multiple years of data, we remove the data that
covers the 2014 period and focus on quality measures from 2015.
There are a large variety of measure types available through the Hospital Compare
Database. The quality measures fall into four categories: (1) mortality; (2) process; (3)
readmission; and (4) patient surveys. Both the readmission and mortality measures are
constructed from the Medicare Fee-for-Service population claims, while the process-based
measures (i.e., are hospitals following best practices?) and patient surveys cover the entire
hospital patient population. Notably, other ACA reforms enacted simultaneously with the
insurance expansions–such as the Hospital Readmissions Reduction Program (HRRP), Hos-
pital Value Based Purchasing Program, and Bundled payments program–also targeted the
same readmissions and mortality outcomes measured in the Hospital Compare data. Thus,
we think it prudent to place less weight on all results pertaining to the mortality and read-
missions measures because it is not possible to disentangle insurance expansion effects from
those yielded by these other ACA quality-based initiatives.9
Even still, viewing any of the quality measures in isolation is potentially problematic,
either because of small sample sizes or because the focus of the measure is overly narrow
(e.g., a patient survey question about nurse communication). We circumvent this issue by
constructing quality indices that capture these four different dimensions of quality. The
indexes are constructed in a way that retains the maximum number of indicators for each
hospital, where higher measures correspond to poorer quality for mortality, process measures,
and readmissions but reflect superior quality for the patient survey-based index.10 Sections
A.2 and A.3 of the Appendix contains a more detailed discussion of how the study’s quality
indices are formed along with the complete list of the variables used to construct them. Also
in Appendix Section A.4 is Table A5, which shows the summary statistics for each of the four
main Hospital Compare quality indices. Note that the process measures are slightly skewed
toward higher-quality scores and that both the range and standard deviation are smaller than
for the other quality indices. This suggests that there is less variation in hospital quality
along the process measure dimension than for the patient survey, readmission, or mortality
measures.
As we do not have information solely on individuals that gained coverage through the
9
We thank an anonymous referee for bringing to our attention this important caveat.
10
Since the available measures for mortality, process measures, and readmission measures fluctuate over
time, we construct a second set of indices for 2013 forward that reflect a wider range of indicators, sacrificing
the length of the panel for the breadth of outcomes.
12ACA, all of these quality measures capture spillover effects. The readmission and mortality
measures are based on Medicare data, so they are limited to spillover effects on the Medicare
population. While the other measures are based on the broader hospital patient population,
most of this population was already insured prior to the ACA, so these should also be
considered spillover measures as well.
3.4 Quality Measures from Medicare Claims Data
As a final check on spillover effects on quality, we incorporate quality measures from a 5%
national sample of CMS Medicare claims data. Specifically, we construct from the 2010-2015
sample of claims a 30-day, 60-day, and 90-day mortality index for those patients suffering
from 18 different “non-deferrable” acute conditions for which mortality is relatively common
among the Medicare population, such as intracerebral hemorrhages, cerebral artery occlu-
sions, convulsions, head injury, and fractures of the neck (Card et al., 2009; Ballard et al.,
2010; Garthwaite et al., 2017).11 Because other quality-based ACA initiatives targeted mor-
tality for acute myocardial infarction (AMI), heart failure, and pneumonia, we are careful
to avoid estimating effects on outcomes for patients suffering from these afflictions as in-
cluding them may lead us to misattribute the changes in health to the insurance expansion,
rather than the quality-based initiatives. This is especially likely as hospitals in lower income
markets are also the ones that experienced the largest gains in coverage and were also more
vulnerable to penalization under the Hospital Value Based Purchasing (HVBP) program, for
example.12 After pooling the sample across these five years, we retain mortality outcomes
for approximately 390,000 Medicare patients distributed across nearly 4,000 hospitals.13
These data offer several advantages over much of the Hospital Compare data. First, the
outcomes are relatively easy to interpret because they reflect simple mortality rates. Second,
by using individual level data, we can exclude conditions affected by other quality-based ACA
initiatives (i.e., AMI, heart failure, and pneumonia) and we can control for demographics
and health conditions of the individuals with the observed health events. Third, we can
customize the outcome measure to different lengths (e.g., 30, 60 and 90-day measures).
Fourth, similar to the mortality and readmission indices in the Hospital Compare data, the
measure is focused on the Medicare population rather than that full patient population. To
the extent that the insurance expansions produce changes in the composition of the patient
population, focusing on Medicare outcomes allows us to focus on the spillover effect, and
11
The full list of conditions used are listed in Appendix A.3
12
We are grateful to anonymous referee to pointing out the set of conditions targeted by other ACA reforms
that were enacted simultaneously with the insurance expansions.
13
These data were originally constructed for a paper by Dauda, Dunn, and Hall (2018).
13circumvent the thorny issue of disentangling true changes in hospital quality from changes
in a hospital’s patient population as a result of the ACA.14
Again, it should be emphasized that this measure is centered on the spillover effects of
the reform rather than its direct effect on the outcomes of those patients whose insurance
status changed.
4 Regression Framework and Identification
To assess how increased access to both public and private non-group insurance affects hos-
pital utilization, prices, finances, and quality spillovers, we utilize a difference-in-differences
framework with a continuous treatment variable. As mentioned earlier, we construct our
treatment variables using 2013 ACS data to calculate the fraction of the county’s popula-
tion that is uninsured and will have become newly eligible for either insurance expansion
in 2014 and 2015. While the ACS provides geographic identifiers at the public use micro-
data area (PUMA) level, we use the PUMA to county mapping files to estimate treatment
sizes for these more recognizable geographic units. Given that the outcomes are measured
at the hospital level while the treatments–i.e., exposure to the ACA-induced expansions of
Medicaid eligibility and private insurance subsidies–are county-specific, one possible identifi-
cation assumption is that individuals tend to seek care at hospitals within their county. This
assumption is consistent with the well-established empirical feature of health care markets
(McGuirk and Porell, 1984; Buchmueller et al., 2006; Baker et al., 2016) that patients tend
to choose medical care facilities that minimize travel time and distance.
However, there is also substantial evidence that county borders do not pose a meaningful
barrier to access as consumers often cross county and state borders to seek care (Garnick
et al., 1987; Radany and Luft, 1993; Yip and Luft, 1993). Instead of imposing this strong
assumption, we use Medicare claims data with information on hospital and patient locations
to estimate the expected hospital patient population emanating from each county. The es-
timated patient flows are used to construct hospital-specific weights that relate the exposure
to the ACA for individuals residing in a county to a hospital-specific patient population.15
14
It should be noted that the Hospital Compare data also include mortality information that is based
on the full sample of Medicare fee-for-service claims data. The key disadvantage of the Hospital Compare
mortality data is that individual-level controls cannot be included and the data is pooled over multiple years,
as is discussed in Appendix A.2.
15 M DR
Here, we describe this approach in greater detail. Let Sc,h be the share of inpatient Medicare patients
residing in county c and receiving service in hospital h, where this share is averaged over the 2010-2013
period to reduce year-to-year variance. This share is then scaled to the total population in each county to
produce an expected number of patients coming from county c and traveling to hospital h. That is, the
M DR
expected patient count coming from county c is EPc,h = Pc · Sc,h where Pc is the total population count
for county c. The calculated weight for county c for hospital h is the expected share of patients coming
14We explicitly weight all treatments and controls by our constructed hospital-specific
weights. These weights, when applied to the covariates, attempt to re-create the character-
istics of the patient population actually seen at each hospital in the sample. This procedure
creates a sensible mapping between the extent to which a county is treated by the ACA’s
insurance expansions and the extent to which a hospital is treated by the ACA’s insurance
expansions. For example, suppose hospital 1 is located in county B but receives 50% of its
patients from county A, where 10% of the population is newly eligible for Medicaid under
the ACA; and the remaining 50% from county B, where no Medicaid expansion takes place.
Under this weighting strategy, hospital 1 will receive a Medicaid treatment of 0.05 whereas
it would have instead received a treatment of 0 under the initial simplifying assumption that
all patients seek care only in the hospital that reside within their county. Thus, we use
the county-weighting approach in all of our analysis, as it is theoretically superior to the
assumption that all individuals seek care in hospitals within their county. This approach
is consistent with much of the literature that applies hospital-specific flows and distance,
rather than pre-defined geographic boundaries, to create relevant patient populations (Luft
et al., 1990; Town and Vistnes, 2001; Gaynor and Vogt, 2003; Tay, 2003; Romley and Gold-
man, 2011; Dranove and Ody, 2016). It also captures the spirit of how the Dartmouth Atlas
Project constructs Hospital Referral Regions (HRRs) based on patient flows from Medicare
data.
We apply the weights just described to all of the associated covariates, including county-
level measures of exposure, to make all of the variables hospital-specific. We then estimate
the following equation:
log(Yht ) = β0 + β1 (postt × M edicaid N ewly Eligiblesh ) + β2 (postt × P rivate Subsidy Eligibleh )
+ β3 (Xht ) + yeart + hospitalh + βstate (yeart × I(stateh )) + ht ,
(1)
where subscripts h denote the hospital, and t the year (2009, 2010, 2011, 2012, 2013,
from county c, which is equal to:
EPc,h
ESc,h = P
∀c EPc,h
The implicit assumption is that conditional on the county of residence, the travel patterns for the Medicare
population is similar to that of the broader population. We eliminate county patient flows that account for
less than 1 percent of the total flows, as these flows may introduce noise into the estimates.
152014, or 2015).16,17
First, we enumerate our outcome variables, log (Yht ), all of which capture measures
of hospital utilization and finances. Our utilization measures are multifarious, recording
separately the logged annual number of inpatient visits financed by Medicaid, Medicare, or
private sources. They also include logged annual visits aggregated across all payers for each
of the following categories: inpatient stays, outpatient visits, emergency department visits,
non-emergency department visits, and a price-weighted measure of inpatient and outpatient
visits, which we define explicitly in the subsequent paragraph.
The remaining dependent variables each capture at least one element of hospital revenues
or costs. These include logged annual measures of hospital episode prices, revenues, operating
expenses, profits, along with the total cost of uncompensated care and Medicaid visits.
While these latter five measures are simply lifted from hospital income statements, the price
measure is constructed in two steps, following Melnick et al. (2011); Trish and Herring (2015);
Ho and Lee (2017); Roberts et al. (2017). First, we create an aggregated measure of total
utilization by summing the median revenue-weighted number of inpatient and outpatient
days at a particular hospital. Next, we divide the total patient revenue generated at the
hospital by this adjusted utilization measure. We also run an alternative specification in
which we replace the dependent variable with logged annual patient revenue and control for
this utilization measure directly in the regression.
The coefficients of interest are β1 and β2 , which tell us the effect of a 100 percentage point
increase in the fraction newly eligible for each insurance expansion on the percentage point
change in our hospital outcomes. To determine the average effect of a Medicaid expansion or
private insurance expansion on each outcome measure, one can simply scale these coefficients
by the average percent of the population served by each hospital that has become eligible
for either program. These fractions are 5.1% and 6.5%, respectively, (the same as the
median fractions) and the associated implied effects are included in bold below the coefficient
estimates in each regression table.
As is typical in all difference-in-differences studies, the core assumption underlying our
identification strategy is one of parallel trends. That is to say, the growth rate in all of the
16
In approximately 40% of hospitals, the fiscal year does not coincide exactly with the calendar year. In
these cases, we modulate the treatment effect by the ’dose’ received in a given calendar year. For example,
a hospital whose fiscal year ends 09/31/14 but that expands Medicaid on 01/01/14 would receive a 3/4ths
treatment dose in 2014 and a full dose in 2015.
17
Following Frean et al. (2017), we had initially controlled for the fraction of individuals eligible for
Medicaid coverage prior to the ACA in order to capture the so-called ‘woodwork effect,’ whereby some
individuals who had been eligible for Medicaid prior to the ACA enrolled only after the ACA rollout in 2014
due to an enhanced awareness of their eligibility for the program. The main results were invariant to the
inclusion of such a control and so–in the spirit of parsimony–we exclude it from the model.
16outcome variables would have evolved similarly in the absence of the Medicaid or private-
insurance expansions. We also add hospital fixed effects, which absorb any hospital-specific
heterogeneity in patient populations, hospital quality, and hospital practices that could affect
utilization and finances. Beyond controlling for the standard main effects in the interaction
term (year fixed effects), we also allow each state to have its own time trend, (yeart ×
I(stateh )). We further control for Xht , a vector of time-varying demographic characteristics
that could otherwise affect the demand for health care and the channel through which it is
provided, such as the age distribution in the county and the county-specific unemployment
rate. In the robustness section of the paper we address potential violations of the parallel
trend assumption.
Another potential confound is heterogeneity in the market structure in which each hos-
pital operates. It would be problematic if the effects of the insurance expansions are likewise
correlated with changes in the hospital industry structure. This could be of particular im-
portance when considering the effect of Medicaid and commercial insurance expansions on
hospital prices and profits. To address this possibility, we also add controls for the hospital
Herfindahl-Hirschman Index (HHI) using hospital system information available in the AHA
data. Additionally, we include fixed effects for the network in which each hospital operates,
as well as for the hospital system to which it belongs.
As previous scholarship has recognized, 5 states (California, Connecticut, Minnesota,
New Jersey, and Washington) and the District of Columbia opted to boost Medicaid income
eligibility limits early, between 2011 and 2013 (Sommers et al., 2013; Golberstein et al., 2015;
Frean et al., 2017). By applying state-specific Medicaid and Childrens’ Health Insurance Plan
(CHIP) income eligibility limits18 to their appropriate demographic group in the ACS data
(children, non-disabled adults, and parents), we explicitly control for such early Medicaid
expansions in our regressions. That is, the primary treatment variable of interest captures
only the size of the groups attaining eligibility for Medicaid in 2014 and 2015 who would have
been ineligible previously. Nonetheless, we flexibly control for the possibility that outcomes
may have evolved differently in these early expansion states (for example, to allow for the
possibility that the effects of insurance expansion grow over time) by interacting an indicator
for whether that county resides in a state that had expanded early with the traditional post-
ACA sample period of 2014-2015. We fold this interaction term into our vector of hospital
market characteristics, Xht . Additionally, we assess the possibility that our results are being
driven by these early expansion states by re-doing all analyses–in Appendix A.5–after having
removed either all six early expansion states or California from the sample.
One other concern is the possibility that county-level differences in income distributions
18
See https://www.kff.org/state-category/medicaid-chip/.
17may be correlated with the expansion decisions. Here we rely on the results of a paper by
Frean et al. (2017), which constructs a “simulated eligibility” instrument for both Medicaid
expansions and private insurance subsidies based on a randomly selected national sample
of families from the ACS. This approach, pioneered by Currie and Gruber (1996a,b) and
Cutler and Gruber (1996), purges the estimates of any lingering association between the
policy decision and the characteristics of the underlying population. Reassuringly, Frean et
al. (2017), who estimate whether and how the ACA insurance expansions affected insurance
coverage, find identical results when using either the reduced form or instrumental variable
specifications. Therefore, we too need not worry about policy endogeneity when interpreting
our estimates.
We also supplement our analyses with a test on inpatient utilization by Medicare patients.
Given the recent work by Carey et al. (2020) that finds no spillover effects on the utilization
of primary care services by Medicare enrollees using state-level variation in ACA expansion,
we do not anticipate an effect on the Medicare inpatient sample. However, given our more
targeted hospital-specific treatment analysis and the work by Kolstad and Kowalski (2012)
that finds effects on inpatient length of stay, we view this as an important check. To the
extent that there are no spillover effects, the specification is still a useful placebo test. If we
were, for example, to observe that Medicare-financed hospital care is correlated with either
the public or private insurance expansion treatment variables, this would raise the spectre
that our results are being driven, at least in part, by some heretofore neglected source of
unobserved heterogeneity, potentially related to spillover effects.
Lastly, when estimating ACA insurance expansion effects on quality by way of the Hospi-
tal Compare data or Medicare claims data, we are careful to control for the hospital penalty
rate or status under each of the three major ACA quality initiatives (HRRP, HVBP, and Bun-
dled payments).19 Doing so will reduce the bias introduced by the simultaneous enactment
of these quality initiatives–which should independently affect our quality measures–with the
ACA insurance expansions of 2014 and 2015.
19
The Hospital Value-Based Purchasing Program withholds 2% of Medicare payments from hospitals
and then either imposes a penalty or awards a bonus based on a total performance score. This score
reflects the achievement of quality outcomes relative to both past performance and that of peer hospitals.
The Hospital Readmissions Reduction Program calculates an aggregate excess readmission ratio (ERR)
for six conditions—AMI, HF, pneumonia, COPD, CABG, and hip replacement or total knee arthroplasty
procedures. Hospitals were penalized according to their ERR, with payment reductions having been capped
at 1% in 2013, 2% in 2014, and 3% in 2015. Finally, the AHA database indicates whether each hospital
participated in a bundled payment program “where the hospital receives a single payment from a payer
for a package of services and then distributes payments to participating providers of care (such as a single
fee for hospital and physician services for a specific procedure, e.g. hip replacement, CABG).” We control
for these year-specific payment adjustment factors, provided by CMS, and the Bundled Payment program
participation indicator in both our Hospital Compare and Medicare mortality regressions.
185 Results
Before presenting our main results, we demonstrate that our estimates of the ACA expansion
effects are measured appropriately. Specifically, we replicate the analysis in the literature by
applying a difference-in-differences estimator to examine the effects of insurance expansion
on the number of newly insured individuals in the population. Our results, reported in Table
A1 of Appendix Section A.1, shows that our measures of expanded Medicaid and private
subsidy eligibility both positively and significantly contribute to the number of newly insured
individuals. We find no evidence of crowd out.
As we discuss in greater detail in the appendix, our results match previous findings in
the literature (Long et al., 2014; Smith and Medalia, 2014; Sommers et al., 2014; Alker and
Chester, 2015; Cohen and Martinez, 2015; McMorrow et al., 2015; Sommers et al., 2015;
Buchmueller et al., 2016; Leung and Mas, 2016; Levy et al., 2016; Courtemanche et al.,
2017; Frean et al., 2017; Kaestner et al., 2017; Duggan et al., 2019b). In the remainder of
the paper, however, we focus on the hospital effects of these expansions.
5.1 ACA Effects on Hospital Utilization and Finances
We begin with an event-study approach in which we interact dummies for {no, low, high}
levels of exposure to the Medicaid expansion with each year of the data. Likewise, we interact
dummies for {low, high} exposure to private insurance subsidies with each year of the sample.
The parallel trends assumption would stand if it were the case that the interaction terms
in the pre-period are indistinguishable from 0. That is to say, there were no differential
pre-trends in the outcome variables that were correlated with future treatment.
Figures 3 and 4 succinctly summarize the results of the analysis. In general, the absence
of differential pre-trends by treatment status lends credibility to the parallel trends assump-
tion that had been employed in the difference-in-differences analysis. Moreover, with the
notable exception of emergency department (ED) visits, the ACA effects on the outcomes
emerge only beginning in 2014 and persist thereafter. Namely, Figures 3a and 3b reveal
that uncompensated care costs decrease by nearly 50 percentage points in hospitals whose
patients were exposed to the Medicaid expansion, while the extent of Medicaid inpatient care
usage increases monotonically in the degree to which a hospital is exposed to the Medicaid
expansion, topping out at 20 percentage points for these most intensively treated hospitals.
This monotonic relationship extends also to outpatient visits, though weakly, and to hos-
pital revenues, prices, and profits: hospitals with above-median exposure to the Medicaid
treatment experienced increases in outpatient visits, revenues, and prices by approximately
4 percentage points each, and increases in profits by 2 percentage points. Likewise, the
19remaining figures show that above-median exposure to the private insurance expansion pro-
duces marginal, if any, gains in hospital utilization along with modest 2 percentage point
gains in prices, revenues, and profits.
Columns (1)-(4) of Table 2 document formally how the Medicaid and private insurance
expansions separately affected the (logged) number of inpatient visits financed by Medicaid,
Medicare, or a combination of self-pay and private insurance, respectively. We find that
a 1 percentage point increase in Medicaid eligibility simultaneously raised the number of
Medicaid-financed inpatient visits by 2.8 percentage points, which implies an average Med-
icaid treatment effect of 14.3 percentage points. The relatively large magnitudes uncovered
appear to have resulted from the influx of previously uninsured patients onto the Medicaid
rolls, which is supported by a corresponding decline in uncompensated care costs by 48
percentage points in Table A10 of Appendix Section A.6. Such a shift in payer mix from un-
compensated care to Medicaid without an overall change in inpatient utilization is consistent
with other recent work (Freedman et al., 2017).
20(a) Uncompensated Care Share (b) Medicaid Inpatient Days
(c) Inpatient Visits (d) Outpatient Visits
Figure 3: Hospital Outcomes, by exposure to ACA insurance expansions
These event-study plots illustrate how hospital outcomes evolve according to their county-weighted level of
exposure to the ACA Medicaid and private insurance expansions. The connecting points are the point
estimates on the interaction between each group and the indicated year dummy. Each dependent variable
is measured in logs, and so the coefficients should be interpreted as percentage point changes. The dashed
and solid lines with circle markers, and lightly dotted lines with triangle markers represent hospitals with
below and above-median levels of exposure to Medicaid, and with above-median exposure to the private
insurance expansions, respectively. The leave-out or ‘control’ group for the Medicaid treatment is made up
of hospitals with 0 exposure to Medicaid expansions, and hospitals with below-median levels of exposure
for the private treatment. Each set of vertical bars covers the associated 95% confidence intervals.
21(a) Emergency Department Visits (b) Total Utilization
(c) Hospital Prices (d) Hospital Patient Revenue
(e) Hospital Profits
Figure 4: Hospital Outcomes, by exposure to ACA insurance expansions (ctd.)
See footnotes to Figure 3.
22We further broaden the scope of the analysis to aggregate utilization effects, separately characterizing the relationship between insurance expansions and overall inpatient visits, outpatient visits, and emergency department visits. Starting with the results in column (5), each 1 percentage point increase in Medicaid eligibility induces a 0.0092 percentage point increase (p
24% by inducing individuals who otherwise would not have utilized emergency services to do
so. However, event study Figure 4a shows that the increase in ED visits pre-dated the ACA
private insurance expansions and so we should be cautious in interpreting this coefficient too
literally. Combining inpatient and outpatient visits, we find a marginally significant positive
2.7 percentage point effect of the Medicaid insurance expansions on overall hospital utiliza-
tion; although this effect is positive, it all but vanishes in the event-study plot. Duggan et
al. (2019a) find positive effects for overall hospital utilization in certain specifications but
not for those in which outcomes are aggregated at the hospital level, as in our study.
    We next examine whether prices per stay increase, as might be expected when uninsured
individuals gain insurance coverage and private insurers compete for access to hospitals. To
investigate this possible effect, we explore the potential price effects associated with the in-
surance eligibility expansions. Table 3 shows that a 1 percentage point increase in public
insurance and private subsidy eligibility increased average hospital episode prices by approx-
imately 0.006 percentage points (p
You can also read