Integrating Latin America and the Caribbean - Cepal
←
→
Page content transcription
If your browser does not render page correctly, please read the page content below

This study analyses the impact of reducing intraregional trade barriers in the context of a free trade agreement
in Latin America and the Caribbean. It concludes that a full tariff reduction and elimination of non-tariff
measures would have positive impacts on trade, production, welfare and employment across the region.

 Integrating Latin America
 and the Caribbean
 Potential effects of removing tariffs and
 streamlining non-tariff measures
 Marcelo Dolabella
 José Elías Durán Lima

Thank you for your interest in
 this ECLAC publication

 ECLAC
 Publications

 Please register if you would like to receive information on our editorial
products and activities. When you register, you may specify your particular
areas of interest and you will gain access to our products in other formats.

 Register

 www.cepal.org/en/publications

 facebook.com/publicacionesdelacepal

 Publicaciones
 www.cepal.org/apps
Project Documents

Integrating Latin America and the Caribbean
Potential effects of removing tariffs and streamlining
 non-tariff measures

 Marcelo Dolabella
 José Elías Durán Lima
This document has been prepared by Marcelo Dolabella, Consultant and José Elías Durán Lima, Chief of the Regional
Integration Unit, Division of International Trade and Integration, ECLAC, within the activities of the project
ECLAC/FEALAC: “Value Chain Development for Deeper Integration of East Asia and Latin America”.
The views expressed in this document, which has been reproduced without formal editing, are those of the authors
and do not necessarily reflect the views of the Organization.

United Nations publication
LC/TS.2020/113
Distribution: L
Copyright © United Nations, 2021
All rights reserved
Printed at United Nations, Santiago
S.20-00597

This publication should be cited as: M. Dolabella and J. E. Durán L., “Integrating Latin America and the Caribbean:
potential effects of removing tariffs and streamlining non-tariff measures”, Project Documents (LC/TS.2020/113), Santiago,
Economic Commission for Latin America and the Caribbean (ECLAC), 2021.

Applications for authorization to reproduce this work in whole or in part should be sent to the Economic Commission
for Latin America and the Caribbean (ECLAC), Documents and Publications Division, publicaciones.cepal@un.org. Member
States and their governmental institutions may reproduce this work without prior authorization, but are requested to mention
the source and to inform ECLAC of such reproduction.

ECLAC Integrating Latin America and the Caribbean: potential effects of removing tariffs... 3

 Table of contents

Abstract................................................................................................................................................ 7
Introduction ........................................................................................................................................ 9
I. Tariff protection....................................................................................................................... 11
II. Non-tariff measures (NTMs) .................................................................................................... 15
III. Estimated bilateral total protection ....................................................................................... 21
 A. Methodology for the estimation of AVEs barriers of NTMs ............................................... 21
 B. Post estimation tests and identification coverage ................................................................. 25
 C. Estimates of AVE of NTMs ................................................................................................ 28
 1. Cost and benefits of NTMs.........................................................................................29
 2. Cost estimates of NTMs ............................................................................................ 30
 3. Intra-regional Trade: AVE of NTMs in Latin America and the Caribbean ................... 33
 D. Total Trade Protection ...................................................................................................... 34
IV. A Latin American Free Trade Agreement (FTA): incorporating NTMs into
 a CGE framework ..................................................................................................................... 37
 A. CGE modelling and scenarios considered .......................................................................... 41
 B. Welfare and macroeconomic results ................................................................................. 41
 C. Sectoral effects and intra-regional trade ........................................................................... 43
 D. Effects on employment .................................................................................................... 45

Conclusions ........................................................................................................................................ 47
Bibliography .......................................................................................................................................49
Annexes ............................................................................................................................................. 51
Annex 1 ........................................................................................................................................... 52
Annex 2 .......................................................................................................................................... 55

ECLAC Integrating Latin America and the Caribbean: potential effects of removing tariffs... 4

Annex 3 ......................................................................................................................................... 57
Annex 4 ......................................................................................................................................... 58
Annex 5 ........................................................... .............................................................................59
Annex 6 .........................................................................................................................................60
Annex 7 ............................................. ...........................................................................................62
Annex 8 .........................................................................................................................................66

Tables
Table 1 Tariffs by regions ....................................................................................................... 12
Table 2 Tariffs affecting different sectors............................................................................... 13
Table 3 Coverage ratios and frequency Indexes for different importing regions ..................... 17
Table 4 Coverage ratios and frequency indexes affecting different sectors ............................ 17
Table 5 Prevalence score of NTMs imposed by different importing regions ........................... 18
Table 6 Prevalence score of NTMs affecting different sectors ................................................ 19
Table 7 Cost and benefits of NTMs: AVE of NTM imposed by different regions .....................29
Table 8 Cost and benefits of NTMs: AVE of NTM affecting different regions.......................... 30
Table 9 Cost and benefits of NTMs: AVE of NTM affecting different sectors .......................... 30
Table 10 Cost estimates of NTMs: AVE of NTM across regions ................................................ 31
Table 11 Cost estimates of NTMs: AVE of NTM affecting different regions.............................. 32
Table 12 Cost estimates of NTMs: AVE of NTM affecting different regions.............................. 34
Table 13 Trade protection considering tariffs and costs/benefits of non-tariff measures.......... 35
Table 14 Trade protection considering tariffs and costs of non-tariff measures ....................... 35
Table 15 Latin America and the Caribbean: applied tariffs and AVE
 of NTMs in intra-regional trade.................................................................................. 40
Table 16 Latin America and the Caribbean: impact on macroeconomic variables
 and welfare under various scenarios .......................................................................... 42
Table 17 Latin America and the Caribbean: intra-regional trade share, different scenarios ......44
Table 18 Latin America and the Caribbean: effects of simulated scenarios
 on the wage bill of employment according to large sectors ....................................... 45
Table A1 Country sample by region .......................................................................................... 52
Table A2 GTAP country aggregation ........................................................................................ 54
Table A3 1996 HS06 codes not considered ............................................................................... 55
Table A4 Trade coverage.......................................................................................................... 56
Table A5 Comparison of frequency indexes for different importing regions ............................. 57
Table A6 Coverage Ratios for SPS, TBT and trade defense measures (TDM) ............................ 58
Table A7 Comparison of import demand elasticities ................................................................60
Table A8 Identifying outliers: distribution of estimated coefficients .........................................62
Table A9 Sensitiveness Results: trade weighted AVE impact
 by importing/imposing countries ...............................................................................64
Table A10 Costs and Benefits of NTMs: AVE of NTMs for different
 importing/exporting countries .................................................................................. 66
Table A11 Costs of NTMs: AVE of NTMs for different importing/exporting countries ................. 67

Figures
Figure 1 Evolution of the applied tariff rate, 1990-2018 ........................................................... 12
Figure 2 Significance of SPS measures by sector .....................................................................26
Figure 3 Significance of TBT measures by sector ..................................................................... 27
Figure 4 Cost estimates of NTMs: AVE of NTM affecting different sectores ............................ 32
Figure 5 Overall AVE Barrier over sectors: NTMs and tariffs .................................................... 36

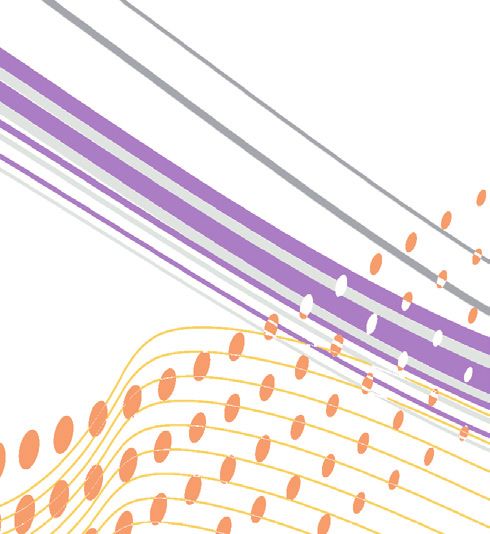
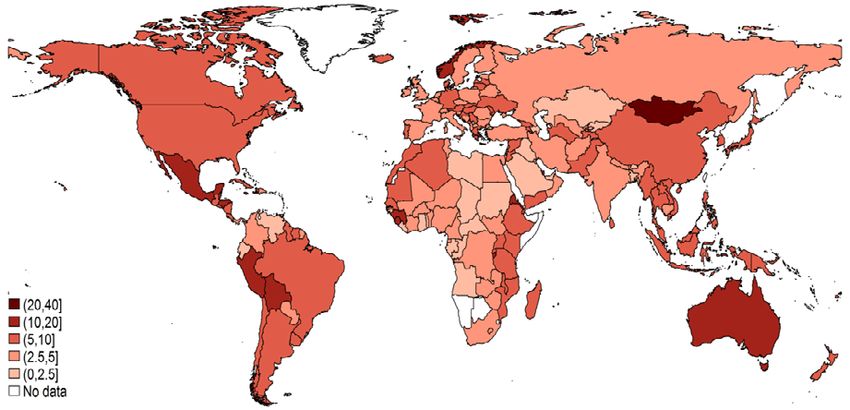
ECLAC Integrating Latin America and the Caribbean: potential effects of removing tariffs... 5

Figure 6 Latin America and the Caribbean: evolution of the multilateral MFN tariff
 and applied tariff, and intra-regional applied tariff, 1990-2018 ................................. 38
Figure 7 Latin America and the Caribbean: intra-regional imports with
 and without tariff preferences ................................................................................... 39
Figure 8 Latin America and the Caribbean: applied tariff and non-tariff
 protection in intra-regional trade............................................................................... 39
Figure 9 Latin America and the Caribbean: sectoral applied tariff and non-tariff
 protection in intra-regional trade............................................................................... 40
Figure 10 Latin America and the Caribbean: impact on production under various scenarios......42
Figure 11 Latin America and the Caribbean: welfare decomposition under
 different scenarios ..................................................................................................... 43
Figure 12 Latin America and the Caribbean: actual and potential intra-regional
 exports under different scenarios .............................................................................. 44
Figure A1 Trade weighted AVE impact for different robustness checks ..................................... 63
Figure A2 Sensitiveness Results: trade weighted costs/benefits of NTMs by sectors ................. 65

Maps
Map 1 Cost estimates of NTMs: AVE of NTM faced by different exporters ........................... 31
Map 2 Cost estimates of NTMs: Intra-regional AVE of NTM ................................................. 33

ECLAC Integrating Latin America and the Caribbean: potential effects of removing tariffs... 7

 Abstract

This work analyzes the potential economic effects in Latin America and the Caribbean of reducing intra-regional
trade barriers. First, trade costs coming from two main sources; customs tariffs and non-tariff measures (NTMs),
are analyzed. The impact of NTMs on trade quantities was estimated for more than 5,000 products at the 6-digit
level of the Harmonized System using a panel for 2001-2015 with NTM data notified by more than 150 member
countries of the World Trade Organization (WTO). Trade effects were transformed into Ad-valorem equivalents
(AVEs) using import elasticities and were aggregated into a GTAP country-sector classification. These estimates
were used to assess the potential effects of liberalizing intra-regional trade in Latin America and the Caribbean by
both eliminating tariffs and streamlining trade restrictive NTMs. Results point to a positive impact of 0.73 in the
regional GDP, with a larger share of this impact coming from tariff liberalization.
 Key words: tariffs, NTMs, AVEs of NTMs, intra-regional trade, Latin America and the Caribbean,
CGE model.

ECLAC Integrating Latin America and the Caribbean: potential effects of removing tariffs... 9

 Introduction

Traditionally, the trade literature has focused its attention on tariffs as its main trade policy instrument.
In the last 30 years the room for maneuvering in trade policy on the base of customs tariffs has decreased
notably, mainly due to the reduction in the applied tariffs on imports, whether unilaterally, or by
subscribing to free trade agreements, which has also drastically reduced tariffs on imports. In the
beginning, when customs tariffs were high, the global economy received a positive effect due to the big
impulse from the decrease in customs protection. Nonetheless, although customs tariffs have been
reduced, many countries have maintained a series of measures that still decrease their capacity to reach
new markets through international trade. Due to this, in recent years an increasing emphasis has been
placed on Non-Tariff Measures (NTMs), also commonly referred to as the unseen barriers to trade.
UNCTAD (2015) defines NTMs as policy measures other than ordinary custom tariffs that can potentially
have an economic effect on international trade in goods, changing quantities traded, prices or both.
Such measures can take the form of instruments of commercial policy (e.g. antidumping duties,
quantitative restrictions, safeguards) or technical measures aimed at ensuring food safety, quality of
products, protection of the environment, among others (e.g. sanitary and phytosanitary measures,
technical barriers to trade).
 The persistence of non-tariff measures in the intra-regional commerce has been a main point of
concern in the agenda of several sub-regional integration schemes. More and more businesses and
government officials throughout Latin America and the Caribbean have become aware of the need to
remove/harmonize some of the main non-tariff measures. However, before being able to undertake any
process of NTMs streamlining, it is of paramount importance to acquire a better understanding on how
NTMs affect international trade. With such estimates it is then possible to have an idea of the surcharge
paid by regional importers and exporters at different disaggregation levels. Moreover, it provides the
foundations for the analysis of unlocking the region’s potential for international trade, as well as the
gains/losses that could come as a result of public policies trying to streamline such measures.
 Given this need, this work sets to quantify trade barriers at a global level, including not only tariffs
but also NTMs. Since these measures are normally set on a very specific and disaggregated level
ECLAC Integrating Latin America and the Caribbean: potential effects of removing tariffs... 10

(product level), assessing their trade impact and bringing them to a common metric is not a simple task.
This work joins the group of studies which estimate the impacts of NTMs on traded quantities for all
5,103 six-digit product lines of the harmonized system (HS). These estimates are then transformed to
ad-valorem equivalents (AVEs) and aggregated into fewer country and sector groups. Adding tariffs
with the estimated ad-valorem protection coming from NTMs proposes a clearer and more realistic
picture of the barriers surrounding international trade of goods. Therefore, this work focuses on
assessing trade costs from tariffs and NTMs quantitatively rather than discussing the ways to
streamline, harmonize and give transparency to these restrictive measures.
 The Latin American Integration Association (ALADI, in Spanish) requested ECLAC an evaluation
of an eventual large-scale Latin American economic agreement (Acuerdo Económico Comercial Integral
Latinoamericano – AECIL, in Spanish), which assumes full tariff reduction of bilateral trade not covered
by trade agreements. Such an agreement would also benefit from a harmonization of standards and an
elimination of trade defense measures. Using a computable general equilibrium model (CGE), this
document assesses how reducing the trade barriers from tariffs and NTMs could impact trade,
production, welfare and employment across the region.
 The following section presents the current applied tariff protection imposed by different
countries across the world, including the preferential tariffs negotiated in different trade agreements.
Section II outlines the structure of non-tariff measures affecting international trade. Coverage ratios,
frequency indexes and prevalence scores are calculated and analyzed here. Section III guides the reader
through how the trade impacts stemming from NTMs were estimated and then transformed into AVEs.
Results over different dimensions are displayed in this section alongside with the assumptions held
during the aggregation process. This section also compiles information on AVEs of NTMs and tariffs as
an effort of presenting a more realistic picture of trade impediments. Section IV shows how a regional
economic agreement could benefit from the elimination and harmonization of these measures by
analyzing the potential economic and social effects from such policies. Section V brings to light some
concluding remarks of this work.
ECLAC Integrating Latin America and the Caribbean: potential effects of removing tariffs... 11

 I. Tariff protection

Tariff protection has been experiencing a downward trend at the global level over the last decades.
Although recent tensions between China and the United States have led to the mutual placement of
tariffs, tariffs remain at lower levels when compared to previous decades. This trend becomes clearer
when the global tariff structure is analyzed. The evolution of the applied tariff rate (which considers
preferential tariffs for selected partners) over the last three decades reveals that the global tariff
structure has decreased by more than half in the period (see panel A of Figure 1). Similarly, tariff
protection in Latin America and the Caribbean, China and East Asia and Pacific countries has shown a
similar path, with a much more intensified fall (see panel B of figure 1).
 The analysis global trade and tariff protection imposed and faced by different regions gives a
brighter picture of trade tariff barriers. This work split countries into 10 country-groups for descriptive
purposes. 1 The state of tariff protection, considering data consolidated by the World Trade Integrated
Trade Solution (WITS) database, shows that at the global level, the applied tariff is of around 3.0%. 2 The
lowest tariffs applied are those by most developed nations, such as Canada, the United States, the
European Union (EU) and Japan. 3 Tariffs imposed by Sub-Saharan Africa and Latin America and the
Caribbean countries are the highest. As to tariff resistance faced by the same country groups, it is
observed that, on average, developing economies receive lower tariffs than those that they apply and
more developed countries face the highest tariffs in comparison with its less developed counterparts.
This goes in lines with different preferential agreements signed by developed nations with low-income
countries, such as the Generalized System of Preferences (GSP).

1 Annex 1 exhibits the countries included in each group.
2 Tariffs are displayed for 2015 in order to match with the year for which NTMs were estimated.
3 For consistency with the following sections intra-European Union trade is not taken into account. When intra-EU trade is considered
 global tariffs are reduced to 2.4%, with the EU imposing a tariff of 0.9 and facing a tariff of 1.4.
ECLAC Integrating Latin America and the Caribbean: potential effects of removing tariffs... 12

 Figure 1
 Evolution of the applied tariff rate, 1990-2018
 (Trade weighted average, in percentages)

 A. World, European Union and USA B. Latin America & Caribbean, China &
 Asia Pacific
 7
 45
 6 40

 5 35
 30
 4
 25
 3 20

 2 15
 10
 1
 5
 0 0
 1990
 1992
 1994
 1996
 1998
 2000
 2002
 2004
 2006
 2008
 2010
 2012
 2014
 2016
 2018

 1990
 1992
 1994
 1996
 1998
 2000
 2002
 2004
 2006
 2008
 2010
 2012
 2014
 2016
 2018
 World
 China
 United States
 Latin America and the Caribbean
 European Union
 Asia Pacific

Source: Author’s calculation, based on information from the World Bank and the COMTRADE database of the United Nations. Missing values
were interpolated for China in 1995, 2012 and 2013, for the United States in 1994, and for some countries in the group of Latin America and
the Caribbean and Asia Pacific.

 Table 1
 Tariffs by regions
 (Trade values in billions of dollars, 2015)
 Percentage
 Percentage of Tariff Imposed Tariff Faced
 Regions Imports Exports of Total
 Total Trade (in percentage) (in percentage)
 Trade
 Latin America and the Caribbean 946 8.3 5.4 913 8.0 2.4
 United States 2 107 18.4 1.5 1 315 11.5 3.3
 Canada 400 3.5 1.1 383 3.3 1.1
 European Union 1 951 17.0 2.2 1 791 15.6 3.7
 Japan 566 4.9 2.3 611 5.3 4.3
 China 1 198 10.5 3.9 2,204 19.2 3.6
 Other Asia Pacific 2 524 22.0 3.6 2,287 20.0 3.2
 Middle East and North Africa 903 7.9 3.6 863 7.5 1.7
 Sub-Saharan Africa 270 2.4 8.2 277 2.4 1.6
 Rest of World 594 5.2 2.1 815 7.1 2.0
 World 11 460 100 3.0 11 460 100 3.0

Source: Author’s calculations, based on information from the WITS and the BACI database. Note: Intra-EU trade not considered. See annex 2 for details.

 Table 2 shows tariff protection across sectors for the world and for Latin America and the
Caribbean. Processed foods, beverages and tobacco (12.7%) and textiles, footwear and clothing (12.6%)
are the sectors in which Latin America and the Caribbean impose the highest tariffs. Both sectors are
also the most protected when global trade is considered. Latin American and Caribbean’s exporters
receive higher tariffs on agricultural products (7.8% on average) and on processed foods, beverages
(7.3%). On the other hand, the sectors of oil, extraction and mining, and machinery and equipment face
the lowest tariffs.
ECLAC Integrating Latin America and the Caribbean: potential effects of removing tariffs... 13

 Table 2
 Tariffs affecting different sectors
 (Trade values in billions of dollars, 2015)
 World Latin America and the Caribbean
 Percentage
 Total Applied Tariff Tariff Imposed Tariff Faced
Regions of Total Imports Exports
 Trade (in percentage) (in percentage) (in percentage)
 Trade
Agriculture, hunting 415 3.6 7.0 27 6.3 95 7.8
and fishing
Oil extraction and mining 569 5.0 1.1 10 0.7 78 0.4
Processed foods,
 54 12.7 114 7.3
beverages and tobacco 566 4.9 10.1
Textiles, footwear and
 44 12.6 31 2.3
clothing 728 6.4 7.5
Wood and paper 205 1.8 2.2 21 3.9 22 1.1
Chemical and
 265 3.3 168 1.1
petrochemical 2 871 25.1 1.9
Non-metallic minerals 200 1.7 3.3 10 6.3 8 1.7
Metals and derivatives 946 8.3 2.3 77 4.2 75 0.6
Cars and transportation
 115 8.9 128 1.3
equipment 1 183 10.3 4.1
Machinery and equipment 3 476 30.3 1.6 305 3.9 178 0.4
Other manufactures 300 2.6 2.5 19 8.7 17 0.6
 11
 946 5.4 913 2.4
Total 460 100.0 3.0

Source: Author’s calculations based on information from the WITS and the BACI database. Note: Intra-EU trade not considered. See annex 2 for details.
ECLAC Integrating Latin America and the Caribbean: potential effects of removing tariffs... 15

 II. Non-tariff measures (NTMs)

Given the broad definition of the term Non-tariff measures and its inherent heterogeneity, this work
opted to assess trade effects of different NTMs. For this task the following seven types of NTMs were
analyzed: sanitary and phytosanitary (SPS), technical barriers to trade (TBT), quantitative restrictions
(QR), antidumping duties (ADP), countervailing duties (CV), safeguard measures (SG) and special
safeguard measures (SSG). The first two measures are termed technical measures or standard-like
measures, for their objective of regulating the domestic market. The remaining are termed trade
defense measures (TDM) due to their trade policy objective. 4
 The NTM database used in this work was retrieved from the work of Ghodsi et al. (2017) from The
Vienna Institute for International Economic Studies (wiiw, in its German acronym). The authors
processed NTM data from the subsection of goods of the World Trade Organization’s (WTO) Integrated
Trade Intelligence Portal (I-TIP). Since the original notification database is incomplete and does not
always display which HS 6-digit codes are affected by each measure, the authors applied an
identification strategy in order to match the missing codes. As a result, the notifications with missing
codes were reduced from around 45% to 22.3%. From their notification database, a panel ranging from
2001 to 2015 containing information about the existence of the different NTMs per year was constructed
for the analysis purposes of this paper.
 Some points are worth highlighting before moving on. First, there is still a number of notifications
for which a HS06 line has not been assigned. Second, only WTO members are listed as reporters,
because the database is built on notifications to the WTO by member countries. Therefore, this work
excludes from the estimation sample, import flows of non-WTO members to WTO members at any
point in the sample period. Third, the database has three types of dates (initiation, in-force and
withdrawal) which might have different features according to the type of NTM. For example, TBT and
SPS notifications, which comprise most of the NTM notifications, do not have information on the

4 See UNCTAD (2015) for further information on each type of measure. They provide a classification of NTMs, categorizing them into
 16 chapters (A to P) with several subgroups, alongside with definitions and examples.
ECLAC Integrating Latin America and the Caribbean: potential effects of removing tariffs... 16

withdrawal date. Although this might be a significant issue for countries applying a temporary measure,
these cases are not that frequent, since most of these measures are set on permanent basis. This is
further discussed in the estimation section. The fourth point is related to the reporting capacity of
different WTO members. According to Ghodsi et al. (2017) high income countries tend to be the heaviest
users of NTMs. They give two reasons for this, first, these countries ask for higher standards for the
products they consume and second, they have a better reporting capacity when compared to low
income countries. Some countries report every NTM applicable, whereas others report only NTMs
which depart from international standards. Lastly, according to ESCAP (2019), pre-1995 regulations,
since they were not “new” or “amended”, are not in the WTO database.
 One indicator that gives a clear picture of the percentage of trade that is under the regulation of
an NTM is the coverage ratio. In line with the definition by UNCTAD-World Bank (2018), the indicator
was calculated for each NTM type and each country group g in the following manner:
 ∑ ∑ ∑ ∗
 = � � ∗ 100 ∀ ≠ ,
 ∑ ∑ ∑
 where is a dummy variable reflecting the presence of an NTM imposed by country i to
country j in product k and is the value of imports for country i from country j in product k. On the
product dimension k, over 5,100 product lines of the Harmonized System of 1996 at the 6-digit level
(HS06) were considered. The number of countries included in group i was restricted to those members
of the WTO and it varies depending on the group g analyzed (for instance Latin America and the
Caribbean, 33 and China, 1). Lastly, the number of affected economies j is either 182 for non-EU
members or 156 for EU members.
 Calculated in a similar way, the frequency index captures the percentage of products that are
subject to one or more NTMs:
 ∑ ∑ ∑ ∗
 = � � ∗ 100 ∀ ≠ ,
 ∑ ∑ ∑
 where is defined as above and is a dummy which takes the value of one when country i
imports any quantity of product k from country j, and zero otherwise. 5 These indicators can be
calculated for different NTMs. For exposition issues, the following table shows these indicators for three
types of NTMs, namely SPS, TBT and QR, as well as its aggregated value.
 A first overview on table 3 shows that according to the I-TIP database, TBT measures are the ones
affecting most of the HS06 lines traded in 2015 and also covering most of the world’s imports in almost
all regions. In Latin America and the Caribbean, for instance, TBT regulations affected 48.7% of all
partner-products for which there was trade. These lines represented 78.1% of its imports. On the other
hand, SPS measures covered around 20% of trade of Latin America and the Caribbean, the United
States, the European Union, Japan and China, with its frequency index oscillating from 32.2% in the USA
to 14.1% in Latin America and the Caribbean. Japan, China and the group “Rest of the World” were the
ones with the highest percentage of trade under a quantitative restriction. Other kinds of NTMs are not
as frequently used as the ones previously mentioned and represented therefore a low frequency index
and coverage ratio. For a detailed description of coverage ratios by importing countries see Annex 4.

5 Considering only the country pair-product observations for which trade any quantity of trade was observed in a particular period might not
 give a complete picture of the frequency of NTMs. A modified frequency index is proposed and results are displayed in annex 3.
ECLAC Integrating Latin America and the Caribbean: potential effects of removing tariffs... 17

 Table 3
 Coverage ratios and frequency indexes for different importing regions
 (In percentages, 2015)
 Coverage Ratios Frequency Indexes
 All OtherN All Other
 Region/Country
 NTMs SPS TBT QR TM NTMs SPS TBT QR NTM
 Latin America 80.6 20.9 78.1 0.9 1.1 52.4 14.1 48.7 1.1 0.3
 and Caribbean
 United States 95.9 21.7 93.6 17.7 5.5 90.4 32.2 85.3 12.9 4.5
 Canada 96.3 16.0 95.8 5.2 0.4 91.9 17.5 91.4 9.2 0.2
 European Union 89.4 21.4 86.9 13.9 1.4 85.5 22.9 81.6 10.9 0.8
 Japan 100.0 19.2 89.2 100.0 1.2 100.0 19.6 86.8 100.0 0.8
 China 98.1 21.7 96.7 52.0 0.7 94.8 27.9 91.3 33.2 0.4
 Other Asia 71.7 11.7 47.4 39.0 0.9 61.6 14.6 42.5 31.2 0.4
 Pacific
 Middle East 66.3 10.1 54.6 20.4 1.1 52.1 8.4 45.2 11.0 0.5
 & North Africa
 Sub-Saharan 32.4 4.2 29.7 1.2 0.1 25.3 2.3 22.7 1.8 0.0
 Africa
 Rest of World 78.4 15.8 49.3 66.4 0.4 50.0 10.2 28.4 31.6 0.2
 World 83.6 17.3 73.8 30.0 1.8 59.6 13.9 50.4 16.4 0.5
Source: Author’s calculations.
Note: Intra-European Union trade was not considered so that coverage ratios and frequency indexes would not be downward biased. Some
HS06 codes, that were not relevant for the analysis, were also not taken into account. See annex 2 for details.

 By changing the dimension of the summation of the coverage ratio and frequency index formulas and
splitting products into a few product groups, the analysis can be transformed into a sectoral one. The
frequency indexes, taking into account all NTM types, reveal that agriculture, hunting and fishing followed
by processed foods, beverages and tobacco were the sectors with highest frequency of NTMs (82.3% and
79.9% respectively) while metals and derivatives (40.8%) wood and paper (41%) presented the lowest
percentage of products affected. Coverage ratios show higher figures among sectors, with agriculture,
hunting and fishing; processed foods, beverages and tobacco and machinery and equipment presenting
more than 90% of its HS06 trade under at least one NTM. When the ratio is broken down into the different
types of NTMs, one can observe that TBT regulation is covering relevantly most of the sectors while SPS
measures are more frequently used and therefore cover a higher percentage of trade in agriculture, hunting
and fishing and processed foods, beverages and tobacco. This goes in line with the purpose of an SPS
measure that is to protect human, animal or plant life from risks arising from additives, contaminants, toxins,
pests and diseases, prevent or limit the spread of pests and to protect biodiversity. Quantitative restrictions,
on the other hand, are more frequent in the sector of cars and transport equipment but it covers a higher
share of trade in the sectors of machinery and equipment and chemical and petrochemical.
 Table 4
 Coverage ratios and frequency indexes affecting different sectors
 (In percentages, 2015)
 Coverage Ratios Frequency Indexes
 All Other All Other
 Sectors
 NTMs SPS TBT QR NTM NTMs SPS TBT QR NTM
 Agriculture, hunting 93.7 84.6 86.5 25.9 3.0 82.3 69.5 71.2 19.0 0.3
 and fishing
 Oil extraction 65.0 3.1 58.9 25.8 0.0 59.7 19.7 54.3 13.5 0.1
 and mining
 Processed foods, bev. 93.4 87.2 90.7 19.5 7.0 79.9 68.7 75.0 10.0 1.8
 & tobacco
 Textiles, footwear 80.4 5.0 66.2 24.3 1.1 62.3 2.8 48.8 19.2 0.3
 and clothing
 Wood and paper 57.2 21.6 40.8 22.7 4.5 41.0 9.5 31.4 12.3 0.3
 Chemical 83.6 32.0 77.2 35.1 0.9 61.5 29.4 51.0 17.3 0.3
 and petrochemical
 Non-metallic minerals 63.6 1.7 57.9 12.0 2.4 49.7 2.1 43.1 12.1 0.8
 Metals and derivatives 62.8 1.8 50.0 18.9 6.4 40.8 1.1 32.5 12.3 1.4
ECLAC Integrating Latin America and the Caribbean: potential effects of removing tariffs... 18

 Coverage Ratios Frequency Indexes
 All Other All Other
 Sectors
 NTMs SPS TBT QR NTM NTMs SPS TBT QR NTM
 Cars and transportation 88.3 1.9 79.8 30.3 0.8 62.1 1.4 54.3 26.4 0.3
 equip.
 Machinery 91.4 1.8 77.9 35.0 0.7 62.3 1.8 54.4 17.3 0.1
 and equipment
 Other manufactures 81.9 2.7 74.4 21.2 2.1 49.7 3.1 40.6 16.6 0.1
 World 83.6 17.3 73.8 30.0 1.8 59.6 13.9 50.4 16.4 0.5
Source: Author’s calculations.
Note: Intra-European trade was not considered so that coverage ratios and frequency indexes would not be downward biased. Some HS06
codes, that were not relevant for the analysis, were also not taken into account. See annex 2 for details.

 One weakness of frequency and coverage ratios is its inability to capture the magnitude of NTM. If
country A imposes one NTM and country B imposes one hundred NTMs across all sectors and partners, its
frequency index and coverage ratios are going to be the same despite the difference in levels. The use of
count NTMs makes it possible to access this information. In order to do so, prevalence scores were computed
according to the formula below:
 ∑ ∑ ∑ ∗
 = ∀ ≠ ,
 ∑ ∑ ∑
 where is a count variable reflecting the number of NTMs imposed on the bilateral relationship by
country i on country j for product k. The variable is the same dummy used while calculating the
frequency indexes: whenever country i imported any quantity of product k from country j the dummy takes
up a value of one, and zero otherwise. This indicator weights the stock of NTMs using a simple average over
the products imported in a particular year. Another way to calculate the prevalence score is to weight it with
imported value figures, changing to . This allows us to calculate a trade-weighted prevalence score.
 Table 5 shows the results for the three most relevant NTM types for the year of 2015. A first conclusion
is that even though Latin America and the Caribbean, the United States, the European Union, Japan and
China have all around 20% of its trade covered by SPS measures (see table 3) there are significant differences
in the number of measures imposed by these country/regions. This means that despite the fact that all these
countries have no SPS measures affecting around 80% of its imports, the remaining 20% are under the
influence of different levels of measures. For instance, while the United States imposes on average 34.6
measures and China 20.1, Latin America and the Caribbean and the European Union impose on average 2.3
and 3.1 SPS measures, respectively. Canada, with an even lower coverage ratio (16%), and China follow the
US as the countries imposing on average more NTM per product.
 Table 5
 Prevalence score of NTMs imposed by different importing regions
 (Average number of measures, 2015)
 Trade weighted average Simple average
 Region/Country SPS TBT QR SPS TBT QR
 Latin America and the Caribbean 2.3 7.5 0.0 1.0 2.5 0.0
 United States 34.6 26.4 0.4 39.1 15.9 0.3
 Canada 30.7 18.8 0.1 42.5 7.6 0.2
 European Union 3.1 16.8 0.2 3.7 16.5 0.1
 Japan 9.6 11.8 8.5 7.9 7.5 8.0
 China 20.1 13.1 0.6 22.6 11.8 0.4
 Other Asia Pacific 3.6 3.2 2.3 3.1 2.4 1.4
 Middle East and North Africa 0.6 6.9 0.4 0.4 5.7 0.2
 Sub-Saharan Africa 0.1 1.3 0.0 0.1 0.8 0.0
 Rest of World 0.6 2.2 1.5 0.4 1.1 0.5
 World 11.4 12.1 1.2 4.0 5.7 0.6
Source: Author’s calculations.
Note: Intra-European trade was not considered so that coverage ratios and frequency indexes would not be biased downward. Some HS06
codes, that were not relevant for the analysis, were also not taken into account. See annex 2 for details.
ECLAC Integrating Latin America and the Caribbean: potential effects of removing tariffs... 19

 Turning to TBT measures, the world has a trade weighted average of 12.1 measures and a simple
average of 5.7 measures. This difference reflects the fact that more developed countries, which
represent a larger share of global trade, are also the ones imposing more measures. Latin America and
the Caribbean also present a lower prevalence score of TBTs compared to more developed nations such
as the United States, the European Union and others. On simple average basis, the three larger users of
TBTs are the EU, with 16.5 measures per partner-product, the USA, with 15.9 measures, and China with
11.8 measures. With respect to quantitative restrictions, Japan and the group of other Asia-Pacific
countries present the higher averages for 2015. All in all, the difference between developed and
developing nations observed in the coverage ratios and frequency indexes is also seen when the stock
of NTMs is analyzed.
 Taking the analysis of NTM stock to the sectoral level reveals more information. Both TBT and SPS
measures have a higher average in the sectors of agriculture, hunting and fishing; processed foods,
beverages and tobacco; and chemical and petrochemical, with SPS showing a higher average when trade
weights are used and a lower average when simple weights are employed. When trade weights are
considered, SPS measures have a higher stock of measures on average in the three abovementioned sectors
than TBT measures. On the other hand, the picture changes for all the other sectors with a higher stock of
TBT measures when compared to SPS measures. Trade of cars and transportation equipment has the
highest trade weighted average of TBT measures, 31.2 measures, highly influenced by 117-115 TBT measures
imposed by US to multiple partners in around 15% of this sector’s trade in just couple of products. 6 This sector
was followed by processed foods, beverages and tobacco (29.3) and agriculture, hunting and fishing (25.8)
as the ones with more TBTs on average. Around 1.2 QR measures affected on average the global trade. Other
NTMs were not displayed due to their low average (both simple and trade weighted), with most of the sectors
and country groups not reaching 0.1 measures in 2015.
 Table 6
 Prevalence score of NTMs affecting different sectors
 (Average number of measures, 2015)
 Trade weighted Simple average
 Region/Country SPS TBT QR SPS TBT QR
 Agriculture, hunting and fishing 63.2 25.8 1.0 25.9 21.9 0.6
 Oil extraction and mining 0.8 1.6 1.0 0.5 2.3 0.4
 Processed foods, beverages and tobacco 57.8 29.3 0.7 25.7 22.5 0.3
 Textiles, footwear and clothing 0.1 3.3 0.8 0.1 1.8 0.5
 Wood and paper 1.7 1.6 0.9 0.4 0.8 0.4
 Chemical and petrochemical 24.3 10.8 1.3 7.5 5.8 0.7
 Non-metallic minerals 0.1 2.7 0.5 0.1 2.3 0.4
 Metals and derivatives 0.1 2.6 0.7 0.0 1.4 0.4
 Cars and transportation equipment 0.0 31.2 0.9 0.0 8.3 0.7
 Machinery and equipment 0.1 9.5 1.8 0.2 5.0 0.7
 Other manufactures 1.2 12.8 0.9 0.7 3.0 0.5
 World 11.4 12.1 1.2 4.0 5.7 0.6

Source: Author’s calculations.
Note: Intra-European trade was not considered so that coverage ratios and frequency indexes would not be downward biased. Some HS06
codes, that were not relevant for the analysis, were also not taken into account. See annex 2 for details.

 This section sheds light on how NTMs are employed across different sectors and countries. Since
NTMs can be trade deterring as well as trade promoting, there is the need to assess the trade effects of
different NTMs in order to determine the direction of the impact, in case there is indeed a significantly
non-zero impact. The next section guides the reader through how these impacts were estimated on a
country-pair-product basis and presents the results.

6 The above mentioned products were 870310, 870390, 870332, 870331, 870324, 870322, 870323, 870321 and 870333.
ECLAC Integrating Latin America and the Caribbean: potential effects of removing tariffs... 21

 III. Estimated bilateral total protection

This section presents some results on potential trade impact coming from the unseen barriers of trade,
namely, from different types of NTMs. First, the methodology for estimating the impact of NTMs on
trade and its ad-valorem equivalent (AVE) is presented. Since it is possible for the same NTM to affect
partner countries differently, an identification strategy was chosen that allowed for the estimation of
bilateral trade effects without running out of degrees of freedom. 7 In the sequence the results, which
were estimated at the 6-digit level of the Harmonized System (HS06), are aggregated into a country
group-sector level. The aggregation was initially set up to 34 country groups and 33 sectors which fit a
Global Trade Analysis Project (GTAP) model for Latin America and the Caribbean. 8 This aggregation
allows the estimation of a Computable General Equilibrium (CGE) model. The following subsection
gives a brief overview on the methodology undertaken and specification chosen. In the sequence some
results are presented.

 A. Methodology for the estimation of AVEs barriers of NTMs
This section explains the methods used and assumptions held in order to calculate AVEs barriers of
NTMs. Bilateral volume trade effects of different NTMs were retrieved from Dolabella (2020) and were
converted to AVEs using GTAP import demand elasticities. 9
 Following the common practice in the literature, a gravity framework was selected for assessing
the impact of NTMs on trade, more specifically, the quantity based methodology where the variation of
trade quantities is used to identify AVEs of NTMs. As argued by De Melo and Nicita (2018), in practice,
the imposition of NTMs could result in an increase in price and a reduction in quantity, leaving the value

7 For intuition on how uneven NTM trade effects can be, see Dolabella (2020) and Bratt (2017).
8 Annex 1 display how countries were distributed into groups for the GTAP model.
9 The complete and detailed description of the estimation procedure, derivations of formulas, discussion on the econometric issues
 steaming from the chosen specification and the heterogeneity of NTMs and data analysis are found in Dolabella (2020).
ECLAC Integrating Latin America and the Caribbean: potential effects of removing tariffs... 22

of trade unaffected. Thus, this work chose to use traded quantities instead of the trade value as the
dependent variable in order to better capture the final impact of NTMs.
 Since NTMs are normally set on a disaggregated trade level (product level), regressions were
performed separately for all HS06 codes (as in Kee et al., 2009). This resulted in more than 5,000
regressions, which were estimated using a fixed effects Poisson Pseudo Maximum Likelihood (PPML)
estimator. The panel covered fifteen years, from 2001 to 2015. The NTM variable entered the equation
as a dummy variable, presenting a unity value whenever a positive number of measures applied to the
bilateral relationship, and zero otherwise. This variable was built from notifications imposed (and not
terminated) prior to the last year on the panel.
 One advantage of using panel data is that it is able to control for endogeneity stemming from
time invariant variables, normally included in cross section gravities (landlocked dummies, language,
culture, distance, among others). These and all other time invariant variables (observable and non-
observable) are controlled by the inclusion of fixed effects in the panel specification. On the other hand,
the choice for panel data makes simple bootstrapping methods invalid, since observations are no longer
independent and identically distributed. Therefore, this work drives apart from those studies which used
bootstrapping methods and exploited the cross sectional dimension of the data (Kee et al., 2009; Kee
and Nicita, 2016; Bratt, 2017).
 The model which was estimated in order to calculate the AVE impact NTMs in the bilateral trade
was specified as follows:
 10

 = exp � + 1 −1

 +�
 2 −1
 + 3 ℎ −1
 + 4 ℎ −1 + 5
 =1
 + 6 + 7 + 8 + � �

 where represents the quantity in tons imported by country j of product k from country i in

year t; stands for the tariff imposed by country j on country i at the product level;
represents a variable capturing the existence of measures applied by country j on country i for the NTM

type n, presented above. 10 The variables ℎ and are the share of the exporter country in the

world trade’s value of product k and the logarithm of its GDP. Similarly, ℎ and represent the
same variables from the importing economy. The remaining controls are time fixed effects ( ) and two
dummies; one dummy indicating the existence of a preferential trade agreement between countries i
and j ( ), and one indicating if both countries were members of the WTO at year t ( ). Lastly,

 stands for the residual. Even though no variation is found at the product dimension k, the subscript
is included to differentiate the variables measured at the product level from the ones measured at
national level (multilateral or bilateral). Annex 4 briefly describes the data source.
 The bilateral impact is estimated by the interaction of the NTM with specific variables of each
importing and exporting country. Following Kee and Nicita (2016), the variable of NTM is multiplied by
the percentage that the importing country and the exporter represent of the total value of imports and
exports of that product according to the equation below:
 1 = 1 + 11 ℎ + 12 ℎ ,
 2 = 2 + 21 ℎ + 22 ℎ

 .
 These import and export shares are taken as proxies of the market power of each importer and
exporter for each product. The intuition for this specification according to Kee and Nicita (2016) is that

10 As controls antidumping investigations and specific trade concerns were added to the regression. Results are not displayed.
ECLAC Integrating Latin America and the Caribbean: potential effects of removing tariffs... 23

compliance costs should be lower if the exporter has a larger share in the world trade of the product, which
results in smaller trade impact due to the presence of importing country’s SPS/TBT measures. However, it is
also possible that the exporter could easily divert their export to other market when face with burdensome
NTMs of a specific importer and the trade impact will be larger. Regarding importers, compliance costs for
exporters should be higher if the importer has a larger share in the world trade of the product, leading to a
larger trade impact. Also, a large market power makes it more difficult for exporters to divert trade to other
markets when faced with a new NTM, which would lead to a smaller trade impact.11 All in all, this
specification allows us to simulate a bilateral time-specific effect of NTMs without running out of degrees of
freedom.
 Such bilateral identification approach has been used before by the literature but is not free of criticism.
For instance, Cadot et al. (2018b) say that it does not describe a particular country’s estimated AVE; instead,
they simulate what the estimated AVE ought to be at that country’s level of trade share. The real impact
could only be captured by interactions with import and export dummies. In our case, estimation of bilateral
parameters using country dummies would be feasible since the data contains the time dimension providing
additional degrees of freedom. However, the chosen estimator PPML, required for gravity estimations with
many zero trade flows, presented computing problems in the presence of large numbers of dummies. This
problem was also described by Cadot et al. (2018b).
 Since the dependent variable, quantity imported in tons, is an estimated value, it may also carry noise
in its values. A few products showed a large share of its global trade value with missing quantities. Since
missing quantity values are not considered for estimating the parameters, the inclusion of such products
might bias some relevant bilateral trade effects. Hence, the impact of NTMs on these products was set to
missing. Another check was to examine if the impact was sensitive to the exclusion of outliers in terms of
implicit price. So, the above-mentioned model was re-estimated, eliminating outliers of the depended
variable at the product level. For this purpose, an observation was determined as an outlier whenever the
price (value over quantity) of the traded good was in the largest or smallest 1% of the distribution per year of
the panel. This was another attempt to increase the robustness of results (see annex 7).
 Some remarks on endogeneity are worth pointing out before moving on. To begin with, the simple
fact that estimations are carried at the very specific product level already eliminates the possibility of
unobserved product specific invariant factors being correlated with the NTMs. Secondly, this paper chose
not to include exporter-time and importer-time dummies because non-discriminatory trade policies, the
ones applied multilaterally such as safeguards and special safeguards would be perfectly collinear with the
number of imposed NTMs. This would preclude estimation of 1 and 21 . However, we include time
dummies to capture the time-varying heterogeneity that is common among the country pairs. In addition,
the variables of interest of this study are lagged by one period. As argued by Ghodsi et al. (2016a) there are
two reasons for this. First, demand takes time to react to policy changes, which seems particularly reasonable
for intermediate products. Second, for some NTMs, reverse causality should be a barrier to the estimation of
the true NTM effect. Sometimes, NTMs are the cause imports grow or reduce, so not only trade reacts to the
imposition of a NTM but also a NTM might be implemented to promote or reduce imports. The lagged value
of an NTM is expected to lessen this problem.
 Due to the fact that the bilateral impact of an NTM depends on three coefficients, the decision of
which of these coefficients to consider (in accordance with its significance) in the calculation of trade effects
can influence the value of the impact of each measure. Due to this tradeoff, two types of trade effects for
NTM were calculated: I) If the coefficient 2 , referring to the general impact of an NTM in that product, and
at least another one of the coefficients of the interactions ( 21 , 22 ) were significant at 10%, the trade
effect type 1 was calculated; and II) if any coefficient ( 2 , 21 , 22 ) was significant at 10%, the trade effect

11 A trade inducing effect may or may not come in a second stage, when consumers respond to new information provided by NTMs.
ECLAC Integrating Latin America and the Caribbean: potential effects of removing tariffs... 24

type 2 was calculated. Non-compliance with any of these requirements, on the other hand, means that the
impact does not differ from zero. Summing up the requirements:
 • Trade effect Type 1: Significant market coefficient plus at least one coefficient of the interaction
 between the NTM and the importer / exporter share significant;
 • Trade effect Type 2: At least one of the three coefficients significant;
 The next step comprised in transforming these trade effects of imposing an NTM into ad valorem
impacts. For this purpose, we use GTAPs elasticities which capture the impact of a price increase in the
import quantities across different sectors. Here it is assumed that the impact at the sectorial level is the same
as the one at the tariff line level. 12 The following equation shows that the trade effect of imposing an NTM
can be decomposed into how the NTM impact prices, i.e. an ad-valorem equivalent, and how the price affects
quantities, i.e. import demand elasticity:
 ∆ ∆ ∆
 = ∗ = ∗ ,
 ∆ ∆ ∆
 where the capital subscript K the GTAP sectorial group. Rearranging the terms and substituting the
NTM’s trade effects into the equation, AVEs were computed for each NTM type as follows:

 exp� +
 ∗ ℎ + ∗ ℎ � − 1
 = .

 As commonly assumed, a minimum of -100% was set to AVEs based on the intuition that the price
cannot drop beyond this value. Given the proposed estimation strategy, AVEs can be calculated for all
countries in the sample, independent if there was trade or an NTM in force. However, since the aim of this
study is to reach a measure of protection/promotion on trade due to NTMs, only the AVEs for which NTMs
were present were considered.
 Also, measures which by definition reduce trade (trade defense measures), such as ADP, CV, QR, SG
and SSG, but for which the estimation presented a trade promoting impact on the product level average
were set to zero. In case there were binding NTMs for a particular HS06 line but the estimated model
returned an error, this HS06 line was set to missing. So as to reduce the impact of the missing values, the
country-pair-sector group was reweighted and more weight was given to the barrier estimated to a similar
product from the bilateral relationship. 13 14
 The choice to specify the NTM variable as a dummy instead of a variable with the count of measures
is mainly because of what we are trying to capture here. When the NTM is inserted in as a binary variable, its
accompanying parameter captures the trade protection/promotion related to the existence of this NTM.
When a count variable is considered, the parameter captures the mean effect of imposing one additional
NTM. Since what we want to capture here is an overall protection/promotion associated with NTMs at the
bilateral dimension, the NTM dummy variable was chosen. Another advantage of using the dummy NTM is
that it reduces the probability of measurement error from our NTM variable. As previously mentioned, NTM
data do not have withdrawal dates for some types of NTM (including TBT and SPS). By using a count variable,
some measures that are imposed temporarily will not quit the stock of NTM and inflate the variable.
Although the problem is not completely eliminated when the dummy is used, it should be reduced.

12 Therefore the price impact on equals the impact on . For more information on import demand elasticities see annex 6.
13 Whenever all HS06 lines from a country-pair-sector group were missing, no value was input. Cases like these happened seldom.
14 The impact of setting missing values to zero is assessed in Annex 7 and results did not change much.
ECLAC Integrating Latin America and the Caribbean: potential effects of removing tariffs... 25

 B. Post estimation tests and identification coverage
Before moving to the analysis of results, an initial assessment of the regressions is performed. Out of the
5,111 products of the HS06 1996 classification with data available in the BACI database, 8 non-relevant codes
were not considered (stamps, antiques, collections and others). Out of the remaining 5,103 relevant product
lines, 326 lines presented some kind of estimation error. 15 Lastly, another 48 HS lines, representing 1.86% of
the world trade, were not considered because most of these products’ trade (in terms of value) lacked data
on its respective traded quantities. 16 Hence, 4,729 regressions were estimated at the product level.
 In order to assess if the regressions were correctly specified, the RESET test was performed. 17 Out of
the 4,514 models for which there were no errors with the RESET estimation, around 82% of the regression
did not reject the null that the model was correctly specified. This test was meant to assess the overall
acceptance of the specification and was not taken as a criterion to exclude HS06 lines from the analysis.
 All in all, some HS lines were not significant at 10% significance level. 18 As mentioned in the previous
section, in order to calculate the marginal effects from an NTM, the significance of three parameters had to
be assessed. Two of them are included in the figures: trade effect type 1 (TE1), which was calculated
whenever, the product specific parameter ( 2 ) and another importer/exporter parameter ( 21 , 22 ) were
jointly significant and trade effect type 2 (TE2), which was calculated whenever any parameter was
significant. By construction, the product coverage of TE2 has to be higher or equal to the coverage of TE1.
Figure 2 and 3 give a more complete description of the identification coverage of each of these marginal
effects by sector of the two main NTM types: SPS and TBT. The figures present the number of products, for
which, each kind of trade effect was calculated. Furthermore, one can see the number of products for which
there was no SPS/TBT applied at the global level as well as the number of products for which a SPS/TBT
existed, but no impact could be identified as statistically significant. Also, there is information on the number
of products for which an estimation error occurred. Panel A of both figures displays this information by
number of tariff lines while panel B weights each product by 2015’s global trade.
 The simple average over products shows that trade effects of SPS were calculated for more than 40%
of the total tariff lines using TE2 and for less than 20% using TE1. Weighting each tariff line by its relative
trade importance gives us slightly higher identification coverage when global trade weights are used. In
regard to sectors, SPS TE1 presented high identification coverage for wheat, other cereals, oilseeds, fiber
and vegetables, energy mining and dairy products when global trade weights are considered (see Figure 2).
On average, products for which an estimation error occurred were not many. Some sectoral aggregation
such as the rice and non-energy mining were most affected.

15
 Three types of errors were identified: (i) the PPML function did not converge after innumerous iterations, (ii) a discontinuous region
 was found in the PPML function and therefore an improvement could not be computed or (iii) the variance matrix was nonsymmetric
 or highly singular precluding the calculation of standard errors.
16 This work eliminated 1% of the lines (48) with most missing quantities in terms of traded value. Thus, products for which the missing
 quantities for the whole panel represented 19% or more of this product’s traded value were not taken into account. Among the most
 relevant products excluded are Non-industrial Diamonds (710231, 710239) and some types of vessels (890190, 890590 and 890520).
17 So as to conduct the test, the regressions for all products were re-estimated but this time including the squared fitted values as an
 additional regressor. This parameter significance was assessed and whenever this coefficient was statistically significant the model
 was considered as misspecified. This work used the significance level of 1%.
18 Considering trade effect type 1, the identification coverage was higher than in the works of Kee et al. (2009) and Bratt (2017) for instance.
You can also read