Village of Manchester Hazard Mitigation Plan Village of Manchester, Vermont - , 2017
←
→
Page content transcription
If your browser does not render page correctly, please read the page content below
Village of Manchester
    Hazard Mitigation Plan
             , 2017

Village of Manchester, Vermont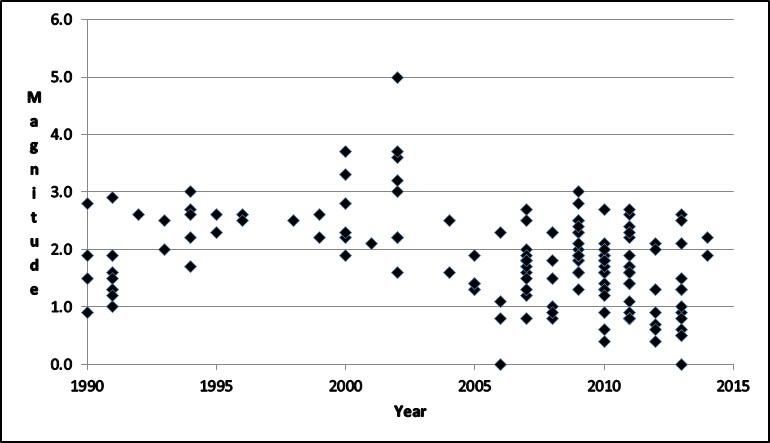
Table of Contents
List of Tables ................................................................................................................................................. 2
List of Figures ................................................................................................................................................ 2
I.      Introduction .......................................................................................................................................... 3
      A. Purpose ............................................................................................................................................. 3
      B. Mitigation Goals ................................................................................................................................ 3
II.     Village Profile ........................................................................................................................................ 4
      A. Regional Context ............................................................................................................................... 4
      B. Demography and Land Use ............................................................................................................... 4
      C. Economic and Cultural Resources..................................................................................................... 4
      D. Critical Facilities ................................................................................................................................ 5
III. Planning Process ................................................................................................................................... 5
    A. Planning Team................................................................................................................................... 5
    B. Public Involvement............................................................................................................................ 6
    C. Hazard Assessment ........................................................................................................................... 6
IV. Hazard Assessment ............................................................................................................................... 8
   A. Flooding and Fluvial Erosion ............................................................................................................. 8
   B. Winter Storms ................................................................................................................................. 13
   C. High Wind Events ............................................................................................................................ 16
   D. Hail .................................................................................................................................................. 19
   E. Temperature Extremes ................................................................................................................... 20
   F. Drought ........................................................................................................................................... 21
   G. Wildfire............................................................................................................................................ 22
   H. Earthquake ...................................................................................................................................... 24
   I. Landslide ......................................................................................................................................... 26
   J. Invasive Species .............................................................................................................................. 27
   K. Hazardous Material Spill ................................................................................................................. 29
V.      Vulnerability Assessment .................................................................................................................... 34
      A. Prioritization of Hazards ................................................................................................................. 34
      B. Priority Hazards ............................................................................................................................... 34
VI. Mitigation Measures ........................................................................................................................... 35
   A. Hazard Mitigation Goals.................................................................................................................. 35
   B. 2005 Hazard Mitigation Plan........................................................................................................... 36
   C. Village Plan of Development ........................................................................................................... 37
   D. State and Regional Plans and Programs ......................................................................................... 37
   E. Current Programs Supporting Mitigation ....................................................................................... 39
   F. Village Capabilities .......................................................................................................................... 39
   G. Mitigation Actions ........................................................................................................................... 43
VII. Plan Maintenance ............................................................................................................................... 51
    A. Annual Monitoring and Continued Public Involvement ................................................................. 51
    B. Plan Evaluation and Update ............................................................................................................ 51
    C. Post Disaster Review and Revision ................................................................................................. 52
VIII. References .......................................................................................................................................... 53
A. Literature and Reports .................................................................................................................... 53
B. Map Data Sources ........................................................................................................................... 55
C. Personal Communication Sources .................................................................................................. 56
List of Tables
Table 1. Number of properties by classification. .......................................................................................... 4
Table 2. Manchester Critical Facilities. ......................................................................................................... 5
Table 3. Planning Commission members ...................................................................................................... 6
Table 4. Dates of planning meetings and public and agency review ............................................................ 6
Table 5. Total number of flood events by type and year for Bennington County. ....................................... 9
Table 6. Months where rainfall exceeded the 90th percentile.................................................................... 11
Table 7. Structures by type in flood hazard zones in the Village of Manchester, VT. ................................ 13
Table 8. Total number of winter storm events by type and year for Bennington County. ........................ 13
Table 9. Summary of wind events in Bennington County........................................................................... 17
Table 10. Sunderland normal temperatures and precipitation for 1981 to 2010. ..................................... 20
Table 11. Years and number of months when the PHDI indicated severe or extreme droughts. .............. 21
Table 12. Wildland fire size classes. ............................................................................................................ 23
Table 13. Earthquakes in Vermont. ............................................................................................................ 24
Table 14. Landslide and debris flow types. ................................................................................................. 27
Table 15. Designated Class B noxious weeds in Vermont. ......................................................................... 28
Table 16. Aquatic invasive species in Vermont. .......................................................................................... 28
Table 19. Vulnerability assessment. ........................................................................................................... 35
Table 21. Comparison of Vermont vs. Village of Manchester Hazard Mitigation Plans ............................. 37
Table 22. Capabilities of the Village of Manchester ................................................................................... 40
Table 23. Ranking of mitigation actions...................................................................................................... 43
Table 24. Mitigation Actions. ...................................................................................................................... 44
List of Figures
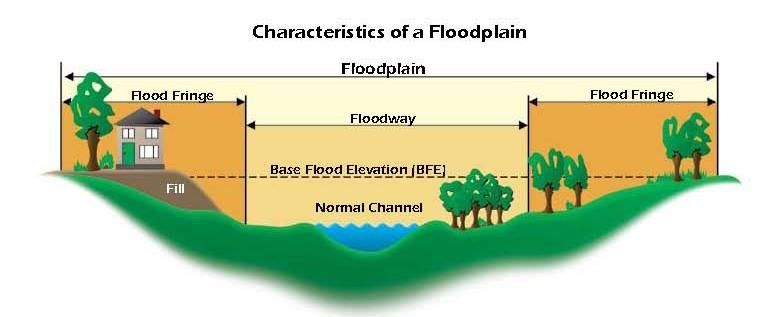
Figure 1. Typical floodplain ......................................................................................................................... 12
Figure 2. River corridors .............................................................................................................................. 12
Figure 3. Plot of earthquakes and magnitude for occurrences within 100 miles of Manchester, VT ........ 26
Figure 4. Disease cases in Bennington County from 2006 to 2015. ........................................................... 33
List of Maps (follow end of document)
Map 1. Village of Manchester
Map 2. Village of Manchester Land Cover
Map 3. Village of Manchester Land Use Designations
Map 4. Village of Manchester Critical Facilities
Map 5. Village of Manchester Special Flood Hazard Areas and River Corridors
Map 6. Village of Manchester Groundwater Resources
Map 7. Village of Manchester Wildfire Potential
Map 8. Village of Manchester Landslide PotentialI. Introduction
A. Purpose
Hazard mitigation actions are designed to reduce potential losses from natural hazards such as
flooding, landslides, wildland fire, and similar events. Hazard Mitigation Plans identify, assess and
prioritize those hazards and present actions that a community can undertake to reduce risks and
damage from those natural hazards (FEMA 2013a).
This Plan is intended to identify, describe and prioritize potential natural hazards that could
affect the Village of Manchester in Bennington County, Vermont and provide specific measures to
reduce or avoid those effects. The Federal Emergency Management Agency, within the U.S. Department
of Homeland Security and the Department of Vermont Emergency Management both advocate the
implementation of hazard mitigation measures to save lives and property and reduce the financial and
human costs of disasters.
The format of this Plan is as follows. Section II provides a profile of the Village, including a
discussion of the environmental setting, demographics and settlement patterns. Section III describes the
planning process along with lists of members of the planning team and dates of meetings and public and
agency review. Section IV analyzes the following hazards:
Winter Storms
High Wind Events
Hail
Temperature Extremes
Drought
Wildfire
Landslides and Debris Flow
Earthquake
Hazardous Materials Spill
Infectious Disease Outbreak
Invasive Species
Section V assesses vulnerability, and Section VI discusses mitigation goals and actions, including current
programs and Village capabilities. Section VII describes how the plan will be maintained and updated.
B. Mitigation Goals
The Village identified the following mitigation goals:
1. Reduce injury and loss of life resulting from natural disasters.
2. Reduce damage to public infrastructure, minimize disruption to the road network and
maintain both normal and emergency access.
3. Establish and manage a program to proactively implement mitigation projects for roads,
bridges, culverts and other municipal facilities to ensure that community infrastructure
is not significantly damaged by natural hazard events.
4. Design and implement mitigation measures so as to minimize impacts to rivers, water
bodies and other natural features, historic structures, and neighborhood character.
5. Increase the economic resiliency of the Village of Manchester by reducing the economic
impacts incurred by municipal, residential, agricultural and commercial establishments
due to disasters.
3|Page6. Incorporate hazard mitigation planning into other community planning projects, such as
Village Plan of Development, Capital Improvement Plan, and Local Emergency Operation
Plan
7. Ensure that members of the general public continue to be part of the hazard mitigation
planning process.
II. Village Profile
A. Regional Context
The Village of Manchester is located in the northern part of Bennington County, Vermont and is
surrounded by the Town of Manchester. Just beyond the border of Manchester are the towns of
Arlington, Dorset, Rupert, Sandgate, Sunderland, Stratton and Winhall (Map 1). Route 7A is the main
route through the Village, and a railroad from New York though North Bennington, Arlington and
Sunderland also passes along the eastern border on the way to Rutland.
B. Demography and Land Use
The population as of 2010 was 749 people, and the Village population increased 24.4% since
2010 (BCRC 2015). This represents approximately 17.1% of the Town of Manchester population (Village
of Manchester 2016).
The main settled areas are within the Batten Kill valley which also represents the main
transportation corridors for US 7 and Route 7A. To the west is Mount Equinox, which is primarily
forested, and to the east are the Green Mountains, also forested. There are some agricultural lands
primarily scattered outside of the village center and intermixed with forested lands (Map 2).
C. Economic and Cultural Resources
Table 1. Number of properties by classification. Economic resources are best summarized by the
Source: Village of Manchester 2016 types of uses, which are described in the Village of
Manchester Plan of Development (2016). The
Residential 276
property types and the assessed values of different
Commercial 48 classes of properties total 485 parcels, not
Commercial Apartments 4 including 22 non-tax parcels, for a total value of
Seasonal Home 0 $319,657,717.00 (Table 1). Map 3 shows the land
Mobile Home 0 use designations from the 2016 draft Village Plan
Farm 0 of Development and from the 2012 Manchester
Town Plan. Most commercial and industrial uses
Utilities 2
area located in the areas designated for
Woodland 132 commercial uses, which are located within the
Miscellaneous and Other 23 valley areas of the Town and Village.
Total 485
The Village Plan of Development (2016) identifies the following important historic buildings,
locations and institutions:
The Equinox, a large hotel serving the region,
Mark Skinner Library, a former library now a residence,
Burr and Burton Academy, an independent secondary school,
Hildene, an educational facility serving the region,
First Congregational Church,
St. John’s Episcopal Church,
4|Page The Courthouse, which includes the Village offices and the County court system,
Dellwood Cemetery,
Southern Vermont Arts Center which houses visual and performing arts,
Equinox and Ekwanok Golf Courses,
The Orvis Company, a major manufacturer of fly-fishing gear and
Johnny Appleseed Bookstore, a historic building adjacent to the Equinox Hotel.
The concentration of development provides for large areas, primarily in higher elevations and
steeper slopes, to remain forested, though most of these are beyond the boundaries of the Village and
in the Town. At the same time, the costs of maintenance of major roads, water and sewer and other
services are reduced.
Both Manchester and the Village of Manchester have historic districts (Map 3) designed to
provide protection for important historic buildings.
D. Critical Facilities
Table 2 lists and describes critical facilities including Village facilities, utility substations, schools,
sites with hazardous substances, and the areas served by Town water and sewer services. These are
labeled and shown on Map 4. The transportation system also represents a set of critical facilities. The
Village contains 2.007 miles of Class 1 roads, 3.390 miles of Class 2 roads, and 3.690 miles of Class 3
roads for a total of 9.087 miles of roads maintained by the Village. Route 7A or Main St. is maintained by
the Village. US 7, which is outside of the Village, is a main route from Bennington to Manchester and
further north (Vermont Agency of Transportation, 2015).
Table 2. Manchester Critical Facilities.
Source: VCGIS and Manchester Planning Team
Label Name Description
1 Town of Manchester Water & Sewer Department Town water and sewer facilities
2 Burr and Burton Academy Education facility
3 Maple Street School Education facility
4 Shaw’s Major grocery
5 The Equinox Lodging and major business
6 Village of Manchester Office Village government
7 Village of Manchester Highway Department Village garage
8 The Golf Club at the Equinox Public attraction or landmark building
9 Manchester Tank #1 Water storage tank
III. Planning Process
A. Planning Team
The Bennington County Regional Commission began discussions with the Village on developing a
Hazard Mitigation Plan in 2014. The Village Board of Trustees decided to initiate planning in 2015. This is
the first stand-alone Hazard Mitigation Plan for Manchester, though the Town of Manchester was part
of a multi-jurisdictional plan that expired in 2010. The hazard mitigation planning team consisted of
members listed in Table 3 below.
5|PageTable 3. Planning Commission members
Name Affiliation
Karen Walla Planning Commission Chair
Tom Deck Planning Commission and Village Trustee
Donald Brodie Planning Commission Member
Al Michaels Planning Commission Member
Constance West Planning Commission Member
Nina Mooney Planning Commission Member
Andrea Ross Planning Commission Member
Eric Scott Administrative Officer
Alan Mowrey Road Foreman
Anthony MacLaurin BCRC Representative
B. Public Involvement
The Village started the planning process in the fall of 2015 and held several meetings of the
planning committee. These meetings were warned according to the Vermont Open Meetings Law, and
dates are listed in Table 4.
Table 4. Dates of planning meetings and public and agency review
Meeting Date (s)
Board of Trustees initiates planning process October 5, 2015
Planning Commission organizational meeting December 3, 2015
Planning Commission meeting
Planning Commission meeting
1st Draft made available for public and agency review
by the planning Commission
Select Board meeting and vote to send to FEMA
The Plan was posted on the Village website and on the website of the Bennington County
Regional Commission. The Plan was also sent to:
The Town Manager of the Town of Manchester
The Chair of LEPC 7
The Director of the Bennington County Conservation District
All were asked to share the Plan with appropriate Town staff and officials. Comments were
requested by email, phone or letter and were to be sent to Michael Batcher at the Bennington County
Regional Commission.
C. Hazard Assessment
The following sections provide a detailed assessment of each of the hazards based identified by
the planning team based on data from the following sources listed in Section VIII References:
6|Pagea. Local knowledge,
b. The National Climate Data Center (NCDC) storm events database (most recent data from
their FTP site),
c. FEMA lists and descriptions of past disaster declarations,
d. The Vermont Department of Forests, Parks and Recreation data on wildfires,
e. HAZUS runs on potential earthquake damage,
f. Cooperative weather observer data and station normal where available,
g. Palmer Hydrologic Drought Index calculated from 1985 to 2014 from the National
Oceanographic and Atmospheric Administration (NOAA),
h. Hazardous materials spills from the Vermont Agency of Natural Resources (VT ANR),
i. Infectious disease outbreaks listed from the Vermont Department of Health,
j. Observations of invasive species compared to the state and federal lists of noxious species,
k. The Vermont Hazard Mitigation Plan (2013),
l. New England Weather, New England Climate (Zielinski and Keim 2003), Vermont Weather
Book (Ludlum 1996),
m. FEMA 2010 Flood Insurance Study, Bennington County, Vermont and Incorporated areas,
Federal Emergency Management Agency Study Number 5003CV000A,
n. National Weather Service 2014. Advanced Hydrologic Prediction Service, stream gauge
information for the Hoosic River near Williamstown, MA. Available via:
http://water.weather.gov/ahps2/hydrograph.php?wfo=aly&gage=wilm3,
o. Spatial Hazard Events and Losses Database (SHELDUS) records which were not as complete
as NCDC and, therefore, not used,
p. Fuel types and potential for wildfire from LANDFIRE (http://www.landfire.gov/) and from
the Vermont Department of Parks, Forests and Recreation,
q. Vermont Agency of Natural Resources and Vermont Agency of Agriculture, Food and
Markets on invasive species and
r. Identification of ranking of the potential for landslides by Josh Duncan (2015), a student at
Green Mountain College using a modified protocol based on Clift and Springston (2012).
With respect to NCDC data, there have been numerous changes to that database in just the last
few years. While NCDC data goes back to 1950, there was a dramatic change in 1996 in the way data
were collected. The number of events recorded in years prior to 1996 is far less than from 1996 onward.
Therefore, for the best reliable data, we used only data from 1996 onwards. We have also looked at the
other sources of historical weather data. The cooperative weather observers for Peru, Sunderland and
Pownal in Vermont have the most consistent long-term data, though some data is available from the
North Adams, MA observer. The only stream gauge is in Bennington near the New York border on the
Walloomsac, which is in a different watershed than the Batten Kill, which borders the Village of
Manchester. There are no weather stations that record or keep long term data records in the Village of
Manchester except for the cooperative weather listed above observers who record daily observations,
but not the specifics of storm events.
We have communicated with USGS which is working on models of areas impacted by different
storm events using Lidar and stream gauge data, but they are not working in Vermont as yet as far as we
know. We looked at the USGS high water marks for Hurricane Irene (2011) (Medalie and Olson 2013),
but they were located only along the Batten Kill in Arlington and portions of the Roaring Branch and
Walloomsac in Bennington with none recorded in the Village of Manchester. Therefore, we relied on the
updated special flood hazard maps for potential flooding extent.
7|PageFinally, we reviewed several studies on potential impacts of climate change developed by the
Intergovernmental Panel on Climate Change (Christensen et al 2013), the Vermont Agency of Natural
Resources (Tetra Tech 2013), the University of Vermont (Galford et al. 2014), the Global Climate Change
Research Program (Horton et al 2014), and the U.S. Forest Service (Rustad 2012). The relationship
between climate change and the frequency and extent of natural hazards is a developing science, and
we describe, where appropriate, how climate change might affect hazards in the future.
IV. Hazard Assessment
A. Flooding and Fluvial Erosion
1. Description
a. Flooding
Flooding and associated fluvial erosion are the most frequent and damaging natural hazards in
Vermont. The National Weather Service (2010) defines a flood as “any high flow, overflow, or
inundations by water which causes or threatens damage.” A flash flood is …”a rapid and extreme flow of
high water into a normally dry area, or a rapid water rise in a stream or creek above a predetermined
flood level.” These are usually within six hours of some event, such as a thunderstorm, but may also
occur during floods when rainfall intensity increases, thereby causing rapid rise in flow. The NWS uses
the following impact categories:
Minor Flooding - minimal or no property damage, but possibly some public threat.
Moderate Flooding - some inundation of structures and roads near stream. Some evacuations of
people and/or transfer of property to higher elevations.
Major Flooding - extensive inundation of structures and roads. Significant evacuations of people
and/or transfer of property to higher elevations.
Record Flooding - flooding which equals or exceeds the highest stage or discharge observed at a
given site during the period of record keeping.
Floods may reach these magnitude levels in one or more reaches, but not necessarily all. Runoff
from snowmelt in the spring, summer thunderstorms, and tropical storms and hurricanes can all result
in flooding in the Village of Manchester. Ice jam flooding can occur on Vermont rivers when substantial
ice forms followed by several days of warmth, snowmelt and any rainfall leading to ice breakup. As the
ice breaks up on the rivers, chunks of ice form jams which cause localized flooding on main stem and
tributary rivers. Ice jams are most prevalent during the January thaw (late January) and in March and
April as spring approaches.
Flash floods can occur after spring melt of mountain snow, following large storms such as
Hurricane Irene (2011), or after significant thunderstorms. Digital flood zone maps have been prepared
and are currently under review. Map 5 shows the location of both flood hazard zones and river corridors
(formerly fluvial erosion hazard zones).
Most development in the Village is located 200-300 feet above the valleys along the Batten Kill.
Munson Brook and Spring Brook both flow from Mount Equinox on the west through the Village to the
Batten Kill and contain narrow flood hazard areas. Headwaters streams like these can be very flashy, and
while some flood losses are the result of inundation, more often flood losses are caused by fluvial
erosion. Fluvial erosion can range from gradual bank erosion to catastrophic changes in the location of
the river channel (Vermont River Management Program 2010). There are three dams located within the
Village (Map 5). Equinox Pond is categorized as having significant hazard potential.
8|Pageb. Fluvial Erosion
In Vermont, most rivers flow through relatively confined valleys, but still meander over time
across the floodplain. River corridors provide an area within which a river can move across the
landscape as it dissipates energy and transports and deposits sediments. Where rivers are constricted by
bridges and other structures or rip rap, the water moves at higher velocity, resulting in downcutting and
collapse of the banks. This may undermine structures within the corridor.
2. Previous Occurrences
Ludlum (1996) describes numerous storm events that have affected Vermont since settlement,
but the local impacts of these are difficult to trace. The 1927 flood was the largest disaster in the history
of the state. The state received over six inches of rain, with some areas receiving 8-9 inches. Following a
rainy October, this storm occurred from November 2nd through the 4th causing extensive flooding. Two
storms occurred in March of 1936. Heavy rains and snowmelt caused significant flooding. Two years
later, the 1938 hurricane caused both flooding and extensive wind damage.
Table 5 shows a total of 49 flood events in Bennington County from 1996 to 2015, using NCDC
data. These have been primarily minor and affected either specific streams, such as the Batten Kill and
the Walloomsac, or specific municipalities.
Table 5. Total number of flood events by
type and year for Bennington County. Hurricanes and tropical storms that form in
Source: NCDC 2015 tropical waters have historically affected New England, but
Year Flash Flood Flood Total are relatively infrequent. Besides the 1938 storm, Tropical
1996 3 6 9 Storm Belle brought significant rains to Vermont in 1976
and Hurricane Gloria brought rain and wind damage in
1997
1985. Manchester has been subjected to two major
1998 1 3 4
tropical storms in the past twenty years. Hurricane Floyd
1999 2 2
was a Category 4 storm before hitting North Carolina, and
2000 4 1 5 then was reduced to a tropical storm when it reached
2001 southern New England. Hurricane Irene (2011) a Category
2002 1 1 1 hurricane which has winds of 74-95 miles per hour and
2003 2 2 could damage roofs, down shallow-rooted trees and
2004 1 5 6 damage power lines
2005 5 5 (http://www.nhc.noaa.gov/aboutsshws.php).
2006 1
The following describes nine moderate and
2007 1 1 2
extreme events that have occurred since 1996, using the
2008 National Weather Service (2010) categories, which
2009 2 2 affected both the Town of Manchester and the Village or
2010 nearby areas. These events were described in the National
2011 3 3 6 Climate Database records (2014). It should be noted that
2012 only the January 1996 event occurred in the winter, with
2013 4 4 all other events in the spring, summer or fall. Ice jam
2014 flooding does occur and one instance of damage is
2015 described below.
Total 22 27 49 January 19 to 20, 1996 (DR-1101 1/19 to 2/2 1996): An
intense area of low pressure which was located over the Mid-Atlantic region on Friday morning January
19th produced unseasonably warm temperatures, high dew points and strong winds. This resulted in
rapid melting of one to three feet of snow. In addition to the rapid snowmelt one to three inches of rain
9|Pagefell as the system moved northeast along the coast. This resulted in numerous road washouts and the flooding of several homes across the county. *Note that this was also categorized as a High Wind event. April 24, 1996: Significant rains on Tuesday evening April 23 resulted in flooding along the Walloomsac and Batten Kill Rivers in Bennington County. The Walloomsac River crested 1.5 feet over flood stage at North Bennington and the Batten Kill crested one foot over flood stage at Arlington. The flooding resulted in several road closures but much of the flooding was minor. September 16 to 17, 1999 (DR-13079/16-21 1999): The remnants of Hurricane Floyd brought high winds and heavy rainfall (3-6 inches) to southern Vermont. Many smaller tributaries reached or exceeded bankfull. Estimated wind gusts exceeded 60 mph, especially over hill towns. Power outages occurred across southern Vermont. A Cooperative Weather Observer recorded 4.94” of rain in Sunderland. July 14-17, 2000 (DR- 1336 7/14-18 2000): Thunderstorms caused torrential rainfall with flash flooding washing out sections of roadways in northeast Bennington County and southern Bennington County. Route 7 was closed due to flooding and rockslides and 67 was closed due to flooding. Numerous other roads were closed, with some washed out. This rain produced enough runoff to cause the Batten kill to exceed the six foot flood stage by about a foot at Arlington, Bennington County, representing a 47 year high. The swelled river flooded the Batten Kill Canoe Company and adjacent river property. A Cooperative Weather Observer recorded 3.39” of rain in Sunderland. July 21 to 18 August 2003 (DR-1488 7/21-8/18 2003): Severe storms and flooding affected Vermont including Bennington County. (Note: this event does not appear in the NCDC data.) A Cooperative Weather Observer recorded sporadic and sometimes large amounts of precipitation during that period in Sunderland. March 31 through April 2, 2004: As much as three inches of rain fell between March 31st and April 2nd across southern Vermont. This rain combined with the last of the snow melt to produce an excessive runoff of water. As a result, flooding took place in Bennington County. The Manchester Schools were closed due to flooding. The gage on the Batten Kill River in Arlington, rose to 6.90 feet, nearly a foot above the 6-foot flood stage during the predawn hours of April 3rd. April 16-17 2007 (DR-1698 4/15-21 2007): An intense coastal storm spread heavy precipitation across southern Vermont, starting as a mixture snow, sleet and rain which changed to all rain. Liquid equivalent precipitation totals ranged from three to six inches leading to minor flooding across portions of southern Vermont. A Cooperative Weather Observer recorded 3.54” of rain in Sunderland. August 28-29, 2011 (DR-4022 8/27-29 2011): Hurricane Irene produced widespread flooding, and damaging winds across the region. Rainfall amounts averaged four to eight inches and fell within a twelve hour period. A Cooperative Weather Observer recorded 5.16” of rain in Sunderland. In Bennington County, widespread flash flooding and associated damage was reported countywide, with many roads closed due to flooding and downed trees and power lines. Strong winds also occurred across southern Vermont, with frequent wind gusts of 35 to 55 mph, along with locally stronger wind gusts exceeding 60 mph. The combination of strong winds, and extremely saturated soil led to widespread long duration power outages. September 7, 2011: Large amounts of moisture from the remnants of Tropical Storm Lee interacted with a frontal system producing heavy rainfall with total rainfall amounts ranging from three to seven inches led to widespread minor to moderate flooding across southern Vermont. A Cooperative Weather Observer recorded 4.63” of rain between September 5th and 9th. 10 | P a g e
c.      Extent and Location
        Within the Village of Manchester, there have been only minor damages from past flooding
events. The dam on Munson Brook may need to be replaced and at least two houses in that area are
candidates for flood proofing. There have been no NFIP-designated repetitive losses within the Village of
Manchester. No damages were recorded within the Village following Hurricane Irene (2011). However,
just outside the Village, Richville Rd. was flooded. Cell phone service was lost in Manchester, resulting in
poor communications.
        In addition to the above events, the Peru, Pownal and Sunderland Cooperative Observer
recorded precipitation. Table 6 shows those months by year where that value exceeded the 90th
percentile, which varies by site and month. Several events of that magnitude have occurred where
flooding was not recorded in NCDC records or local knowledge, but this does provide additional
information on potential flooding extent.
 Table 6. Months where rainfall exceeded the 90th percentile
 (precipitation totals, in inches, in parentheses) of monthly precipitation at the Peru, Pownal and
 Sunderland Cooperative Observer Stations from 1990 to 2013.
                 Sunderland                                Pownal                          Peru
    Month                     Year                           Year                           Year
 January         1990, 1998, 1999 (5.98”)       1996, 1998, 1999 (4.29”)          1990, 1999 (5.79”)
 February        2002, 2008, 2011 (3.58”)       1990, 2008 (3.53”)                2000, 2002, 2008
                                                                                  (4.93”)
 March           2001, 2007, 2008 (5.35”)       1999, 2001, 2007 (4.42”)          2001, 2008 (6.15”)
 April           1993, 1996, 2002, 2007,        1990, 1993, 1996 (4.76”)          1996, 2007 (5.95”)
                 2011 (4.74”)
 May             1990, 2000, 2006 (6.31”)       1990, 2013 (6.50”)                1990, 2012 (7.70”)
 June            1998, 2002, 2006 (7.67”)       1998, 2000, 2002, 2013            1998, 2006, 2011,
                                                (7.27”)                           2013 (8.94”)
 July            1996, 2004, 2008 (6.87”)       2004, 2010 (6.34”)                1996, 2000, 2013
                                                                                  (7.41)”
 August          1990, 2003, 2011 (7.38”)       1990, 1991, 2003, 2011            1990, 2003, 2011
                                                (7.24”)                           (8.65”)
 September       1999, 2003, 2011 (5.75”)       1999, 2004, 2011 (6.13”)          1999, 2003, 2011
                                                                                  (7.13”)
 October         2005, 2007, 2010 (7.05”)       1995, 2003, 2010 (5.46”)          1995, 2005, 2006, 2010
                                                                                  (8.30”)
 November        2002, 2004, 2005 (5.28”)       2005 (5.36”)                      2002 (6.37”)
 December        1996, 2003, 2008 (6.42”(       1990, 2003, 2011 (4.62”)          1996 (7.18”)
The average annual precipitation in Vermont has increased 5.9” since 1960. This trend is predicted to
continue so that Vermont streams will have higher flows and possibly experience more frequent and
greater flooding events (Galford et al. 2014).

11 | P a g e
Special Flood Hazard Areas: these are areas mapped by FEMA and using the LIDAR derived zones that were adopted in late 2015. Table 7 shows the number of structures, by type, in the special flood hazard and river corridors, and both areas are shown in Map 5. Figure 1 below shows the parts of a typical floodplain. Figure 1. Typical floodplain Figure 2. River corridors River Corridors: River corridors (Figure 2), previously known as “fluvial erosion hazard areas,” have been mapped by the Vermont Agency of Natural Resources using geospatial data and will be modified by VT ANR river scientists using available field data. The data were used to calculate the “meander belt width” or area within which a river would move. As rivers shift their location both vertically and horizontally, erosion of adjacent lands can occur and threaten properties that may be outside of special flood hazard areas. 12 | P a g e
d.      Probability, Impact, and Vulnerability
Based on data from 1996 to 2015, nine moderate or major flood events have affected areas within or
                                                               near the Village of Manchester resulting in
  Table 7. Structures by type in flood hazard zones in the     a 50-60% chance of such an event
  Village of Manchester, VT.                                   occurring. Table 7 tallies the number of
  Source: Vermont Center for Geographic Information            structures by type within the river corridor
  www.vcgi.org                                                 and special flood hazard area. The Village
          Type           Number in special         River       has a total of 361 single family residences,
                          flood hazard zone      Corridor      27 multi-family dwellings, 64 seasonal
  Single-Family                    7                 5         homes, 79 commercial/industrial
  Multi-Family                     0                 1         establishments, 87 camps, 13 lodging
  Commercial                       1                 0         establishments and 19 government,
  Other Commercial                 1                 0         church, public gathering and school
                 Total             9                 6         buildings, and 10 other uses. As shown in
                                                               Table 7, there are 9 structures in the
special flood hazard area and 6 in the river corridor recently mapped by VT ANR. Therefore, the
potential proportion damaged within the Village from severe flooding would range from 1-10% with
injuries of 1-10%. Most services recover in less than seven days, though help for specific property
owners may take significantly longer.
        B.      Winter Storms
        1.      Description
        Winter storms are frequent in Vermont. Winter storms may consist of heavy snow, mixed
precipitation, or ice storms and all may be accompanied by strong winds. Potential damages can include
power outages, traffic accidents, and isolation of some areas. For example, the October 4, 1987 storm
stranded travelers in the area and knocked out power for several days. The "Blizzard of ’93," one of the
worst storms this century, virtually shut down Vermont on the weekend of March 13-14, forcing the
closure of roads and airports. This was one of the most powerful snowstorms on record. Snowfall
amounts ranged from 10 to 28 inches across the state. In rare cases, the weight of snow may collapse
roofs and cause other structural damage. Wind can also accompany snowstorms increasing the effect of
the snow damages. In addition to snow, ice storms occur when the lower levels of the atmosphere
and/or ground are at or below freezing, and rain is falling through warmer air aloft. The precipitation
freezes upon contact with the ground, objects on the ground, trees and power lines.

        Table 8. Total number of winter storm events by type and year for Bennington County.
        Source: NCDC 2015
                             Heavy       Ice     Winter        Winter
        Year       Blizzard  Snow      Storm     Storm        Weather            Totals
        1996                    5                   2                              7
        1997                    1                   7            2                 10
        1998                                        2            1                 3
        1999                                        4                              4
        2000                    1                   6                              7
        2001                                        6                              6
        2002                                        2                              2
        2003                                        5                              5

13 | P a g e
Table 8. Total number of winter storm events by type and year for Bennington County.
Source: NCDC 2015
Heavy Ice Winter Winter
Year Blizzard Snow Storm Storm Weather Totals
2004 2 2
2005 1 3 2 6
2006 0
2007 3 1 6 4 14
2008 4 2 1 11 17
2009 3 1 10 14
2010 3 1 2 6
2011 5 5 10
2012 4 2 6
2013 2 1 3 7
2014 2 4 6
2015 1 6
Totals 1 28 2 64 47 135
2. Previous Occurrences
Table 8 summarizes the 143 winter storm events that have occurred in Bennington County since
1996. As can be seen, a high number of events occurred in 1997, 2007, 2008, 2009 and 2011. Using
NCDC data, we categorized the extent of each storm with storms ranked as “High” if they produced
more than twelve inches of snow or were categorized by the NCDC as producing heavy or record snows
or blizzards or significant icing. The Blizzard of 1993 was categorized as “Extreme.” The NCDC also
reports numerous storms producing one to over three feet of snow in the Green Mountains, but these
were not listed as they did not affect major population centers. The following is a summary of significant
events.
January 2 to 3, 1996 Heavy Snow: A major winter storm developed over the Gulf coast states on January
2nd and tracked northeast along the eastern seaboard during January 3rd. Heavy snow fell across
southern Vermont with the average snowfall ranging from ten to twelve inches.
December 7 to 8, 1996 Winter Storm: Heavy wet snow fell across southern Vermont resulting in 20,000
customers losing power. Eleven inches of snow were recorded in Dorset and fourteen inches in Peru.
Downed trees caused road closures and some were without power for several days.
March 31 to April 1, 1997 Winter Storm: A nor’easter formed bringing rain that changed to snow with
totals of twelve inches in Shaftsbury and thirteen inches in Peru. The wet snow caused power outages
and road closures.
December 29 to 30, 1997 Winter Storm: Wet snow and strong wins combined to down trees and power
lines. Route 7 was closed for several hours.
January 14 to 15, 1999 Winter Storm: Heavy snow fell across eastern New York and southern New
England with 11 inches reported in Dorset. The storm was accompanied by extremely cold conditions
with reported temperatures of -9 F.
March 5 to 6, 2001 Winter Storm: An extended period of moderate to heavy snow resulted in 26 inches
in Pownal and 27 inches in Peru. This was one of the largest snowfalls in southern Vermont since the
Blizzard of 93.
14 | P a g eNovember 17, 2002 Winter Storm: A mixture of snow, sleet and freezing rain, along with strong winds and trees still with leaves resulted in downed trees and powerlines from Arlington to the New York State Line. December 6 to 8, 2003 Winter Storm: The first major snowstorm of the winter resulted in 20.5 inches of snow reported in Pownal. January 15 to 16, 2007 Ice Storm: Freezing rain and sleet resulted in widespread downed trees and power lines with accompanying widespread power outages. February 14, 2007 Heavy Snow: Snowfall in excess of two feet across portions of Bennington County resulted in closed schools and businesses. Strong winds created near blizzard conditions during parts of the event. April 15 to 16, 2007 Winter Storm: Heavy, wet snow, ranging from 8-12 inches downed trees and power lines causing widespread outages. February 12 to 13, 2008 Winter Storm: Snow accumulated to 4-7 inches but was accompanied by freezing rain with ¼ to 1/3 of an inch of ice. December 11 to 12, 2008 Ice Storm: Rainfall in rates of ¼ to 1/3 of an inch/hour fell creating ice accumulations of ½ to ¾ of an inch. Snow and sleet mixed in in some areas. An estimated 15,000 customers lost power and businesses and schools were shut for several days. Very cold temperatures followed the storm. January 1 to 3, 2010 Heavy Snow: A strong storm brought 10 inches to over two feet of snow across Bennington and Windham counties. February 23 to 24, 2010 Heavy Snow: Heavy snow totaling one to two feet fell across southern Vermont with highest amounts in elevations above 1500 feet. February 26 to 27, 2010 Heavy Snow: Just after the storm described above, a second storm brought one to two feet in higher elevations with lesser amounts below 1000 feet in elevation. December 26 to 27, 2010 Winter Storm: Heavy snow falling at rates of 1-3 inches/hour resulted in one to two feet of snow. Winds were strong and gusted to 35-45 mph. January 12, 2011 Winter Storm: A strong storm resulted in 14 inches to three feet of snow falling at rates of three to six inches/hour. February 1 to 2, 2011 Winter Storm: Snowfall was generally 10-18 inches but ranged to 25 inches in some areas. February 25, 2011 Winter Storm: Snow fell at rates of 1 to 2 inches/hour with totals of 12 to 17 inches across southern Vermont. October 29 to 30 , 2011 Winter Storm: While not yet winter and with trees with much of their foliage still on, 5 to 14 inches fell across Bennington County. Trees and power lines came down due to the weight of the wet snow. February 13 to 14, 2014 Winter Storm: Snow fell at rates of up to three inches/hour. Over the two days of the storm, 8-21 inches fell in southern Vermont. At times, winds gusted to 40 mph as the storm left the area. November 26 to 27, 2014 Winter Storm: An early storm affected southern Vermont over the Thanksgiving period with 8-15 inches of total accumulation. 15 | P a g e
February 6 to 10, 2015 Heavy Snow: One to two feet of snow fell, with higher amounts in higher terrain.
        3.      Extent and Location
        The average annual snowfall in Bennington County is 64.4 inches, with December, January,
February and March as the primary months for snowfall. Extreme snowfall events for one, two and
three day events have ranged from 12 to over 20 inches (NOAA/National Climate Data Center 2014
Cooperative Weather Observer reports). The skill of road crews in Vermont means that only the heaviest
snowstorms (>12 inches) or ice storms affect the populations.
        Increasing temperatures that are predicted to occur will likely reduce total winter snowfall. If
precipitation falls as rain in the winter, river flows will be higher due to the lower evapotranspiration in
the winter. Freezing rain may become more frequent, with resulting impacts to the transportation and
power systems (Galford et al. 2014).
        4.      Probability, Impact and Vulnerability
        There is a 100% probability of a moderate or greater snowstorm affecting Bennington County,
including the Village of Manchester in any given year. These are large-scale events, though local impacts
may vary greatly. Roads and power lines are most vulnerable, with traffic accidents the most likely to
create injuries. Power outages could be short term or last seven or more days. Some roads may remain
impassable for long periods as well. The Village Road Foreman did not identify any specific areas where
snow removal was more problematic than others.
        C.      High Wind Events
        1.      Description
       High wind events can occur during tropical storms and hurricanes, winter storms and frontal
passages. Thunderstorms can produce damaging winds, hail and heavy rainfall, the latter potentially
producing flash floods. The NCDC recorded 69 thunderstorms with damaging winds in Bennington
County since 1996. Events categorized as “strong wind” tended to occur during the winter months.
        Tornadoes are formed in the same conditions as severe thunderstorms. Intense, but generally
localized damage can result from the intense winds. The primary period for tornado activity in New
England is mid-summer (Zielinski and Keim 2003). Tornadoes will generally follow valleys in the
northeast and dissipate in steep terrain. The NCDC recorded three tornadoes in Bennington County
since 1990.
        2.      Previous Occurrences
         Table 9 below summarizes the total number of significant wind events including thunderstorms,
strong winds, and tornadoes from 1996 to 2015. The 1998 tornado registered F2 on the Fujita damage
scale. The 2002 tornado in Bennington County registered F1 while the 2003 tornado was an F0 to F1
(NCDC 2015). The Fujita scale is based on windspeed and typical damage. An F0 tornado has winds of
less than 73 miles per hour and could damage chimneys, branches and down shallow rooted trees. An
F1 tornado has winds of 73-112 miles per hour and could damage roofs, push mobile homes off
foundations and blow cars off of roads. An F2 tornado has winds of 113-157 miles per hour and could
tear off roofs, destroy mobile homes and snap trees (http://www.spc.noaa.gov/faq/tornado/f-
scale.html).
         Wind speed data is not available for wind events within the Village of Manchester due to the
lack of weather stations. NCDC data (2015) rarely included estimates of wind speed. Generally, wind

16 | P a g e
speeds of greater than 55 miles per hour are considered damaging (NOAA 2006). Events that occurred in
or near the Village of Manchester are described below.
Table 9. Summary of wind events in Bennington County.
Source: NCDC 2015
High Strong Thunderstorm Funnel Totals
Year Wind Wind Winds Tornado Cloud
1996 5 5
1997 2 2 6 10
1998 1 8 1 10
1999 2 4 6
2000 1 1 2
2001 3 3
2002 3 1 4
2003 1 1 2
2004 0
2005 1 3 4
2006 3 3 6
2007 3 6 9
2008 3 5 8
2009 2 1 3
2010 5 3 1 9
2011 1 8 9
2012 3 3
2013 6 6
2014 3 3
2015
Totals 33 5 67 3 1 109
July 17 and July 18, 1997 Thunderstorm Winds: Severe thunderstorms downed trees in Manchester and
Dorset.
May 31, 1998 Thunderstorm Winds and Tornado: Strong thunderstorms generated an F2 tornado in
New York, which became an F1 after crossing into Vermont. The tornado followed Route 67 through
North Bennington and South Shaftsbury.
September 16 to 18, 1999 (DR-13079/16-21 1999): Remnants of Hurricane Floyd (see flooding and flash
flooding) brought winds gusting to over 60 mph and downed trees and power lines in southern
Vermont.
December 12, 2000 High Wind: Strong winds from the boundary of high and low pressure systems
downed trees and powerlines across Bennington County.
June 5, 2002 Thunderstorm Winds and Tornado: Thunderstorms originating in New York produced an F1
tornado that touched down in Woodford Hollow.
July 21, 2003 Tornado: A supercell originating in New York created a tornado there, created a second
tornado in Pownal and Bennington, downing trees and causing minor damage.
June 27, 2005 Thunderstorm Winds: A thunderstorm near Manchester Center blew down several trees.
17 | P a g eOctober 29, 2006 High Winds: Strong winds, some reaching 60 mph, blew from the evening of the 28th
through parts of the 29th.
March 2, 2007 High Winds: High winds were associated with snow and freezing rain. Winds measured at
Bennington Morse Airport reached 59 mph.
April 16, 2007 High Winds: Low pressure caused strong winds with 175 downed trees near Route 30 in
Dorset.
December 16, 2007 High Winds: A snowstorm brought 8-14 inches of snow along with strong winds that
combined to down trees and powerlines.
July 20, 2008 Thunderstorm Winds: A storm brought down trees and wires and blocked Route 7A
northeast of Manchester.
May 8, 2010 Thunderstorm Winds: Thunderstorms generated winds in excess of 40 mph downing trees
in Arlington and Manchester Center.
July 17, 2010 Funnel Cloud: A funnel cloud was reported on Route 279 in Bennington.
August 22, 2010 High Winds: Strong winds formed during passage of a cold front and downed trees and
wires in Arlington, Bennington, Shaftsbury and Sunderland.
September 30 to October 1, 2010 High Winds: a low pressure system and remnants of an off sure
Tropical Storm Nicole created winds gusting to over 55 mph with power outages reported.
June 9, 2011 Thunderstorm Wind: A pre-frontal trough formed a line of severe thunderstorms that
moved across eastern New York and southern Vermont.
August 28-19, 2001 (DR-4022 8/27-29 2011): Along with flooding described above, Hurricane Irene
brought 35-55 mph winds with gusts exceeding 60 mph resulting in downed trees and powerlines.
July 4, 2012 Thunderstorm Winds: Strong storms produced damaging winds in Manchester on
Independence Day.
October 29 to 30, 2012 High Winds: Superstorm Sandy brought strong winds of 40-60 mph, with a gust
of 58 mph recorded at the Bennington Morse Airport.
May 21, 2013 Thunderstorm Winds: A broken line of thunderstorms created downed wires and trees in
Dorset.
July 19, 2013 Thunderstorm Winds: Thunderstorm winds downed trees in Manchester and Sunderland.
July 3, 2014 Thunderstorm Winds: Thunderstorms again affected Bennington and Dorset.
c. Extent and Location
Damaging winds, including the previous occurrences described above, are those exceeding 55
miles per hour (National Oceanographic and Atmospheric Administration 2006 and undated). During a
December 2009 event, winds were measured at 59 mph at the Morse Airport in Bennington. Higher
winds were likely created during the two tornadoes. High wind events can strike anywhere. Where
storms are funneled up the valleys, damage can be significant, but most likely less than 10% of
structures would be affected. Again, power outages could last up to seven or more days. There are no
weather stations nor any records of wind data in the Village of Manchester.
d. Probability, Impact and Vulnerability
Wind events causing moderate or greater damage occur almost every other year (40-50%) in
Bennington County, and can range from localized events from thunderstorms to wide ranging events
18 | P a g efrom larger storms. The primary vulnerability would be power outages from downed trees and lines and
the potential expected probability would be 10-100% in the Village of Manchester.
D. Hail
The National Climate Data Center has 23 reports of hail storms in Bennington County between
1996 and 2015, all associated with thunderstorms. The following were within the Town of Manchester,
which surrounds the Village, or adjacent towns.
May 31, 1998 Thunderstorm Winds and Tornado and Hail: Strong thunderstorms generated an F2
tornado in New York, which became an F1 after crossing into Vermont. The tornado followed Route 67
through North Bennington and South Shaftsbury. Hail was reported in Shaftsbury.
July 18, 2000 Hail: Hail was reported in Bennington and Sunderland
July 4, 2001 Hail: Half-dollar sized hail fell in Sunderland.
June 6, 2005 Hail: Hail was reported in West Rupert, and one-inch hail was reported in Dorset.
August 1, 2005 Hail: One-inch sized hail was reported at Emerald Lake State Park in Dorset.
June 19, 2006 Hail: Penny-sized hail was reported in Sunderland.
May 10, 2007 Hail: Quarter sized hail was reported in Arlington.
June 21, 2007 Hail: Nickel sized hail was reported in Sunderland.
August 3, 2007 Hail: ping pong ball sized hail was reported in Shaftsbury.
June 10, 2008 Hail: Nickel sized hail was reported in Rupert.
August 6, 2008 Hail: Quarter sized hail was reported in Arlington.
June 1, 2011 Hail: Half dollar sized hail was reported in Arlington and golf ball sized hail reported in
Shaftsbury. Reports of hail were widespread.
June 24, 2013 Hail: Quarter sized hail was reported in Manchester.
Hail was also reported by a Cooperative Weather Observers on May 25, 1999, May 8, 2000, July 18,
2000, July 5, 2001, August 4, 2001, June 2, 2002, August 1, 2008 and August 15, 2009 in Sunderland and
on June 10, 2008 and May 8, 2010 in Peru.
c. Extent and Location
Hail can cover wide areas and has the potential for damaging crops, automobiles or glass within
structures, as well as causing injury. Generally, however, hail storms affect relatively small areas as they
form in thunderstorms, which are localized. Storms with the largest hail stones near the Village
Manchester were the two in 2005 during which one inch hail was reported in Dorset and Rupert.
d. Probability, Impact and Vulnerability
Hail storms are generally local, affecting subareas within the town, though a group of
thunderstorms can cause hail in multiple locations over a wide area. From past occurrences, one
thunderstorm per year generates hail that was recorded. So, the possibility of hail occurring in the
Village of Manchester could range from 10-100%. The potential vulnerability would be localized to
damage to structures or automobiles, though there could also be damage to vegetation. In general,
these impacts would be localized.
19 | P a g eE. Temperature Extremes
1. Descriptions
Temperature extremes entail periods of either excessive heat or extreme cold. Excessive heat is
generally defined as periods when the normal high temperature is exceeded by ten degrees. So, in the
summer, this would equal 88-89 degrees in Manchester (Table 10). Excessive heat is recorded at other
times, but does not have the health consequences of summer periods. In addition, the heat index, which
factors in the high relative humidity levels of summer, is also a factor.
Extreme cold is not well defined. For those involved in outdoor activities, extreme cold,
accompanied by wind, is when exposed skin would be subject to frostbite. However, for periods of
power outages that might accompany winter storms, extreme cold could be thought of as when
temperatures fall below freezing as that would not only affect health, but could result in pipes freezing
and the loss of water supplies.
Table 10. Sunderland normal temperatures and precipitation for 1981 to 2010.
Source: National Climate Data Center: http://www.ncdc.noaa.gov/land-based-station-data/climate-
normals/1981-2010-normals-data
Month High Temperature Low Temperature Mean Precipitation (in)
(0F) (0F) Temperature (0F)
January 28.5 9.5 19.0 3.44
February 33.7 11.2 22.5 2.82
March 40.9 19.5 30.2 3.55
April 54.3 31.0 42.7 3.47
May 65.8 41.3 53.5 4.33
June 75.3 49.6 62.5 4.66
July 78.5 54.5 66.5 4.55
August 77.1 53.0 65.0 4.40
September 69.6 44.2 56.9 3.83
October 57.3 34.4 45.8 4.28
November 45.9 27.9 36.9 3.98
December 34.4 17.2 25.8 3.95
Annual 55.1 (Avg.) 32.8 (Avg.) 43.9 47.26
The station normal report for the Cooperative Weather Observer in Sunderland indicates an
average of one day per year when the maximum temperature would equal 90 degrees, 55 days when
the maximum temperature would be less than 32 degrees and 172 days when the minimum
temperature would be less than 32 degrees.
2. Extent and Location
Extreme temperature is a widespread phenomenon. The populations affected could be small if
one is considering outdoor workers or the entire Village in a power outage. Temperatures exceeding
900F occur one or two days per year. The highest recorded temperature at the Sunderland Cooperative
Weather Observer station was 940F on June 1, 2011, which occurred again on July 22 and 23, 2011.The
coldest recorded temperatures by the Sunderland Cooperative Weather Observer were -240 F on
January 28, 2005 with -220 F recorded on both January 22nd and 29th in 2005.
Average temperatures in Vermont have risen 2.70F since 1941 with an increase of 1.50F since
1990. Winter temperatures have risen more than summer temperatures. If these trends continue, the
20 | P a g eYou can also read