Display Quality Assurance - The Report of AAPM Task Group 270
←
→
Page content transcription
If your browser does not render page correctly, please read the page content below

AAPM REPORT NO. 270

Display Quality Assurance

              The Report of AAPM
                Task Group 270
                       January 2019

DISCLAIMER: This publication is based on sources
and information believed to be reliable, but the
AAPM, the authors, and the editors disclaim any war-
ranty or liability based on or relating to the contents of
this publication.

The AAPM does not endorse any products, manufac-
turers, or suppliers. Nothing in this publication should
be interpreted as implying such endorsement.

      © 2019 by American Association of Physicists in Medicine
This page intentionally left blank

               i
Display Quality Assurance
                     The Report of AAPM Task Group 270

                  Nicholas B. Bevins, Ph.D.∗ and Michael J. Flynn, Ph.D.∗
                            Henry Ford Health System, Detroit, MI

                   Michael S. Silosky, M.S. and Rebecca M. Marsh, Ph.D.
                          University of Colorado Denver, Denver, CO

                                Alisa I. Walz-Flannigan, Ph.D.
                                 Mayo Clinic, Rochester, MN

                                     Aldo Badano, Ph.D.
                   U.S. Food and Drug Administration, Silver Spring, MD

∗
    Task Group Co-chair

                                             ii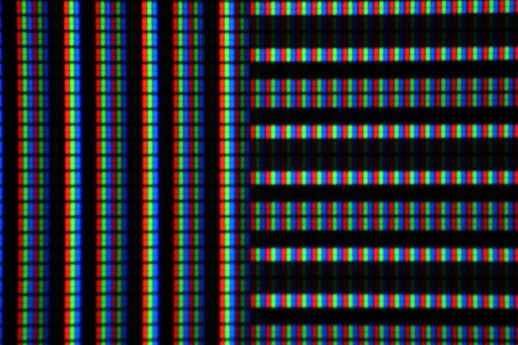
DISCLAIMER: This publication is based on sources and information believed to be reliable,
    but the AAPM, the authors, and the publisher disclaim any warranty or liability
               based on or relating to the contents of this publication.

 The AAPM does not endorse any products, manufacturers, or suppliers. Nothing in this
         publication should be interpreted as implying such endorsement.

                                ISBN: 978-1-936366-66-8
                                   ISSN: 0271-7344

                © 2019 by American Association of Physicists in Medicine

                                   All rights reserved

                                      Published by

                     American Association of Physicists in Medicine
                                 1631 Prince Street
                                Alexandria, VA 22314

                                          iii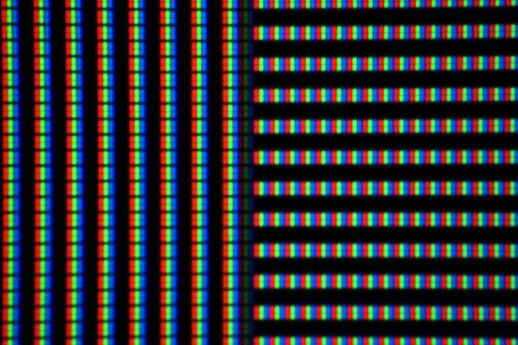
Contents

1 Introduction                                                                                                      1
  1    Justification and Purpose . . . . . . . . . . . . . . . . . . . . . . . . . . . . .                          1
  2    Report Structure . . . . . . . . . . . . . . . . . . . . . . . . . . . . . . . . .                           1

2 Performance Characteristics and Quality Control                                                                    2
  1   Display Categories . . . . . . . . . . . . . . . . . . . .    .   .   .   .   .   .   .   .   .   .   .   .    2
      1      Diagnostic Displays . . . . . . . . . . . . . . . .    .   .   .   .   .   .   .   .   .   .   .   .    2
      2      Modality Displays . . . . . . . . . . . . . . . . .    .   .   .   .   .   .   .   .   .   .   .   .    3
      3      Clinical Specialist Displays . . . . . . . . . . . .   .   .   .   .   .   .   .   .   .   .   .   .    3
      4      Electronic Health Record Displays . . . . . . . .      .   .   .   .   .   .   .   .   .   .   .   .    3
      5      Note on Display Categories . . . . . . . . . . .       .   .   .   .   .   .   .   .   .   .   .   .    3
      6      Note on OLED Displays . . . . . . . . . . . . .        .   .   .   .   .   .   .   .   .   .   .   .    4
  2   Display Quality Assurance Tools and Techniques . . . .        .   .   .   .   .   .   .   .   .   .   .   .    4
      1      Measurement Instrumentation . . . . . . . . . .        .   .   .   .   .   .   .   .   .   .   .   .    4
      2      Calibration and Intercomparison . . . . . . . . .      .   .   .   .   .   .   .   .   .   .   .   .    6
      3      Display and Device Stabilization . . . . . . . . .     .   .   .   .   .   .   .   .   .   .   .   .    6
      4      Environmental Conditions . . . . . . . . . . . .       .   .   .   .   .   .   .   .   .   .   .   .    6
      5      Workstation Configuration and Documentation            .   .   .   .   .   .   .   .   .   .   .   .    7
      6      Use of Test Patterns . . . . . . . . . . . . . . .     .   .   .   .   .   .   .   .   .   .   .   .    7
  3   Display Luminance . . . . . . . . . . . . . . . . . . . .     .   .   .   .   .   .   .   .   .   .   .   .    7
      1      Ambient Lighting . . . . . . . . . . . . . . . . .     .   .   .   .   .   .   .   .   .   .   .   .    9
             1         Rationale . . . . . . . . . . . . . . . .    .   .   .   .   .   .   .   .   .   .   .   .    9
             2         Test Equipment . . . . . . . . . . . . .     .   .   .   .   .   .   .   .   .   .   .   .   11
             3         Procedure . . . . . . . . . . . . . . . .    .   .   .   .   .   .   .   .   .   .   .   .   11
             4         Assessment . . . . . . . . . . . . . . .     .   .   .   .   .   .   .   .   .   .   .   .   12
             5         Suggested Limits . . . . . . . . . . . .     .   .   .   .   .   .   .   .   .   .   .   .   13
             6         Qualitative Assessment . . . . . . . . .     .   .   .   .   .   .   .   .   .   .   .   .   14
      2      Display Luminance and Grayscale Function . .           .   .   .   .   .   .   .   .   .   .   .   .   14
             1         Rationale . . . . . . . . . . . . . . . .    .   .   .   .   .   .   .   .   .   .   .   .   14
             2         Test Equipment . . . . . . . . . . . . .     .   .   .   .   .   .   .   .   .   .   .   .   18
             3         Assessment . . . . . . . . . . . . . . .     .   .   .   .   .   .   .   .   .   .   .   .   22
             4         Suggested Limits . . . . . . . . . . . .     .   .   .   .   .   .   .   .   .   .   .   .   27
             5         Qualitative Assessment . . . . . . . . .     .   .   .   .   .   .   .   .   .   .   .   .   28
  4   Display Color . . . . . . . . . . . . . . . . . . . . . . .   .   .   .   .   .   .   .   .   .   .   .   .   31
      1      Rationale . . . . . . . . . . . . . . . . . . . . .    .   .   .   .   .   .   .   .   .   .   .   .   31
      2      Test Equipment . . . . . . . . . . . . . . . . . .     .   .   .   .   .   .   .   .   .   .   .   .   31
      3      Procedure . . . . . . . . . . . . . . . . . . . . .    .   .   .   .   .   .   .   .   .   .   .   .   32
      4      Assessment . . . . . . . . . . . . . . . . . . . .     .   .   .   .   .   .   .   .   .   .   .   .   32
      5      Suggested Limits . . . . . . . . . . . . . . . . .     .   .   .   .   .   .   .   .   .   .   .   .   34
  5   Display Luminance Uniformity . . . . . . . . . . . . . .      .   .   .   .   .   .   .   .   .   .   .   .   35
      1      Rationale . . . . . . . . . . . . . . . . . . . . .    .   .   .   .   .   .   .   .   .   .   .   .   35
      2      Quantitative Evaluation . . . . . . . . . . . . .      .   .   .   .   .   .   .   .   .   .   .   .   37
      3      Qualitative Evaluation . . . . . . . . . . . . . .     .   .   .   .   .   .   .   .   .   .   .   .   38

                                             iv
6 Display Noise . . . . . . . . . . . . . . . . . . . . . . . . . . . . . . . . . . . 40
1 Rationale . . . . . . . . . . . . . . . . . . . . . . . . . . . . . . . . . 40
2 Test Patterns . . . . . . . . . . . . . . . . . . . . . . . . . . . . . . . 40
3 Procedure . . . . . . . . . . . . . . . . . . . . . . . . . . . . . . . . . 40
4 Assessment . . . . . . . . . . . . . . . . . . . . . . . . . . . . . . . . 41
7 Display Temporal Performance . . . . . . . . . . . . . . . . . . . . . . . . . 41
1 Rationale . . . . . . . . . . . . . . . . . . . . . . . . . . . . . . . . . 41
2 Procedure . . . . . . . . . . . . . . . . . . . . . . . . . . . . . . . . . 42
3 Assessment . . . . . . . . . . . . . . . . . . . . . . . . . . . . . . . . 43
4 Suggested Limits . . . . . . . . . . . . . . . . . . . . . . . . . . . . . 44
8 Display Spatial Resolution . . . . . . . . . . . . . . . . . . . . . . . . . . . . 44
1 Rationale . . . . . . . . . . . . . . . . . . . . . . . . . . . . . . . . . 44
2 Procedure and Assessment . . . . . . . . . . . . . . . . . . . . . . . . 44
3 Note on Pixel Pitch . . . . . . . . . . . . . . . . . . . . . . . . . . . . 45
3 Summary of Tests and Recommendations 47
4 Test Patterns 51
1 Existing Patterns . . . . . . . . . . . . . . . . . . . . . . . . . . . . . . . . . 51
1 TG18-QC (qualitative quality control) . . . . . . . . . . . . . . . . . 51
2 TG18-LN (luminance response) . . . . . . . . . . . . . . . . . . . . . 51
3 TG18-UN (uniformity) . . . . . . . . . . . . . . . . . . . . . . . . . . 52
4 TG18-AFC (display noise) . . . . . . . . . . . . . . . . . . . . . . . . 52
5 TG18-AD (low-luminance, low-contrast) . . . . . . . . . . . . . . . . 52
6 SMPTE . . . . . . . . . . . . . . . . . . . . . . . . . . . . . . . . . . 52
2 New Test Patterns . . . . . . . . . . . . . . . . . . . . . . . . . . . . . . . . 53
1 TG270-sQC (simple QC) . . . . . . . . . . . . . . . . . . . . . . . . . 53
2 TG270-pQC (physics QC) . . . . . . . . . . . . . . . . . . . . . . . . 53
3 TG270-ULN (combined uniformity and luminance response) . . . . . 56
4 TG270-TR (temporal resolution) . . . . . . . . . . . . . . . . . . . . 58
5 Conclusions 60
References 61
A Glossary 64
B ImageJ Macros for TG270 Test Patterns 67
1 TG270-sQC Macro . . . . . . . . . . . . . . . . . . . . . . . . . . . . . . . . 67
2 TG270-pQC Macro . . . . . . . . . . . . . . . . . . . . . . . . . . . . . . . . 70
3 TG270-ULN Macro . . . . . . . . . . . . . . . . . . . . . . . . . . . . . . . . 74
4 TG270-TR Macro . . . . . . . . . . . . . . . . . . . . . . . . . . . . . . . . . 75
vList of Figures
1 Effects of Ambient Luminance on Perceived Luminance Response . . . . . . 15
2 Contrast Threshold versus Luminance for Human Observer . . . . . . . . . . 17
3 Example of Calibration Error and Failure of 18-point Conformance Measure-
ment . . . . . . . . . . . . . . . . . . . . . . . . . . . . . . . . . . . . . . . . 19
4 Examples of display issues visible on grayscale gradient . . . . . . . . . . . . 20
5 Effect of Lamb on Accuracy of ∆JND/GL Evaluation . . . . . . . . . . . . . 25
6 TG18-OIQ and TG18-QC Regions of Interest for Qualitative Luminance As-
sessment . . . . . . . . . . . . . . . . . . . . . . . . . . . . . . . . . . . . . . 29
7 TG270-sQC Regions of Interest for Qualitative Luminance Assessment . . . 30
8 Grayscale Color Tracking Plots . . . . . . . . . . . . . . . . . . . . . . . . . 33
9 1976 CIE UCS chromaticity Diagram Focused on D65 Illuminant . . . . . . 36
10 Example Photographs of Mura Non-uniformity . . . . . . . . . . . . . . . . . 39
11 Examples of TR270-TR Pattern Photographs . . . . . . . . . . . . . . . . . 43
12 Photograph of Display Pixels Under Magnification . . . . . . . . . . . . . . . 45
13 TG270-sQC Quality Control Test Pattern . . . . . . . . . . . . . . . . . . . 55
14 TG270-pQC Quality Control Test Pattern . . . . . . . . . . . . . . . . . . . 56
15 TG270-ULN Uniformity and Luminance Test Pattern . . . . . . . . . . . . . 58
16 TG270-TR Temporal Resolution Test Pattern . . . . . . . . . . . . . . . . . 59
viList of Tables
I Example Display Configuration from EDID . . . . . . . . . . . . . . . . . . . 8
II Comparison of Assumptions for Estimated Reflection Coefficients . . . . . . 12
III DICOM GSDF Conversion Coefficients . . . . . . . . . . . . . . . . . . . . . 23
IV Sample ∆JND/GL Analysis of 18-point Luminance Measurement . . . . . . 24
V Sample dL/L per JND Analysis of 18-point Luminance Measurement . . . . 26
VI Recommended Display Luminance Levels . . . . . . . . . . . . . . . . . . . . 27
VII Recommended Display Luminance Response Accuracy . . . . . . . . . . . . 28
VIII Recommended Color Distance from a Standard Illuminant . . . . . . . . . . 34
IX Recommended Color Distance Limits between Displays . . . . . . . . . . . . 34
X Suggested Display QA Testing Criteria . . . . . . . . . . . . . . . . . . . . . 48
XI Suggested Display QA Testing Criteria . . . . . . . . . . . . . . . . . . . . . 49
XII Suggested Display QA Testing Frequencies . . . . . . . . . . . . . . . . . . . 50
XIII TG270-sQC Pattern Feature Descriptions . . . . . . . . . . . . . . . . . . . . 54
XIV TG270-pQC Pattern Feature Descriptions . . . . . . . . . . . . . . . . . . . 57
vii1 Introduction
1.1 Justification and Purpose
In 2005, AAPM published Online Report No. 03, “Assessment of Display Performance for
Medical Imaging Systems,” commonly referred to as the TG18 report. The stated intent of
this report was “to provide standard guidelines to practicing medical physicists, engineers,
researchers, and radiologists for the performance evaluation of electronic display devices
intended for medical use.” [TG18 2005, p. vii] While the report specifically states that it
pays significant attention to both cathode ray tube (CRT) displays and liquid crystal displays
(LCDs), CRTs were the dominant display technology at the time. As a result, the report
focuses heavily on CRT displays, with many of the described quality assurance (QA) tests
and performance criteria not directly applicable to LCDs. Since the report’s publication,
LCDs have supplanted CRT displays as the primary image display technology in medicine,
and with the introduction of organic light-emitting diode (OLED) displays, it is appropriate
to revisit the guidelines for the performance and QA evaluation of devices. This report is
an update to TG18 that is specifically directed at LCD and OLED displays.
The purpose of this task group report is to provide recommendations for the assessment of
display quality for flat-panel displays used in medicine. This includes both LCDs and OLED
displays used in the acquisition and review of medical images. The information provided in
this report is intended to help design a QA program for flat-panel displays, as well as aid in
purchasing decisions.
1.2 Report Structure
This report is broken into several sections to facilitate its use. The following section, entitled
Performance Characteristics and Quality Control, provides an in-depth discussion of display
classifications, performance characteristics, testing methods, and evaluation criteria. Each
characteristic has a series of subsections addressing the rationale for testing, required equip-
ment, test procedures, assessment of results, and suggested performance limits. It should be
noted that several tests recommended in the TG18 report have been excluded from this doc-
ument on the grounds that they either do not apply to flat-panel displays (LCD or OLED),
or have been determined to be unnecessary for routine QA testing. Next, Summary of Tests
and Recommendations provides a summary of tests and outlines recommendations for a
routine QA program. After this summary, the Test Patterns section provides a more de-
tailed description of the test patterns discussed throughout the document. Finally, sections
providing a brief conclusion and a glossary are presented. The appendix of the document
provides ImageJ [ImageJ 2016] macros for new test patterns introduced as part of this work.
12 Performance Characteristics and
Quality Control
2.1 Display Categories
The TG18 report defined two display classes: primary displays were those used for inter-
pretation of medical images, while secondary displays included all other displays used in
medicine. This report further categorizes secondary displays based on their use, with vary-
ing requirements for performance and evaluation. In this report, all displays used in the
review of medical images are separated into the following categories:
1. Diagnostic displays
2. Modality displays
3. Clinical specialist displays
4. Electronic health record (EHR) displays
The following subsections describe each of these categories in further detail. The ultimate
goal is for all displays to maintain consistent presentation of images. This is accomplished
by setting similar performance targets, while allowing different testing tolerances, testing
mechanisms, and testing frequencies sufficient to ensure adequate performance for the in-
tended clinical use. This report does not make special considerations for displays used in
handheld devices. Many of the tests and categories described here can be directly applied
to handheld viewing, but it is important to note that there are limitations with handheld
viewing that are not discussed here. The reader should refer to the report from AAPM
TG260 for a discussion of handheld image viewing considerations.
2.1.1 Diagnostic Displays
Referred to as primary displays in the TG18 report and other documents, diagnostic displays
refer to displays used for the primary interpretation of medical images. While they are
typically used in radiology, they may also be present in other departments and used by
personnel in other medical specialties. Given the nature of the task for which they are
used, diagnostic displays have the most stringent performance requirements. These displays
often have substantially higher luminance, smaller pixel pitch, greater bit depth, improved
noise characteristics, and built-in controls for long term luminance stability and self-testing.
As a result of this increase in performance and capability, diagnostic displays are often
substantially more expensive than standard business displays.
Dedicated diagnostic displays are typically used on workstations alongside non-diagnostic
navigation displays. These navigation displays are used to access worklists, medical records,
dictation software, e-mail, web browsers, etc. While it is usually possible to show medical
images on these navigation displays, such practice should be avoided. If the navigation
display must be used for medical image review, e.g., reviewing a color Doppler ultrasound
study on a workstation with grayscale diagnostic displays, the display should meet the
performance criteria for diagnostic displays.
22.1.2 Modality Displays
Modality displays refer to any display used during the acquisition and generation of medical
images. These displays may or may not be located at the acquisition console for a given
modality. Also included are displays used either partially or solely for image reconstruction
and reprocessing, advanced image post-processing, drawing regions of interest, making screen
captures, etc. Because the performance of these devices directly impacts image appearance
on other displays, it is imperative that they meet minimum performance standards. It
should be noted that displays used during image acquisition solely for the navigation of the
modality interface, i.e., displays that do not display medical images, do not fall under this
definition and are not addressed in this report.
Modality displays with direct feedback to the operator, e.g., displays for ultrasound or
fluoroscopy, may be used for image acquisition, procedure guidance, or patient diagnosis.
In these cases, the display performance criteria for diagnostic displays should be considered
when evaluating the display. If diagnostic-quality displays are not available for the modality,
the viewer should understand the limitations when making a medical diagnosis or patient
care decision.
2.1.3 Clinical Specialist Displays
In certain clinical specialties, such as an emergency department, physicians often review
patient images for the purpose of making healthcare management decisions before the inter-
preting radiologist provides a finalized report. Clinical specialist displays refer to displays
used in this manner. Because images viewed on these displays may directly impact decisions,
these displays should ideally perform similarly to diagnostic displays. However, given that
these displays are generally of lower quality than diagnostic displays, the exact performance
criteria and tolerances should be evaluated based on a display’s specific usage and need for
full diagnostic capabilities.
2.1.4 Electronic Health Record Displays
Images acquired during the course of a patient’s care will often be viewed multiple times
following the primary interpretation by a radiologist. This may occur in an exam room for
patient education, at a separate workstation used by a referring physician reviewing images
to better understand the diagnosis, or by a surgeon as part of pre-surgical planning. In
these examples, the displays are categorized as Electronic Health Record (EHR) displays. A
facility may find that standard business displays without specific calibration or luminance
controls are sufficient for this need. However, when poor display performance creates barriers
to efficiency or quality care, the QA guidelines in this report should be followed for luminance
performance, grayscale calibration, uniformity, and ambient lighting. While optimizing all
of these characteristics is needed for consistent image presentation, addressing any subset of
these issues will improve image review.
2.1.5 Note on Display Categories
Manufacturers often categorize displays as medical-grade diagnostic displays, professional
graphic displays, or standard business displays. The display category classifications in this
report closely match the category names used by various display manufacturers. It is im-
portant to note that the decision on what type of display to use for a given image review
3task should be based on both the clinical needs and the level of support. Displays that are
marketed in one category may be sufficient for use in another category, especially if there is
sufficient clinical support to set up and maintain the display. Any decision on the type of
display should be made in consultation between the clinical user (e.g., physician), qualified
medical physicist, and other relevant personnel.
2.1.6 Note on OLED Displays
At the time of writing this report, LCD flat-panels are the dominate technology across all
display categories. As OLED technology continues to improve, it may someday supplant
LCDs as the preferred display type. However, OLED displays currently suffer from certain
limitations that limit their widespread implementation in medical image viewing. These
limitations include differential aging of the color emitting materials, burn-in image residuals,
luminance degradation with time, and luminance loading [IDMS 2012, p. 71]. The quality
assurance methods recommended in this report may not fully characterize image quality
in all these instances, and should be adapted as needed to accommodate future display
technology and features.
2.2 Display Quality Assurance Tools and Techniques
As with other QA programs, certain tools and techniques are necessary to accurately eval-
uate and document the performance of medical displays. The following sections provide an
introduction to these tools and techniques, and discuss usage, calibration, and other factors
that may affect the accuracy and reliability of QA measurements.
2.2.1 Measurement Instrumentation
Quantitative evaluation of display performance requires the use of one or more measurement
instruments, including photometers and/or colorimeters. The word “photometer” is used
here as a general term for any device used to measure light with standard photometric units
for luminance and illuminance. Luminance refers to the intensity of light being emitted from
a surface and is measured in cd/m2 . Illuminance refers to the intensity of light incident on a
surface and is measured in lux. Measurements of display luminance are used to evaluate the
displays performance, while measurements of illuminance are used to characterize the envi-
ronment in which the display is being used. Typically, illuminance meters are placed on the
surface of the display with normal room-lighting conditions. The word “colorimeter” is used
here as a term for photometers that additionally estimate color in standard CIE coordinates
[CIE15:2004] using a small array of light sensors having different color filters. In addition
to colorimeters, spectroradiometers may be used to measure the spectral characteristics of
light emitted by a display. These devices are capable of reporting the light measurements
as a function of wavelength. While expensive, they are useful for making highly accurate
measurements of color coordinates and luminance [CIE15:2004; IDMS 2012]. Photometers
and colorimeters are appropriate for use in clinical medical physics, although users should
be aware of the potential error in the measurements compared with a spectroradiometer.
Quantitative evaluation of luminance is an essential part of display QA. Evaluating dis-
play luminance requires a basic knowledge of the types of luminance meters available and
how they are used. Generally speaking, the meters used for display QA may be broken into
two types: contact and telescopic.
4Contact luminance meters are positioned with the sensitive portion or entry window of
the detector in direct contact with the display. It should be noted that the direct contact
between the meter and display excludes ambient light that would otherwise be reflected from
the display toward the user. Therefore, the effects of ambient lighting must be specifically
accounted for when using contact photometers to evaluate display performance. When op-
erating these devices it is important to recognize that the detector has a finite measurement
area, and that the measurement boundaries are not often visible to the user. Therefore, test
patterns should be displayed such that the area being measured is uniform and falls well
outside the sensitive area of the device. The accuracy of a measurement may be substan-
tially affected if the sensitive portion of the detector falls outside of the intended portion of
the test pattern.
In contrast, telescopic photometers are used away from the surface of the display (typi-
cally near where the eye of the user would be). Many telescopic photometers have eyepieces
to allow the user to view the area to be measured. Because these measurements are made at
a distance, ambient light reflected from the display will be directly included in the measure-
ment. Unlike contact meters, the viewing direction and position of telescopic photometers
are variable. If the user wants to characterize the viewing angle dependencies of a display, a
telescopic photometer must be used. When either comparing displays or tracking the perfor-
mance of a display over time, a telescopic photometer must be set up the same way for each
measurement. A tripod can be used to reduce movement of the meter, and may help ensure
robustness in telescopic photometer measurements. It should be noted that this concern is
minimized with contact luminance meters since their positioning is easily reproducible.
An appropriate colorimeter is required for quantitative evaluation of display color. These
devices measure the color of the display and may display results using several different color
space coordinate systems. As with luminance meters, there are both contact and telescopic
colorimeters. These devices are operated similarly, and are subject to similar limitations
as their photometer counterparts. Colorimetery capabilities are often incorporated into
photometers, resulting in a single device capable of both functions. Colorimeters can vary
greatly in both cost and accuracy, and the reader should refer to the AAPM TG196 report
on gray tracking in medical color displays when considering what type of colorimeter to use
[TG196 2016]. As with all measurement devices, photometers and colorimeters should be
used in accordance with the manufacturer’s recommendations and guidelines.
While either contact or telescopic photometers and colorimeters may be used to evaluate
luminance and color for all classes of displays, modern diagnostic displays are often equipped
with built-in photometers and colorimeters for both calibration and verification of display
output. Depending on the display design, these devices can either monitor the output of
the backlight directly, or measure luminance emitted from the front panel. The output from
built-in meters is typically accessible only through vendor-specific software. These devices
can be useful for monitoring display performance for a large number of displays, especially
when the output can be viewed remotely. It should be noted that neither design of built-in
meter typically includes ambient light in its readout. To account for this, some vendors
assume a fixed value for ambient luminance during calibration. As with all tools used for
QA, the proper functioning of built-in photometers and colorimeters should be verified before
use.
In addition to built-in photometers used to measure display luminance, some manufac-
turers install illuminance meters designed to measure ambient light. These measurements
are often used in conjunction with energy-saving features that reduce the maximum lumi-
5nance when the room is dark. Since maintaining a consistent luminance ratio and grayscale
display function is essential to reproducible image display, this report recommends disabling
energy-saving features that adjust the luminance characteristics.
2.2.2 Calibration and Intercomparison
Similar to dosimetry equipment and other devices used in the field of medical physics,
calibration of instrumentation used for display QA helps ensure that measurements remain
accurate over time. Meters that can be calibrated over the range of luminances typically
measured from a medical display (0.1 to 1000 cd/m2 ) are ideal. There are a number of
meters available on the market, with a substantial range in prices. Some of these devices
will come from the manufacturer with calibration documentation and an expectation of
annual calibration, while others are not designed to be calibrated and cannot be corrected for
changes over time. While calibrated devices should be the first choice, especially for facilities
with only a single luminance meter, devices that cannot be calibrated may be appropriate
if they are periodically compared against a recently calibrated meter. All meters that can
be calibrated should follow the manufacturer’s guidelines for calibration.
It has been shown that built-in photometer accuracy tends to degrade as a display ap-
proaches its backlight warranty [Silosky and Marsh 2013]. For front-panel sensors, this may
be due to changes in display uniformity or white point, while for backlight sensors it may
be due to changes to the optical properties of the display. An intercomparison with a cali-
brated luminance meter may be used to verify accuracy. This report suggests performing an
intercomparison during acceptance of a new display, and again every 10,000 backlight hours.
Different display models (with different built-in photometers) may age in different ways, so
the person responsible for display QA should use their professional judgment regarding the
frequency of intercomparison for these devices.
2.2.3 Display and Device Stabilization
When performing quantitative measurements on medical displays it is important to ensure
that both the display itself and the measurement device have reached a steady state. Dis-
plays and measurement devices should be turned on for at least several minutes before taking
measurements, and test patterns should be displayed long enough for the display output to
stabilize. Further discussion of display luminance stability is provided in the Display Tempo-
ral Performance section. To ensure thermal stability, contact photometers and colorimeters
should be put in place during the warm-up period. To verify stability, several serial record-
ings should be made to ensure that there is no trending in luminance or color measurements.
If the measurement device has a constantly updating readout, the user should ensure that
a steady state has been reached prior to recording the measurement.
2.2.4 Environmental Conditions
While measurements made using contact devices (both photometers and colorimeters) are
relatively independent of environmental lighting conditions, measurements made using tele-
scopic devices include both emitted and reflected light. When using telescopic devices, it
is important that measurements are made using normal room-lighting conditions. The il-
luminance of the display surface can be affected by several factors including the display’s
position and orientation relative to ambient light sources. These sources may include lamps,
6other displays, and even the clothing of the operator (white coats or shirts reflect ambient
light toward the display, and strong colors may affect white point).
In addition to quantitative measurements, visual evaluation of test patterns can be
strongly influenced by environmental conditions. As with measurement devices, the re-
sults of visual evaluations can be affected by ambient light reflected toward the user, display
orientation and angle, and the clothing of the individual using the display. This is further
complicated by the fact that the visual system of the viewer will adapt, not only to light
emitted and reflected from the display surface, but also from other sources. Consequently,
the effects of ambient lighting may have a greater effect on qualitative visual evaluations
than for quantitative measurements.
2.2.5 Workstation Configuration and Documentation
Display acceptance and QA tests are often done for a workstation that may have multiple
displays. The make, model, and serial number of all displays on the workstation, along with
all display-related graphic configuration settings, should be documented and compared to
information obtained at installation. It is not uncommon to find that a display has been
moved from one workstation to another, or that the graphic configurations have changed.
It is particularly important to verify that the row and column settings of the graphic driver
match the native pixel rows and column of the display.
Workstation documentation can be easily done using an application that automatically
retrieves the needed information. Modern displays provide internal storage for such specifi-
cation information. The VESA Extended Display Identification Data (EDID) data structure
standardizes the format and can be read by operating system drivers. The VESA DisplayID
standard was recently released and is designed to eventually replace the EDID standard. Ta-
ble I illustrates the table produced by the EDIDprofile utility application included with the
open-source pacsDisplay package (pacsdisplay.org). The utility documents the workstation
profile and display specifications for each active display on a Microsoft Windows worksta-
tion. Display manufacturers provide similar applications along with database services that
are useful for tracking the performance of individual displays.
2.2.6 Use of Test Patterns
Test patterns are a vital part of display quality assurance, and the tests and procedures
in this document rely on the proper display of appropriate test patterns. Various test
patterns are mentioned throughout the remaining sections, and the reader is referred to
Test Patterns in section 4 for a complete description of each pattern. It should be noted
that when displaying any test pattern, the appropriate dynamic range of the display should
be used. Typically, a display should be set to its full range (8-bit display set to window
width 256, window level 128). While many vendors include test patterns with appropriate
presets, some may require user adjustment.
2.3 Display Luminance
Display luminance refers to the intensity of visible light emitted from a unit area of the
surface of the display. The term “luminance response function” refers to the changes in a
display’s luminance as image gray levels vary. Because an observer’s perception of image
7TABLE I. Example Display Configuration from EDID
System Profile
Hostname: hfh-ct-2-r6gy1
Date: 20150903
Manf: Hewlett-Packard
Model: HPZ640Workstation
CPU_0: Intel(R)Xeon(R)CPUE5-2667v3@3.20GHz
CPU_1: Intel(R)Xeon(R)CPUE5-2667v3@3.20GHz
CPU_2: Intel(R)Xeon(R)CPUE5-2667v3@3.20GHz
CPU_3: Intel(R)Xeon(R)CPUE5-2667v3@3.20GHz
Display Profile
getEdid request number 1 2 5 6
Adapter display ID DISPLAY1 DISPLAY2 DISPLAY5 DISPLAY6
Adapter string K2200 K2200 K2200 K2200
Display descriptor MD211C3 MD211C3 EA234WMi EA234WMi
Extended S/N 56003151TW 55003029TW 56313201TA 56313204TA
Week of manufacture 23 19 23 23
Year of manufacture 2015 2015 2015 2015
Max. horiz. image size (mm) 325 325 509 509
Max. vert. image size (mm) 433 433 286 286
Horiz. array size: Native 1536 1536 1920 1920
Horiz. array size: Current 1536 1536 1920 1920
Vert. array size: Native 2048 2048 1080 1080
Vert. array size: Current 2048 2048 1080 1080
Est. horiz. pixel size (um) 211.6 211.6 265.1 265.1
Est. vert. pixel size (um) 211.4 211.4 264.8 264.8
brightness and contrast of an image is determined in part by the luminance response function,
quality control of both the display luminance and the luminance response function are an
essential component of display quality assurance. Several characteristics are used when eval-
uating display luminance including ambient luminance (Lamb ), minimum luminance (Lmin ),
maximum luminance (Lmax ), luminance ratio, and luminance response function. The ACR–
AAPM–SIIM Technical Standard for Electronic Practice of Medical Imaging [ACR-AAPM-
SIIM 2017] has provided basic recommendations regarding these characteristics for different
display classifications.
Historically, the maximum luminance, Lmax , has been given the most attention as a
display quality control metric. However, optimal display performance is best achieved by
first considering the ambient lighting conditions. Once the ambient lighting conditions
8are characterized, Lmin and Lmax may be set and evaluated before being used to determine
appropriate luminance response at various image gray levels. The following section describes
the rationale for this process, along with suggested methods for measurement and evaluation.
2.3.1 Ambient Lighting
2.3.1.1 Rationale
This report uses the term “ambient light” to refer to sources of visible light, other than
the display itself, that reflect off the surface of the display. The reflected ambient light is
superimposed on the user’s view of the intended image, reducing the image contrast and
interfering with the visibility of the displayed image. In addition, glossy displays can cause a
specular (mirror-like) reflection of a light source to create a distinct image of the light source
on the display, which may be distracting to the user. Both of these effects from ambient
light impact how the displayed image is perceived.
The ambient luminance Lamb reflected from the display will depend on the characteristics
of the illumination produced by the ambient light sources. The ambient luminance can be
measured directly, but will be dependent on the illumination levels. As an alternative, one
can determine how the display will reflect different sources of illuminance, and use that
information to calculate the ambient luminance for any illumination level.
Light sources can be generally categorized as producing either hemispherical diffuse illu-
mination or directed illumination. Diffuse light is typically present due to the background
light from the walls, ceiling, and floor. Directed light comes from discrete light sources (e.g.,
lamps, windows, other displays). Indoor light will generally be a combination of multiple di-
rected light sources and the hemispherical diffuse background light. Light from these sources
scatter off the surface of the display at various angles. Light reflected from the surface of
the display may be broadly characterized as either specular reflection or diffuse reflection.
It should be noted that different display panels may have very different reflection prop-
erties, and it is helpful to understand these factors for both purchase evaluation and in
establishing settings for use. Additionally, users should be aware that additional protective
panels modify the reflective properties of the display and may create internal reflections that
degrade displayed contrast resolution [Ekpo and McEntee 2016].
Specular Reflection
Specular reflection is defined as light reflected from a surface at a definite angle. Smoother
surfaces generally produce more specular reflection, giving them a reflective property like
a mirror. Specular reflectance results in light emitters or reflectors forming virtual images
on a surface. For example, when a user is sitting with a lamp to his/her back and viewing
a computer display, the image of the lamp may be superimposed on the displayed image.
The clarity of the reflected lamp will depend on the amount of specular reflectance of the
display. Specular reflections are typically non-uniform and there is no display calibration
to correct them. The management strategy for specular reflections is to minimize them as
much as possible by
• Avoiding the use of glossy panels with high specular reflectance, especially for use in
environments with high levels of ambient light;
• Using indirect lighting, or positioning displays to face away from any direct lighting
sources (e.g., overhead lights and windows); and
9• Minimizing reflective objects in front of the display (e.g., white lab coats) which create
non-uniform reflected light sources.
Diffuse Reflection
Unlike specular reflection, where the image of the light emitter/reflector may be directly
visible on the display, diffuse reflection causes incident light to be scattered in many direc-
tions. This creates a more uniform increase in reflected light, as opposed to a clear image
of the light source. The net result is that a portion of the illuminance incident on the dis-
play is reflected toward the viewer as an increase in ambient luminance, Lamb . It should
be noted that even with proper indirect lighting, there will still be some diffuse reflection
from the display. Because the viewer’s visual system perceives both Lamb and the display
luminance, perceived image contrast is degraded if Lamb is not considered when establishing
an appropriate luminance response function.
Ambient Luminance
Under all viewing conditions, the total luminance L0 observed by a viewer can be expressed
as
L0 = L + Lamb (2.1)
where L is the luminance emitted by the display, and Lamb includes the luminance from
reflected room light which can have multiple components:
Lamb = Ldiff + Ldir1 + Ldir2 + . . . , (2.2)
where Ldiff is the reflected luminance from hemispherical diffuse light, and Ldir1 and Ldir2
are the luminance contributions from various discrete light sources. It should be noted
that specular reflection can occur from both diffuse and discrete light sources. In recent
years, methods have been developed to characterize display reflectance and Lamb resulting
from the specular and diffuse components of multiple light sources [International Committee
for Display Metrology (ICDM) 2012]. Each of these sources has a specific illuminance or
luminance, and a corresponding reflection coefficient that describes how the display scatters
that light.
Historically, the difficulty in characterizing and correcting for the effects of direct light
sources in a clinical environment lead to minimizing the amount of direct lighting, making
diffuse sources the primary component of Lamb . Without specular reflections from directed
light sources, Lamb can be estimated by measuring the illuminance from diffuse light sources.
Traditionally, medical physicists have relied upon this simplified formalism for considering
the effects of Lamb . This includes direct measurement of Lamb under normal usage conditions,
or its estimation based on measurement of ambient illuminance E and the display’s coefficient
of diffuse reflection Rd [Chawla and Samei 2007; TG18 2005]. Measuring the coefficient of
diffuse reflection is beyond the scope of this report, and the reader is referred to the TG18
report for guidance on estimating Rd .
102.3.1.2 Test Equipment
Ambient Luminance
A calibrated telescopic photometer is necessary to directly measure Lamb . Such a device
can also be used to measure the reflection coefficients, typically using a calibrated diffuse
reflectance standard [IDMS 2012]. Contact photometers are inappropriate for evaluating
ambient luminance because their direct contact with the display will reduce or eliminate the
visible light incident on the surface.
Ambient Illuminance
Lamb can be estimated from measurements of the illuminance E incident on the display.
E can be measured directly by placing an illuminance meter on the display surface under
normal usage conditions. For consistency, the meter should be aligned at the display center
position in a way that does not require the operator to hold it (e.g., suspended via cable
or mounted on a tripod). Illuminance may also be measured by using a diffuse reflectance
standard and a telescopic photometer, but a description of this method is beyond the scope
of this report [IDMS 2012].
2.3.1.3 Procedure
Directly Measure Ambient Luminance
To measure Lamb directly, the display to be tested should be turned off or otherwise put
in a mode where any light leaving the display surface is due solely to reflection, and not
the display backlight. For this measurement to be accurate, the room lighting should be
maintained as it would be for clinical use (preferably avoiding any direct light sources).
For the measurement, a telescopic photometer is positioned at the typical viewing direction
to the display surface. Once the reading from the photometer has stabilized, the ambient
luminance Lamb is recorded.
Determine Ambient Luminance from Ambient Illuminance
To measure E, an illuminance meter should be positioned in the center of the display with
the room lighting maintained as it would be for clinical use. It should be noted that reflective
clothing such as lab coats and other light sources directed at the display may significantly
affect measurements of E. Once the meter has stabilized, the ambient illuminance is recorded.
To estimate Lamb , multiply the measured ambient illuminance E by the diffuse reflection
coefficient Rd :
Lamb = E · Rd . (2.3)
Note on the Diffuse Reflection Coefficient (Rd )
As mentioned above, a discussion of Rd measurements is beyond the scope of this work.
If the value is unavailable from the manufacturer, and is not readily measurable, a typical
value of 0.005 cd/m2 /lux may be assumed [Chawla and Samei 2007]. Typical values of Rd
range from 0.002 to 0.010 cd/m2 /lux, though higher values are possible with glossy displays
or protective panels. Users should be aware that the assumed Rd value greatly impacts
calculated system characterization values. Table II illustrates this point by showing how
11given the same reading environment, calculated display performance metrics can change
considerably just by assuming a different Rd value.
TABLE II. Estimated Reflection Coefficient Comparison
Case 1 Case 2
Ambient Illuminance (E) 40 lux 40 lux
Reflection Coefficient (Rd ) 0.005 cd/m2 /lux 0.010 cd/m2 /lux
Ambient Luminance (Lamb ) 0.2 cd/m2 0.4 cd/m2
Minimum Luminance (Lmin )0
1.0 cd/m2 2.0 cd/m2
Maximum Luminance (L0max ) 350 cd/m2 700 cd/m2
A relatively small absolute change in actual or estimated reflection coefficients results
in a large change in required display performance. In Case 1, the recommended values
are achievable with business-grade displays. However, in Case 2, only high-end diagnostic
displays will be capable of achieving and maintaining the suggested level of maximum lumi-
nance. Careful consideration of display selection and reading environment can have a large
impact on overall performance and evaluation.
Comment on Rd Formalism
As stated, the TG18 report provides a model for estimating Lamb as the simple product of
the room illuminance E and Rd . While this methodology is relatively simple to implement,
and many display manufacturers will provide Rd values for their display models, it should be
recognized that modern developments in reflectance metrology rely on a different approach.
Under this more modern formalism, Lamb = E · ρsi /π where ρsi is the hemispherical diffuse
reflectance in the absence of direct light sources. A full description of the methodology can
be found in the “Information Display Measurement Standard” published by the International
Committee for Display Metrology [IDMS 2012]. The methodology suggested in the TG270
report (based on the TG18 method) provides for a simplification of the IDMS technique,
and should not result in a meaningful difference in measurement values. Furthermore, the
TG270 methodology is consistent with other standards for display evaluation in medical
settings [IEC 62563-1 2016].
2.3.1.4 Assessment
The primary reason for determining Lamb is because it affects how a display’s luminance
response function should be calibrated and evaluated. Ultimately, the goal of ensuring that
contrast is maintained across all gray levels must include accounting for Lamb , particularly at
low luminance levels, where the effects of ambient light will be most apparent. Incorporating
Lamb into the evaluation of the luminance response is discussed in the Display Luminance
and Grayscale Function section.
In addition to incorporating Lamb into the evaluation of the luminance response, excessive
Lamb values should be identified by comparing Lamb to Lmin . The ambience ratio AR is defined
as Lamb /Lmin , and, in general, should be less than 1/4. The AR limit of 1/4 ensures that in
darker regions of the image, at least 80% of the contrast that is observed in total darkness
will be visible under ambient illumination. Deviating from this recommendation will degrade
12contrast at the lower end of the luminance response function, unless Lamb is both relatively
constant and explicitly considered in the luminance response function calibration. The AR
of 1/4 recommendation is easily achievable on most modern flat-panel displays, where the
diffuse reflection coefficient is fairly low. However, in situations where the ambient lighting
is not controllable, or is very bright (e.g., ER areas, surgical suites), the user must be aware
of the potential for image viewing degradation in the darker regions of the image.
It should be noted that eliminating all sources of ambient light, i.e., making the area as
dark as possible, is typically not practical in a clinical setting. Newer research also suggests
that the traditional goal of keeping a reading room as dark as possible is not ideal, and
is unnecessary with modern flat-panel displays. Minimizing the need for visual adaptation
may reduce visual strain, thus making it better to design viewing environments in which
there is a consistent average perceived luminance over the visual field, from paper on a desk,
to a worklist on a navigation display, to the medical image on a diagnostic display. For the
reading room environment, it has been suggested that this can be achieved with ambient
light conditions of 25–75 lux [Brennan et al. 2007; Chawla and Samei 2007; Pollard et al.
2012]. Whether set to this suggested range, determined by personal preference, or limited
by clinical environmental conditions, understanding how to consider ambient lighting and
display settings is necessary to ensure that visual information is not lost.
2.3.1.5 Suggested Limits
Diagnostic Displays
The suggested limit for the ambience ratio AR (Lamb /Lmin ) is 1/4. This is generally achievable
in reading environments with ambient illuminance of 25–75 lux, where the increase over
absolute darkness (0 lux) will reduce visual strain [Brennan et al. 2007; Chawla and Samei
2007; Pollard et al. 2012].
Modality, Clinical Specialist, and EHR Displays
For modality, clinical specialist, and EHR displays, this report recommends an AR of 1/4.
Clinical environments outside of the reading room, such as fluoroscopy suites, may require
higher ambient lighting conditions for the clinical task. In these brighter environments,
maintaining the AR at or below the recommended 1/4 may be difficult. Viewing images in
environments where the AR exceeds 1/4 may result in loss of contrast in darker regions of
the image, with increasing loss for increasing ambient illumination. In these situations, it is
important to consider factors that can help both mitigate the loss of visual information and
provide sufficient and appropriate display for the clinical needs:
• Locally dim lights above and near displays, or temporarily dim lighting for viewing
during image acquisition.
• Position or angle displays to reduce ambient reflection.
• Use high-luminance displays to allow increasing Lmin and reducing AR, while also
maintaining luminance ratio.
• Use displays with low diffuse reflection coefficients to reduce AR by reducing Lamb .
• Account for Lamb in the calibration of the display’s luminance response function.
132.3.1.6 Qualitative Assessment
For more routine testing of displays (or if quantitative assessment is not possible), qualitative
assessment should be considered. Many display test patterns include regions that contain
low-contrast features in the darkest gray levels (e.g., TG270-sQC 0 square or SMPTE 0%/5%
square). These features should be visible on a properly calibrated display under typical
ambient lighting. To evaluate the appropriateness of the ambient lighting, one should first
verify that all low-contrast features can be visualized when there is minimal or no ambient
lighting (e.g., with all room lights turned off and windows covered). Once the test pattern
visibility in near or complete darkness is confirmed, the ambient lighting should be set to
level normal for that area. If the low-contrast features can no longer be visualized, it is
likely the display’s configuration is not appropriate under the normal ambient lighting.
In addition to the aforementioned patterns, the TG18 report defined the TG18-AD pat-
tern for evaluating low-luminance, low-contrast display performance. The pattern contains
49 regions with modulating bar patterns with pixel values between black (gray level 0) and
increasing gray levels (gray levels 1 through 49 on an 8-bit display). Physicists can use
this pattern to evaluate the effects of ambient lighting on the ability to visualize features
of the pattern under different lighting conditions for a given display. While a pattern such
as the TG270-sQC pattern is useful for a pass/fail criteria for ambient lighting conditions,
the TG18-AD pattern is useful both to provide a more-detailed qualitative analysis of the
conditions and to give context to failures. This report does not make any specific pass/-
fail recommendations, but recommends the user becomes familiar with this pattern when
determining the clinical impact of potential display issues.
2.3.2 Display Luminance and Grayscale Function
2.3.2.1 Rationale
A display’s luminance performance is generally considered its defining characteristic. As
mentioned in a previous section, the maximum luminance of a display, Lmax , is often given
great consideration when describing the capabilities of a display. While Lmax is indeed a
critical characteristic, the luminance performance at all levels is of tremendous importance
when considering how an image will appear to a user. In addition to Lmax , the minimum
luminance Lmin and luminance response function must be evaluated as part of any display
quality control program.
Minimum Luminance
Lmin describes the luminance that a display will output when an image with the minimum
pixel value is displayed. For calibrated display devices, the minimum luminance is typically
on the order of 1.0 cd/m2 , though it may be as low 0.05 cd/m2 . For OLED display devices,
the lowest possible minimum luminance may be closer to 0.00 cd/m2 . Given that the the
recommended Lamb setting is 1/4 of Lmin , operating at levels close to absolute darkness
(0.00 cd/m2 ) is generally not desirable. At these levels, the effects of Lamb may obscure
contrast present in the darkest regions of the image (Figure 1). The total combined minimum
luminance of the display (both emitted and reflected) can be defined as L0min = Lmin + Lamb ,
which includes the effects of ambient luminance and the inherent luminance of the display.
Evaluating this combined minimum luminance is important for maintaining an operating
level that will reliably show contrast in the darkest regions of an image.
14FIG. 1. Effect of different ambient lighting conditions on the perceived luminance. The effects
of the ambient lighting are most significant at low luminance levels, where the constant ambient
level is a much higher percentage of the total luminance reaching the observer. The display in this
example was calibrated to the DICOM GSDF assuming Lamb = 0.1 cd/m2 .
As luminance decreases below 3 cd/m2 , the cones in the eye become increasingly unre-
sponsive, while rods become increasingly responsive. This is referred to as mesopic vision.
The foveal cones are responsible for many visual tasks, and their decreased response at very
low luminance means that low-contrast objects can no longer be distinguished (Figure 2).
In addition to minimizing the effect of Lamb obscuring contrast at the darkest operating
levels of the display, setting Lmin to a value higher than the absolute minimum of the display
ensures the user’s visual system avoids entering too far into mesopic vision.
Maximum Luminance
Lmax describes the luminance that a display will output when an image with the maximum
pixel value is displayed (255 on an 8-bit system). In the case of diagnostic displays, the
operating Lmax is typically less than the absolute maximum output of the display, which can
be 1000 cd/m2 or higher. The luminance capability is typically lower for modality, EHR, and
clinical specialist displays, and Lmax is often set to the maximum brightness possible on the
display (generally closer to 250 cd/m2 ). One major difference between diagnostic and most
modality, clinical specialist, and EHR displays is that diagnostic displays will generally show
the luminance settings in the on-screen display (OSD) menu or within the QC software with
units of cd/m2 , while modality, clinical specialist, and EHR displays more commonly show
15it in terms of percent brightness. This illustrates a major difference between these classes of
displays and the difference between reporting an absolute measurement (units of cd/m2 ) and
a measurement relative to the maximum output of the display (units of percent brightness).
While the luminance properties of all displays change with age and use, diagnostic displays
often have built-in backlight sensors that automatically make adjustments to maintain a
desired luminance. Modality, clinical specialist, and EHR displays, however, generally do
not have this feature, resulting in different luminance measurements for the same “percent
brightness” between displays of different ages. As a result of this change in output as the
display ages, routine testing is necessary to ensure a display’s performance is adequate.
Luminance Ratio
The ratio of maximum combined luminance, L0max = Lmax + Lamb , to the minimum combined
luminance L0min is defined as the luminance ratio (LR). LR describes how much “contrast”
will be visible when viewing an image that maps across all gray levels. It is important that
LR is large enough to ensure sufficient contrast across all gray levels but not so large that
the range of the human visual system is exceeded [TG18 2005, Appendix II]. The luminance
ratio should be similar for all displays to ensure similar image appearance [ACR-AAPM-
SIIM 2017; TG18 2005]. It should be noted that the luminance ratio is not the same as the
contrast ratio, which is often included in a display’s technical specifications.
Luminance Response
The luminance response describes the points between L0min and L0max , and has a direct impact
on the information available to the user. Proper calibration of a display’s luminance response
helps to ensure adequate contrast over a range of displayed gray levels. Additionally, the
use of a luminance response function that is consistent between all displays in the image
review process is a step toward providing similar image presentation, and therefore similar
information, to all viewers. This report recommends the use of the DICOM Grayscale
Standard Display Function (GSDF), which is described in Part 14 of the DICOM standard
[DICOM Standard, Part 14]. The DICOM GSDF aims to provide similar visual contrast
between adjacent gray levels over the full dynamic range of a display, and has been widely
adopted for medical image viewing.
Despite its widespread use, users should understand the limitations of the DICOM GSDF.
A primary difference between the DICOM GSDF theoretical viewing conditions and typical
image viewing conditions is the adaptation state of the observer’s visual system. The DICOM
GSDF assumes varied visual adaptation, where the displayed image is almost completely
uniform, with only a small target pattern to measure the contrast threshold. The image’s
background luminance is changed along with the target pattern and the observer adjusts to
the new luminance state before determining the necessary contrast to detect the target. This
process is continued (increase luminance, adapt to new state, measure contrast threshold)
to create the contrast threshold vs. luminance plot in Figure 2 for varied visual adaptation.
Typical viewing conditions for most users, however, operate under fixed adaptation, where
the mean luminance of the image remains relatively fixed and images contain a mixture of
bright and dark regions. Under these conditions, there is degraded contrast transfer as the
luminance of the viewed region moves away from the mean luminance of the image [Baxter
et al. 1981; Flynn et al. 1999; Tchou 2007]. Therefore, the DICOM GSDF is a good predictor
for the contrast needed near the mean luminance of an image, but less so in the bright or
dark regions (Fixed Visual Adaptation curve in Figure 2). This reduced contrast transfer
16You can also read