Techniques of Justice: W. E. B. Du Bois's Data Portraits and the Problem of Visualizing the Race
←
→
Page content transcription
If your browser does not render page correctly, please read the page content below
Techniques of Justice: W. E. B. Du Bois’s
Data Portraits and the Problem of
Downloaded from https://academic.oup.com/melus/advance-article/doi/10.1093/melus/mlab031/6408585 by guest on 15 December 2021
Visualizing the Race
Katherine Fusco
University of Nevada, USA
Lynda C. Olman
University of Nevada, USA
Introduction
Heralded by the 2014 special issue of MELUS on race and visual culture, African
American literary studies have pivoted toward this subject, and for good reason,
as practices of looking are fundamental to the construction of race. Shawn
Michelle Smith, the editor of this special issue, argues for a shift from studies
of representation, customary to literary scholars, to studies of the gaze and other
visual practices. She challenges scholars of multi-ethnic studies to “not ask what
does race look like but how are racialized subjects produced through practices of
looking” (“Guest” 8). In other words, Smith argues for treating race not as a static
object that needs to be seen more clearly but rather as a mode of seeing.
While this shift in focus is critical for all authors and eras, it is particularly
fruitful for those that have thus far been treated primarily from literary or histor-
ical angles. Few authors are riper for this kind of reanalysis than W. E. B. Du Bois,
whose data visualizations have recently been released in a volume edited by
Whitney Battle-Baptiste and Brit Rusert and who, as Smith points out, was
very astute on the subject of race and the gaze. Smith argues that Du Bois’s fa-
mous conception of racial “double-consciousness” rested on an explicitly visual
practice: “For Du Bois, learning to see oneself refracted through the lens of a dom-
inant white gaze also enabled one to unsettle the authority of that gaze and to
learn to see differently with what he called ‘second-sight’” (3).
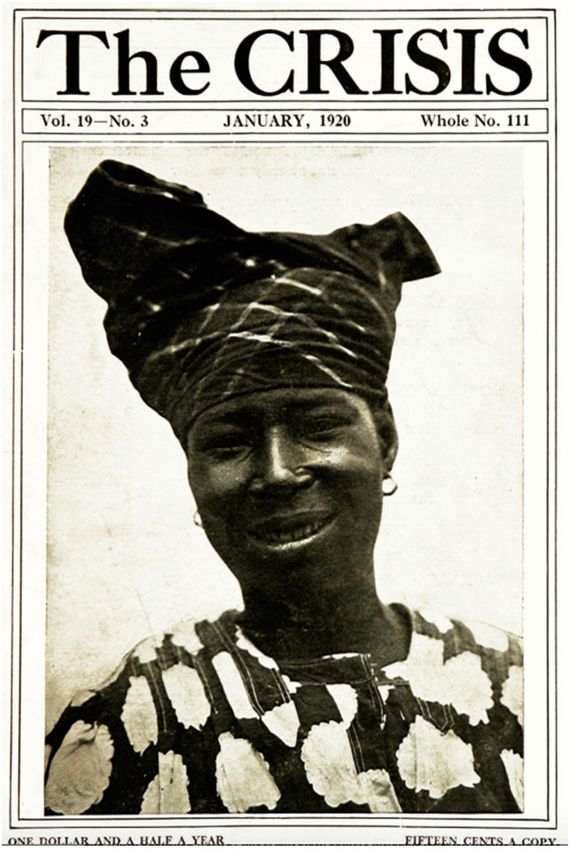
Accordingly, scholars have begun work on Du Bois’s contributions to the vi-
sual arts, particularly his editorial work on the covers of The Crisis and the pho-
tographic portraits from the 1900 Paris Exposition.1 However, as Smith points
out, many studies have focused more on representations of race than racialization
......................................................................................................
ß MELUS: The Society for the Study of the Multi-Ethnic Literature of the United States 2021. Published by Oxford
University Press on behalf of The Society for the Study of the Multi-Ethnic Literature of the United States.
All rights reserved. For permissions, please e-mail: journals.permissions@oup.com.
DOI: 10.1093/melus/mlab031
MELUS Volume 46 Number 3 (2021) 1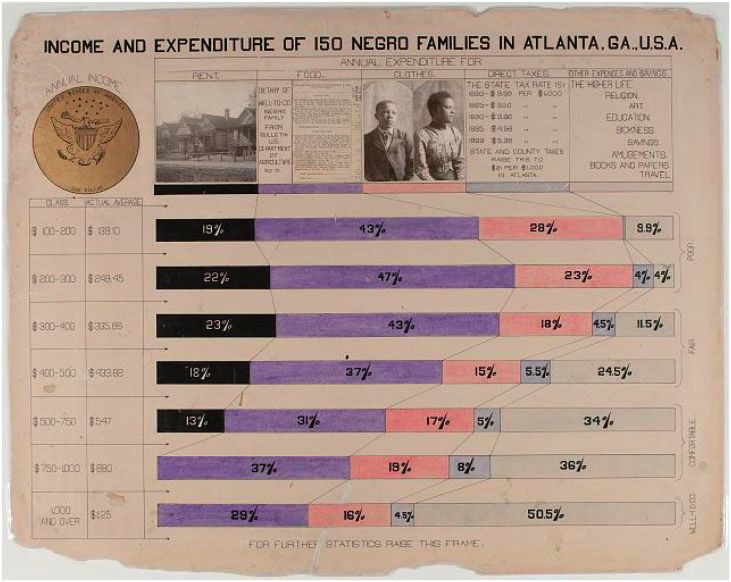
Fusco and Olman

    as a visual act or practice. The authors in the Battle-Baptiste and Rusert collection
    similarly focus primarily on the necessary task of locating Du Bois’s data visual-
    izations in their immediate context, which leaves to future scholarship the proj-

                                                                                              Downloaded from https://academic.oup.com/melus/advance-article/doi/10.1093/melus/mlab031/6408585 by guest on 15 December 2021
    ects of describing the practices of looking that generated the data visualizations
    and of considering their resonance with Du Bois’s larger project of revising (as in
    re-seeing) race—particularly his construction of the highly educated group of
    race leaders he dubbed the Talented Tenth as an epitome of black American life.
        We consider how the data visualizations interact with Du Bois’s attempts to change
    the way that Americans visualized Blackness. Following Michel Foucault’s theories of
    panoptic visualization, we find Du Bois working visually through the analytic mode
    (breaking down an apparent unity into diversity) to deconstruct existing visual stereo-
    types of black American life and then through the synoptic mode (assembling a co-
    herent unity from diversity) to replace the old stereotypes with new ones.
        Across both his more well-known writings and his specialized discussions of
    social scientific practice, Du Bois calls for scalar shifts in vantage point. Thus,
    scale and vantage have long been crucial concepts for studies of Du Bois’s distinc-
    tive place in black public intellectualism, as evidenced by Ross Posnock’s Color
    and Culture: Black Writers and the Making of the Modern Intellectual (1998)
    and Paul Gilroy’s The Black Atlantic: Modernity and Double Consciousness
    (1993). Both scholars take up the question of Du Bois’s literal and figurative place
    in the world and the perspective his situation afforded on black life. Although
    drawing somewhat different conclusions about Du Bois as public intellectual,
    Gilroy and Posnock share an emphasis on texture in the Du Boisian project, on
    the tension between the smooth and the granular.
        We investigate this tension in Du Bois’s Paris Exposition data visualizations by
    applying Foucault’s theory of visual panopticism, which was developed through
    the investigation of the precise era of scientific visualization in which Du Bois ma-
    tured as a sociologist. We consider not only the interplay of the synoptic (smooth)
    and the analytic (granular) in Du Bois’s panoptic data visualizations but also how
    this interplay conditions the ways the data visualizations participate in Du Bois’s
    project to reform stereotypes of black life. The synoptic and the analytic require
    different forms of attention and engagement from the viewer. While the idealized
    photographs of the black middle class included in the Paris Exposition offered a
    direct corrective to negative images, they did not address the relationship between
    image and knowledge that underpinned black stereotypes. By contrast, in their
    frequently arresting and sometimes surprising transformation of data points
    into images, Du Bois’s data visualizations challenged viewers to consider how in-
    dividual lives were agglomerated into a coherent body of knowledge about a peo-
    ple. In other words, the data visualizations posed and sought to answer the
    questions of how a new stereotype of black life in American might be assembled
    from the lives of individual black Americans and what this might look like. In his

2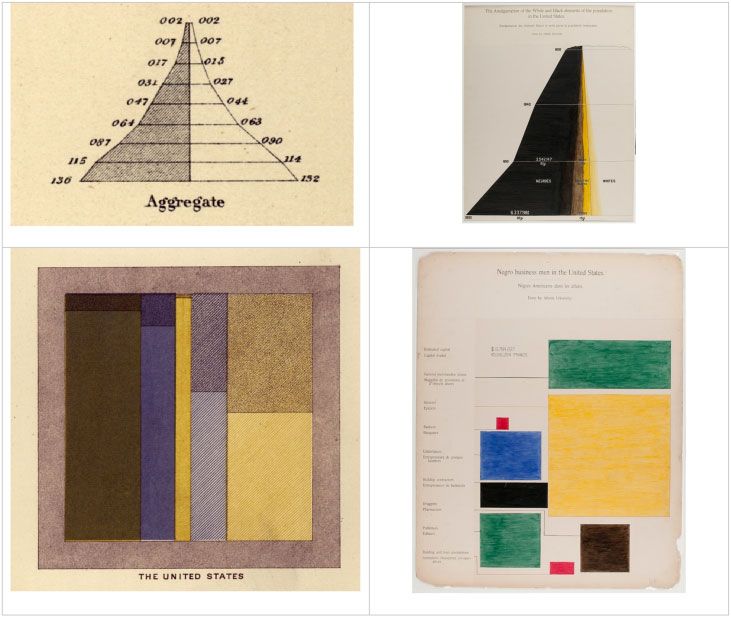
Techniques of Justice

Paris Exposition efforts to communicate Blackness to the world, Du Bois offered
not only new images of Blackness but also new ways of seeing.
    Our study of Du Bois’s data portraits for the 1900 Paris Exposition is situated in

                                                                                               Downloaded from https://academic.oup.com/melus/advance-article/doi/10.1093/melus/mlab031/6408585 by guest on 15 December 2021
relation to recent scholarship focused on Du Bois and visual culture, in particular that
which takes seriously the matter of color and line as bearing not just metaphorical but
textual, material, and representational import for Du Bois.2 As scholars working on
nineteenth-century black visual culture have shown, for African Americans resisting
white-supremacist, popular, and scientific racial epistemologies, images had long
been construed as rhetorical. For example, in her account of antebellum black visual
culture, ranging from black women’s friendship albums to racist caricatures of free
people of color to bourgeois daguerreotypes, Jasmine Nichole Cobb demonstrates
how black visual culture acts as a demonstration of the future, creating a graphic
record of what freedom might look like even as a significant portion of black
Americans remained in bondage. Similarly, in Envisioning Emancipation: Black
Americans and the End of Slavery (2012), Deborah Willis and Barbara
Krauthamer reproduce a number of photographs leading up to and following eman-
cipation to show the way the photographic subject’s pose “address[es] prevailing
questions about the meaning of black freedom in America” (3). When Du Bois en-
tered the visual arena, he, too, deployed photographic representations of individual
African Americans as a powerful body of counter-evidence against white-
supremacist images of Blackness. In her comprehensive account of the Paris
Exposition photographs, Smith argues that the images “collectively function as a
counterarchive that challenges a long legacy of racist taxonomy, intervening in
turn-of-the-century ‘race science’ by offering competing visual evidence”
(Photography 2). As Smith explains, the photographs’ propagandistic value was par-
ticularly important as a counter to popular racist displays at the Exposition, such as
the villages noirs that staged primitive caricatures of African life.
    While the work of countering negative with positive images of black life con-
tinues to be an important part of the fight against white supremacy in the visual
field, the data portraits offer an opportunity to move the conversation about black
visual culture away from figuration and the representational, a move that we see
as mirroring Du Bois’s philosophical and social-scientific commitments. As Russ
Castronovo has compellingly demonstrated, even when rendered as an abstract
value such as “beauty” or via the philosophical concept “aesthetics,” the visual
field always operated as politically efficacious for Du Bois, who had a genius
for appropriating abstraction to the project of liberation and justice. Rather
than replacing negative stereotypes with positive images in the same genre, the
data portraits show Du Bois’s move to a visually abstract register. Through our
examination of the data portraits, we respond to Smith’s call to “not ask what
does race look like but how are racialized subjects produced through practices
of looking” (“Guest” 8). She takes up this call in her work on photography at
the Paris Exposition, in which she elaborates the color line as a material and

                                                                                           3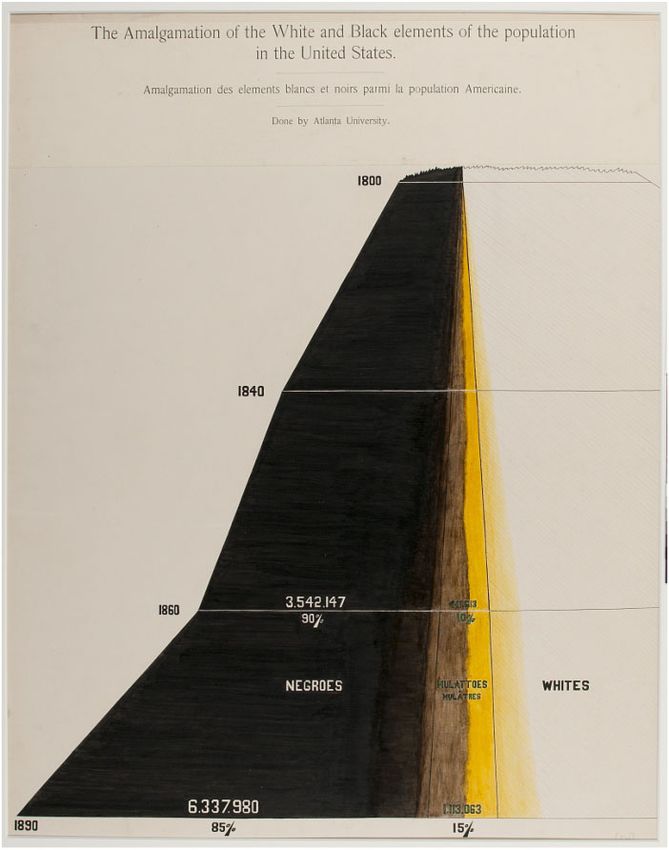
Fusco and Olman

    embodied practice, explaining “the conceptual meaning of the color line as a
    nexus of competing gazes in which racialization is understood as the effect of
    both intense scrutiny and obfuscation under a white supremacist gaze”

                                                                                             Downloaded from https://academic.oup.com/melus/advance-article/doi/10.1093/melus/mlab031/6408585 by guest on 15 December 2021
    (Photography 2). If the ink of the racist cartoon or the dehumanizing camera
    eye represented one type of intense yet distorting view of black life, so, too,
    did the sociological report on African American communities. Du Bois fought
    his battle on two fronts. Reading the data portraits in the context of Du Bois’s
    larger commitment to the visual allows us to see that the important relationship
    between visuality and political meaning appears on scene a decade before Du
    Bois’s avowed transformation from “a scientist to . . . a master of propaganda”
    (Dusk 47). The data portraits clearly communicate Du Bois’s sense that the visual
    method of presenting scientific data was just as significant as the data presented.
        Furthermore, as a counterpoint to the common story that Du Bois’s movement
    from sociologist to Crisis editor registered his frustration with academic science, we
    argue that in the Paris data portraits Du Bois was already imbuing science with rhe-
    torical techniques. Such an account of Du Bois’s early public intellectualism draws on
    Rusert’s work on “fugitive science”—namely, “a furtive science and praxis that sug-
    gested ways that a wide array of popular sciences might be linked to emancipation
    struggles” (18). Although Du Bois did not need to work as furtively, perhaps, as some
    of the antebellum figures Rusert discusses, his research nonetheless bears the hall-
    marks of praxis, creativity, and oppositionality that characterize fugitive science.3
    Although, as Rusert explains, scientific fugitivity waned by the twentieth century
    as both literary authorship and natural science became increasingly professionalized,
    Zora Neale Hurston and Du Bois are outliers (222) who retained a commitment to
    their epistemology as “a dynamic domain of practice, stretching from scientific to
    artistic domains” (19). Part of Du Bois’s dynamism (and Hurston’s) comes from
    his commitment to capturing the diversity of black life, a commitment that some-
    times interacted strangely with strands of elitism in his thinking—most famously
    represented by his commitment to the Talented Tenth.4 Accordingly, in addition
    to contributing to more recent readings of Du Bois that bridge his sociological
    and literary-aesthetic interests, by considering the relationship between the synoptic
    and analytic modes of the data portraits—that is, their juxtaposition of totality and
    granularity—we bring a new angle to debates about elitism that have long haunted
    Du Bois’s work.5 Du Bois’s dual scientific and political investments produced a con-
    stant oscillation between representing the granular truths of black life and composing
    a positive stereotype of American Blackness.

    The Paris Exposition and the Data Portraits
    Du Bois had just sent the text of his sociological masterwork The Philadelphia
    Negro: A Social Study (1899) to the press and settled into his new teaching

4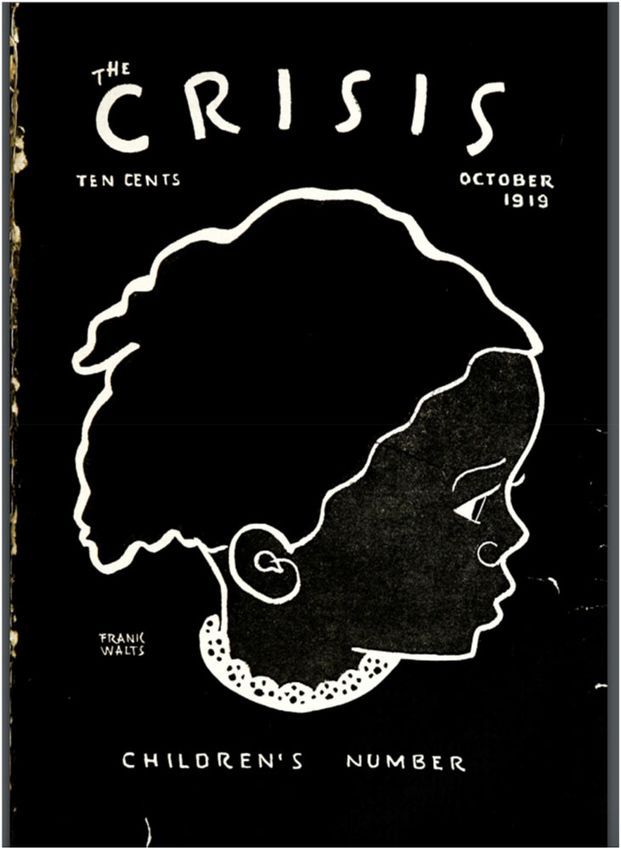
Techniques of Justice

position at Atlanta University when he received a letter from Thomas J. Calloway
about the Paris Exposition. This exposition was the fifth installment of French
contributions to, and the thirteenth instance overall of, the “world’s fair” fad

                                                                                            Downloaded from https://academic.oup.com/melus/advance-article/doi/10.1093/melus/mlab031/6408585 by guest on 15 December 2021
sweeping nationalist Europe. The 1900 Exposition would erect national and co-
lonial “palaces” and multinational pavilions of art, industry, history, and the
new field of “social economy,” and Calloway had been invited to organize some-
thing on black life in the United States. As Calloway argued in his letter to Du Bois
and other black American intellectuals, Europeans were the arbiters of high cul-
ture, and they held negative stereotypes of black people carried across the Atlantic
by salacious media reports of lynchings and other sensational events that stood
without rebuttal. The Paris Exposition would present an excellent occasion, with
“thousands upon thousands” of attendees, to “do a great and lasting good in con-
vincing thinking people of the possibilities of the Negro” (“Letter”).
    Du Bois, fresh from proposing revisions to the Atlanta Conferences in order to
study the black situation in the United States with more scientific rigor, immedi-
ately agreed to participate. A rough structure for the “Negro Exhibit,” as Calloway
termed it, was drawn up to showcase the advances blacks in the United States had
made since Reconstruction in ten categories: history, education, literacy, occupa-
tions, property, publications, patents, industry, cultural organizations, and race
relations. The exhibit would feature evidence and artifacts in each category, in-
cluding a famous set of photographs of black Americans from Hampton
University and a series of models of black American dwellings documenting their
development from slave hovels to middle-class brownstones and schoolrooms.
Du Bois was contracted to produce “plans, charts, and figures” illustrating “a se-
ries of facts” in all ten categories (Du Bois, Autobiography 140).
    With three months to work and a budget of $2,500, Du Bois and his team col-
lated census data on black citizens in Georgia, collected new data of their own, and
generated sixty-three data visualizations in two primary series—The Georgia
Negro: A Social Study (1900) and A Series of Statistical Charts Illustrating the
Condition of the Descendants of Former African Slaves Now Resident in the
United States of America (circa 1900)—plus a third, three-graphic interlude titled
“Income and Expenditure of 150 Negro Families in Atlanta, GA, USA.”6 Du Bois
worked so hard on the project that he suffered a breakdown halfway through the
spring, and his doctor almost ordered him to halt work (141). Furthermore, the
production was so last minute that Du Bois could not find a cabin to reserve for
the voyage to Paris, and he had to accompany the graphics in steerage.
    Once there, he oversaw the assembly of the Exhibit of American Negros in the
Palace of Social Economy and Congress at the Universal Exposition and witnessed
it “always full” (141). The Negro Exhibit won a Grand Prix and Du Bois a gold
medal for the charts, which “most interested visitors,” Calloway boasted in a cor-
respondence report published in The Colored American in November of that year
(Du Bois, “American” 9). The preeminence of Du Bois’s achievements in Paris

                                                                                        5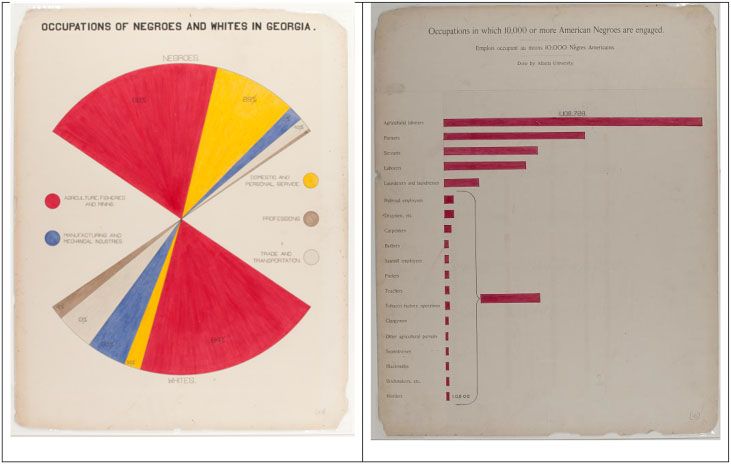
Fusco and Olman

    resulted in his recognition as the Negro Exhibit’s “driving intellectual force”
    (Provenzo 1); however, the Exhibit was in fact a collaboration involving several
    historically black universities in the United States, and Calloway’s role in orches-

                                                                                             Downloaded from https://academic.oup.com/melus/advance-article/doi/10.1093/melus/mlab031/6408585 by guest on 15 December 2021
    trating it—and in commissioning the arresting Hampton photos—should not be
    underestimated (Sinclair 119–20).
        Du Bois’s own report on the exhibit, “The American Negro at Paris” (1900),
    covered similar details to Calloway’s, but Du Bois also leveraged the occasion
    to launch a critique of contemporary sociology. As opposed to sociology based
    in theories of society, Du Bois claimed his exhibit was “sociological in the larger
    sense of the term—that is, an attempt to give, in as systemic and compact a form
    as possible, the history and present condition of a large group of human beings.”
    This distinction between theoretical and empirical sociology came out of Du
    Bois’s graduate training in German social economy. As for the data visualizations
    themselves, Du Bois justified them via recourse to the word “picture” and its lit-
    eral and metaphorical meanings: “The bulk of the exhibit, is naturally, an attempt
    to picture present conditions. Thirty-two charts, 500 photographs, and numerous
    maps and plans form the basis of this exhibit” (“American” 576). Du Bois added
    the case study of Georgia to this justification because he felt “it was a good idea to
    supplement these very general figures with a minute social study in a typical
    Southern State” (577). In other words, much as he used photos of representative
    men and women to help visitors picture the race, Georgia became the face of US
    race-relations for the data visualizations.
        After the Paris Exposition, the Negro Exhibit was disassembled and shipped
    back to the United States, where it spent some time touring to other locations,
    including the 1901 Pan-American Exposition in Buffalo, New York, before being
    broken apart (Battle-Baptiste and Rusert, Introduction 22). Du Bois’s data por-
    traits, and a collection of photographs of black Americans that he had helped as-
    semble, were sent to the Library of Congress, where they still reside. Du Bois
    apparently asked Calloway in 1909 for the return of the exhibit to Atlanta
    University, but for whatever reason, the transfer was not effected (Calloway,
    “Letter”). For more than a century, then, Du Bois’s stunning images remained
    largely inaccessible and unseen. They were finally digitized and published online
    by the Library of Congress in 2016, after which Battle-Baptiste and Rusert pub-
    lished their edition in 2018.7

    Panopticism and Sociology
    As the authors in Battle-Baptiste and Rusert’s collection rightly point out, Du Bois
    was working in an exciting time for data visualization, particularly in what we
    would now call the social sciences: public health, political science and history,
    economics, and social economy (sociology).8 Methods for studying the natural

6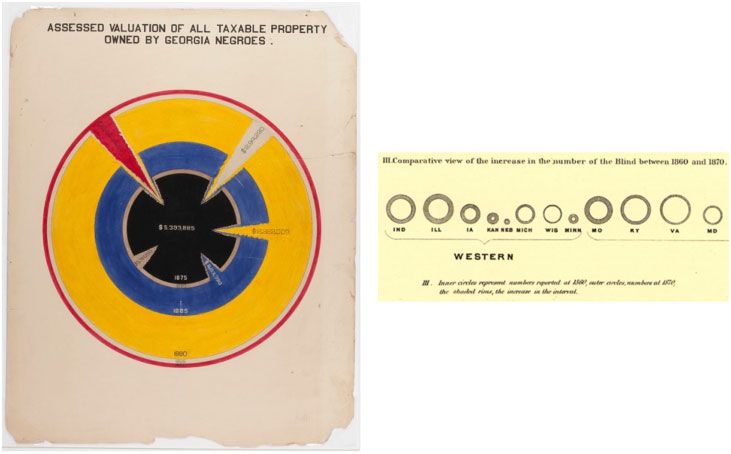
Techniques of Justice

world had stabilized enough at this point that social scientists committed them-
selves to realizing the Enlightenment dream of applying similar methods to study-
ing the social, cultural, political, and psychological arenas.9 As deductive

                                                                                            Downloaded from https://academic.oup.com/melus/advance-article/doi/10.1093/melus/mlab031/6408585 by guest on 15 December 2021
experiments were hard to design and carry out for large groups and areas, social
scientists resorted to inductive methods supported by surveys and census.
However, the resulting masses of granular data presented a challenge for
sense-making. Statistics, naturally, was the primary way this sense was made,
and visualization—as a translation of the reductive power of statistics into aes-
thetic form—evolved in tandem. Ben F. Barton and Marthalee S. Barton have ar-
gued, following Foucault, that statistical visualization is fundamentally panoptic
in nature. Understanding their argument requires a brief detour through
Foucault’s analysis of Jeremy Bentham’s Panopticon, which after all began
(and ended) its life as a technical graphic.
     Most readers of this essay are likely familiar with Foucault’s analysis of
Bentham’s prison, an architecture by which individual prisoners became visually
constituted as a population and, through that process, became infected by the
prison’s logics of control. It is important to note that these logics are fundamen-
tally asymmetric: prisoners are “seen but . . . [do] not see” the authority from
whose viewpoint alone they constitute a coherent body. Each prisoner is therefore
an “object of information, never a subject in communication” with the authority
or their fellow prisoners (“Panopticism” 5).
     Foucault identified panopticism as a visual “schema” that extended well be-
yond the imaginary walls of Bentham’s prison, operating “whenever one is deal-
ing with a multiplicity of individuals on whom a task or a particular form of
behaviour must be imposed” (9). Indeed, a range of scholars from visual, science,
and cultural studies have identified panoptic practices of looking—mapping chief
among these—as prerequisite to the construction of modern racism.10 Barton
and Barton, however, were the first to connect panopticism directly to statistical
visualization—by rooting the development of Foucault’s panoptic “schema” in
his critique of “tabulation.” In The Order of Things, and in his late lectures,
Foucault considers John Graunt’s seventeenth-century London mortality tables
as a pivot point in the history of biopolitics. Graunt’s tables constructed
London’s population as a panoptic array of rows (cause of death) and columns
(year of death) (Foucault, Territory 103–05). Each casualty was reduced to a num-
ber in a cell, visible to the governmental agencies who collect the data and tabulate
it, invisible to each other. In Foucault’s words, tables such as Graunt’s “articulate
the representation as a whole into distinct subregions, all separated from one an-
other by assignable characteristics; in this way they authorize the establishment of
a simultaneous system according to which the representations express their prox-
imity and their distance, their adjacency and their separateness” (Order 81).
Barton and Barton argue on these grounds that tabulation serves as a visual scaf-
fold for panopticism, which is similarly simultaneously “both global and

                                                                                        7
Fusco and Olman
individualising” (Foucault, Power/Knowledge 146). Indeed, they argue that all
data visualizations that seek to represent populations are fundamentally panoptic
(Barton and Barton 141). Although they do not entirely unpack the steps to this
Downloaded from https://academic.oup.com/melus/advance-article/doi/10.1093/melus/mlab031/6408585 by guest on 15 December 2021
conclusion, it seems clear they believe social-data visualizations, such as the
Panopticon, quantize individual subjects in order to categorize and aggregate
them into a coherent visual body, are almost always created by technical author-
ities that have a vested interest in intervening in or controlling that population,
and are generally abstract and technical enough that they do not serve the pur-
poses of solidarity or collective action.
Barton and Barton go on to categorize panopticism into two codependent rhe-
torical modes: the synoptic, or the “global” impulse to see a diverse set of indi-
viduals as a unified “whole,” and the analytic, or the “individualizing” impulse to
treat elements of a whole in terms of their “difference” and “separateness.” While
all data visualizations participate in panopticism, each tends to emphasize one
panoptic mode or another. For instance, Du Bois’s bar charts emphasize synoptic
views of changes in black prosperity over time while his tables emphasize the an-
alytic differences within a particular black neighborhood. Notwithstanding these
differences, the logics of panopticism still obtain in both graphics. Indeed,
Foucault’s assessment that the goals of panopticism are “to strengthen the social
forces—to increase production, to develop the economy, spread education, raise
the level of public morality; to increase and multiply” (“Panopticism” 11)—is
similar to Du Bois’s statement that the goals of the Paris data portraits are to
show “the increase of the Negro population, the routes of the African slave-
trade, the progress of emancipation, and the decreasing illiteracy” (“American”
576).
For similar reasons, in their final analysis, Barton and Barton remain con-
cerned about the totalizing and disempowering effects of panopticism in data vi-
sualization. However, they do find some limited hope for creating subversive or
resistant visualizations in the analytic mode of panopticism, arguing that it gives
viewers some traction, a place to locate themselves in the display, to visually
“stand” and imagine action in the space articulated by the graphic. Graunt’s
tables, for example, might afford a viewer who had just lost a parent or grandpar-
ent to black lung a cell in the table from which to reflect on the years when the air
was cleaner and to advocate for emissions control with local authorities. However,
such analytic activism still depends on the “grid of intelligibility” generated by
synoptic governmental tables of mortality and air quality (Foucault, History
93). The liberatory potential of the analytic mode remains constrained by the syn-
optic mode. Close attention to Du Bois’s own use of the analytic mode in the data
portraits, which were undeniably part of a liberatory project, will sharpen our un-
derstanding of the limits of the analytic as a decolonial technique of visualization.
How did Du Bois learn his panoptic techniques? The most famous early exam-
ples of panoptic data visualization, besides Graunt’s tables, come from Alexander
8Techniques of Justice
von Humboldt’s isotherms and other climate maps and William Playfair’s com-
plex, multi-analytic charts of military campaigns and economic trends. Shortly
before Du Bois was born, the field of “medical topography” innovated additional
Downloaded from https://academic.oup.com/melus/advance-article/doi/10.1093/melus/mlab031/6408585 by guest on 15 December 2021
panoptic visualizations: William Farr’s rose diagrams depicted cholera mortality
in radially exploding monthly wedges throughout the year (Beattie 103), and
Charles Booth’s groundbreaking social surveys of poverty in London were inked
onto maps with a color code that literalized the “blight” of poverty with black
patches (Kimball 359). While we know that Du Bois saw Booth’s maps—he cites
Booth in the Philadelphia Negro and patterns its fold-out maps after Booth’s (Du
Bois and Eaton 419)—Silas Munro deduces that Du Bois would also have likely
encountered, during his graduate studies in Berlin, Playfair’s charts and Florence
Nightingale’s famous Crimean War rose diagrams of battlefield mortality rates
(49).
The strongest influence on Du Bois’s data portraits, however, is one that goes
unrecognized by the scholars of the Battle-Baptiste and Rusert collection: the
Statistical Atlas of the United States Based on the Results of the Ninth Census
1870 with Contributions from Many Eminent Men of Science and Several
Departments of the Government (1874), compiled by Francis A. Walker. This
groundbreaking work visualized the statistics of the 1870 US census using not
only traditional maps but also charts and other “geometric figures” that were
designed to provide panoptic views of the complex and diverse data “at a glance”
(Walker 3) in ways that “strike the eye, as a whole, at once, instead of requiring
the eye to pass now up and now down from side to side of a page, much of the
impression of what has gone before being lost as each new portion of the figure is
brought into view” (2). These graphics made a major impact on Du Bois’s visual
style: he cites the Walker atlas in the Philadelphia Negro, the proving ground for
many of the Paris series’ techniques; he uses the 1870 census data on race exten-
sively throughout the Paris series; and finally, over a third of the graphics in the
Paris series show the clear influence of the geometric figures designed by F. H.
Wines and J. J. Skinner and that Walker “believe[d] to be a novelty in the graphic
illustration of Statistics” (2) (see fig. 1).11 This graphical influence will be dis-
cussed in more detail below during the analysis of individual Paris data portraits,
as will the significant innovations Du Bois and his team made on the Walker
figures.
Du Bois’s fascination with panoptic social-scientific graphics was part and par-
cel of his project of attacking racism with science. In Dusk of Dawn: An Essay
Toward an Autobiography of a Race Concept (1940) and The Autobiography of
W. E. B. Du Bois: A Soliloquy on Viewing My Life from the Last Decade of Its
First Century (1940), his two retrospective memoirs, Du Bois is open about his
science boosterism at the time of the Paris Exposition. He first encountered in-
tellectual “race dogma” at Harvard, when statements about the inferiority of
blacks to whites were taken as axiomatic among the faculty. Du Bois went to
9Fusco and Olman
Downloaded from https://academic.oup.com/melus/advance-article/doi/10.1093/melus/mlab031/6408585 by guest on 15 December 2021
Fig. 1. Comparison of selections from the Francis A. Walker atlas (left) with the Du Bois data portraits
(right). (a) Detail from plate XXXVIII, “Charts showing the distribution by age and sex of the popu-
lation of the United States at the date of enumeration June 1st in the aggregate and with distinction
of race, color, and nativity for the United States and in the aggregate and as native or foreign for
each state and territory”; (b) Plate 54, “The Amalgamation of the White and Black Elements of the
United States”; (c) Detail from plate XXXII, “Chart showing for the United States and for each state,
with distinction of sex, the ratio between the total population over 10 years of age and the number
of persons reported as engaged in each principal class of gainful occupations and also as attending
school”; (d) Plate 57, “Negro business men in the United States.” Walker plates taken from
Statistical Atlas of the United States. Du Bois plates taken from A Series of Statistical Charts.
Germany to train in social-science methods in large part to disprove these axioms
from a top-down or panoptic perspective. He wrote: “I was going to study the
facts, any and all facts, concerning the American Negro and his plight, and by
measurement and comparison and research, work up to any valid generalization
which I could. I entered this primarily with the utilitarian object of reform and
uplift; but nevertheless, I wanted to do the work with scientific accuracy”
(Dusk 26; emphasis added).
However, when he began his European studies, Du Bois immediately encoun-
tered more refined versions of the same racial dogmas he had hoped would wither
under enlightenment: “Race became a matter of culture and cultural history. . . .
Which was the superior race? Manifestly that which had a history, the white race;
there was some mention of Asiatic culture, but . . . quite unanimously in
10Techniques of Justice
American and Germany, Africa was left without culture and without history” (49–
50). Still, Du Bois attributed these flaws to the prejudices of the individual white
men lecturing him, not to the sociological methods with which they were incul-
Downloaded from https://academic.oup.com/melus/advance-article/doi/10.1093/melus/mlab031/6408585 by guest on 15 December 2021
cating him. He came back to the United States and was hired at the University of
Pennsylvania determined to combat racism through science: “The Negro problem
was in my mind a matter of systematic investigation and intelligent understand-
ing. The world was thinking wrong about race, because it did not know. The ul-
timate evil was stupidity. The cure for it was knowledge based on scientific
investigation” (50). During his writing of The Philadelphia Negro, Du Bois and
his wife rented a one-room apartment in the Seventh Ward, where, over a
three-month period, he interviewed some 2,500 households. Each morning,
according to biographer David Levering Lewis, the young sociologist would
don cane and gloves and begin visiting his neighbors: “Unassisted, indefatigable,
he would sit for an average of twenty minutes patiently guiding often barely lit-
erate, suspicious adults through a series of questions on the six schedules” (135).
After some 835 hours of interviews, he sorted through the 15,000 household
schedules. As Lewis writes, there was “[n]o representative sampling for Du
Bois. As he tabulated his schedules, he had before him the life histories of the en-
tire black population of the Seventh Ward—nearly ten thousand men, women
and children” (136). This is the data collection model that he would follow in
Farmville, Virginia, the next summer (1897), and in Dougherty County,
Georgia, in the summer of 1898. Thus, when Calloway invited Du Bois to contrib-
ute to the Paris Exposition, he seized the opportunity, noting that “I had been for
over nine years studying the American Negro problem. . . . I wanted to set down
its aim and method in some outstanding way which would bring my work to the
notice of the thinking world” (Autobiography 140). Still, he remarked “continual
change in the proof and arguments” for racism among his scientific colleagues:
I could accept evolution and the survival of the fittest, provided the interval between
advanced and backward races was not made too impossible. . . . But no sooner had
I settled into scientific security here, than the basis of race distinction was changed
without explanation, without apology. . . . I began to see that the cultural equipment
attributed to any people depended largely on who estimated it; and conviction came
later in a rush as I realized . . . I had too often seen science made the slave of caste
and race hate. (Dusk 50)
As a result of thoughts such as these, and hard experience with the failures of his
sociological projects, Du Bois would eventually give up on his dream of ending
racism through science, arguing that “force must come to its aid. The black world
must fight for freedom. It must fight with the weapons of Truth, with the sword of
the intrepid, uncompromising Spirit, with organization in boycott, propaganda,
and mob frenzy” (2). However, at the time that he designed the Paris data por-
traits, he was still a believer, albeit a conflicted one, in the power of science to
11Fusco and Olman
change society. He believed that once Calloway’s “thinking people” saw racism
panoptically—for the global socioeconomic disease it was—they could not
help but be persuaded to take action to end it. In other words, he sought to lever-
Downloaded from https://academic.oup.com/melus/advance-article/doi/10.1093/melus/mlab031/6408585 by guest on 15 December 2021
age panoptic views of race and racism to trigger the instauration of biopolitics—a
resetting of socioeconomic parameters that would help black communities flour-
ish in America and around the world.
Du Bois’s panoptic strategy in the data portraits had two primary goals and
modes. The first was to break down existing stereotypes using the analytic
mode. While analytic graphics are comparatively rare in the Paris collection,
they work powerfully in tandem with the albums of photos of black Americans
to “demonstrate the diversity, the plurality of what [Du Bois] called the
African American ‘type’” (Fisher 745). Under this heading belong plates 45
and 31, which parse out, sometimes minutely, black occupations, and plate 20,
one of the “patchwork” maps of Georgia showing the variation in black land own-
ership from county to county.12 These graphics seek to meet Calloway’s charge to
disrupt negative stereotypes of African Americans communicated to Europe via
the news media.
Second, once the negative stereotypes had been broken down for viewers, Du
Bois sought to replace them with positive ones. As Fisher notes, the Hampton
photographs obviously serve this purpose, but the data portraits presented Du
Bois with a challenge in this light: while a photograph of a beautiful and dignified
person can effectively epitomize a community, data portraits are too abstract.
Nevertheless, Fisher argues that Du Bois’s striking designs constructed positive
stereotypes of black communities by serving as vivid metaphors for their lived
experience:
[B]y presenting various sorts of imagery that constitute condensed data (processed
after the collection of “observable facts” regarding the realities of black life in the
United States), Du Bois actually presents a collection of signs that stand in for—
serve as hypostases of—black subjectivity. Thus, these signs (which we might
also think of as “citations” of black social reality) are useful metaphoric represen-
tations in the discourse on black history that Du Bois works to construct. (744)
As he sought the best techniques for constructing his synoptic visual metaphors
for the black condition and racism, Du Bois turned to the striking forms and bril-
liant coloration of Walker’s Statistical Atlas graphics. The graphics Du Bois con-
structed on these models were beautiful, synoptic bodies of color and line
sculpted from reams of diverse and recalcitrant data. They aimed to replace
amorphous, negative ideas of black socioeconomic status, citizenship, and hu-
manity with clearly delineated, memorable visual stereotypes. We consider a
few key examples of both analytic and synoptic modes in the data portraits before
returning to the question of what Du Bois’s panopticism at the Paris Exposition
contributed to his political projects.
12Techniques of Justice
Analytic Graphics
One strategy for beating back popular stereotypes and the bad scientific typology
Downloaded from https://academic.oup.com/melus/advance-article/doi/10.1093/melus/mlab031/6408585 by guest on 15 December 2021
on display at the world fairs was to deploy the analytic mode, breaking out an
account of who a black American was into a granular display of more particular
data that demanded new forms of reckoning. Unlike many of the other data vis-
ualizations, the analytic images are not models of visual efficiency and are cer-
tainly less eye-catching than, say, the “black wave” of plate 54 (see figs. 1b and
5) or the “saw blade” of plate 22 (see fig. 6a). We see the rhetorical logic of visual
inefficiency in Du Bois’s description of the professions, however: if visual effi-
ciency allows for the easy digestion of information, visual inefficiency trips the
viewer up, making “the eye to pass now up and now down from side to side of
a page,” in Walker’s words (2), prompting the gaze to linger and the mind to
make sense of visual excesses and disturbances. Whereas plate 27,
“Occupations of Negroes and Whites in Georgia,” is notable for, as Munro
puts it, being “one of the most visually economical designs in the Georgia study”
(90; see fig. 2a), plate 45, which also considers the occupations of black
Americans, is anything but economical (see fig. 2b). Plate 45, “Occupations in
which 10,000 or more American Negroes are engaged,” is a bar chart notable
for its long tail.
While plate 27 only engages five broad employment categories—Agriculture,
Fishing, and Mining; Manufacturing and Mechanical Industries; Domestic and
Personal Service; Professions; and Trade and Transportation—the latter visual-
ization displays nineteen. However, fourteen of these, including carpenters,
Fig. 2. (a) Plate 27, “Occupations of Negroes and Whites in Georgia”; (b) Plate 45, “Occupations in
which 10,000 or more American Negroes are engaged,” The Georgia Negro: a Social Study.
13Fusco and Olman
teachers, seamstresses, and clergy, have a very small proportion of laborers com-
pared to the significantly more populous categories of farmers and servants.
Essentially, plate 45 takes the category “Professions” from the more economical
Downloaded from https://academic.oup.com/melus/advance-article/doi/10.1093/melus/mlab031/6408585 by guest on 15 December 2021
plate 27 and cracks it open into a visually inefficient but rhetorically effective long
tail, which, in its lack of synoptic visual ease, makes disproportionate visual space
(literally) for the skilled professions among black Americans. This space makes
an argument for the professionalization of the black community, inviting black
viewers to locate themselves in this skilled space while impressing on white view-
ers the sheer range of black expertise.
Making information about black Americans less easy to view, identify, and file
away might be understood as a visual rhetorical answer to the problem expressed
by Calloway in his review of the Exhibit for the Colored American, in which he
expressed concern that Europeans visiting the exhibit would have imbibed the
stereotypical view of African Americans as a “mass of rapists” (“American” 2).
The work of the analytic mode is to enmesh the viewer in granularity in order
to slow down viewing, to confuse and disorient to some degree, at least ini-
tially—a disorientation that should give way to a deeper understanding of the vi-
sualized situation. In this way, analytic graphics such as plate 45 and others
literally visually dismantle negative stereotypes about black life via the explora-
tion of contrary facts. For, if the racist stereotype is a bad version of summation,
the analytic mode offers an epistemic counter in the form of elaboration.
Plate 32, which accompanies the more visually arresting plate 31, takes this
analytic approach to the black professional class to an even more granular and
particularizing level. Plate 31, “Income and Expenditure of 150 Negro Families
in Atlanta, G.A., U.S.A.,” is remarkably detailed and complex (see fig. 3). The elab-
orately illustrated bar chart renders in black, pink, purple, and shades of blue the
relative proportion of household income spent across the categories of rent, food,
clothes, taxes, and other expenses as delineated by economic class. Among the
chart’s various decorations, two well-dressed figures appear in photographed
portraits at the top of the page, standing as representative examples of respectable
black life. While these figures and, to some degree, the bar chart itself operate in
the synoptic mode of offering a quickly digestible counter-stereotype to negative
views of black Americans, Du Bois’s follow up graphic frustrates the idea of black
life as something that might be quickly consumed and understood. At the bottom
of the image, the plate invites the viewer to even deeper study: “For further sta-
tistics, raise this frame.” The plate that follows breaks down the prior plate in an-
alytic mode, offering data of the sort that figures into the construction of the more
synoptic bar charts of the previous page. While the photos of plate 31 offer rep-
resentative characters for the story of black home economics, plate 32, “Family
Budgets,” elaborates the story with specific expenses by giving sample family
budgets for eight professions (see fig. 4).
14Techniques of Justice
Downloaded from https://academic.oup.com/melus/advance-article/doi/10.1093/melus/mlab031/6408585 by guest on 15 December 2021
Fig. 3. Plate 31, “Income and Expenditure of 150 Negro Families in Atlanta, GA, USA,” The Georgia
Negro: a Social Study.
The information given in plate 32 about the rock mason’s wages is replicated
in the synoptic bar chart, but a story also emerges that feels refreshingly idiosyn-
cratic and personal, as the budget reveals that the family spent equal amounts on
“physician and medicine” and “church and societies” in a given year, with
twenty-five dollars appearing in each category. In contrast, the fireman and engi-
neer’s family spent only ten dollars in the category of “physician and medicine.”
Both families fit into the same category in the bar chart of plate 31, categorized by
Du Bois as doing “fair” with an annual income of $300–$400. With plate 32, how-
ever, the viewer acquires the texture of the individual family lives in each category
and can compare his or her own household budget to that of the mason or that of
the painter. The broken-out analytic details of the family budgets offer imagina-
tive room for play, both because these data points suggest an individual figure
rather than an aggregate and because the viewer may imagine themselves as a
comparative point of data. As a result, the perspective offered in the bumpier
and less economical graphics may be more humanist than the smoothed-out syn-
optic view of the Paris data portraits that have garnered contemporary notice for
their visual appeal.
Less stunning in their visual economy than the majority of the Paris
Exhibition’s data visualizations, these more analytic graphics served an important
function in Du Bois’s overall display. Alongside images of representative men and
15Fusco and Olman
Downloaded from https://academic.oup.com/melus/advance-article/doi/10.1093/melus/mlab031/6408585 by guest on 15 December 2021
Fig. 4. Detail from plate 32, “Family Budgets,” The Georgia Negro: a Social Study.
women, including great race leaders, and supplementing the synoptic views of
Blackness, the analytic graphics offer a view much closer to on-the-ground expe-
rience. White spectators are challenged to recognize the similarity between them-
selves and the black Americans depicted in terms of a shared profession or a
familiar line item in a family budget. In addition to offering opportunities for
cross-racial identification, the analytic mode in the data visualizations makes
an epistemological argument that offers greater agency to black subjects by en-
couraging them to locate themselves in the depiction of their community
(Barton and Barton 153)—for example, on a particular state on the map, or in
the tally of a particular profession—and then calculating how they contribute
to the whole picture in this capacity and how the picture might change if they
16Techniques of Justice
changed how much they spent, where they lived, or what they did for work. While
stereotypes form a kind of knowledge shorthand, by peppering his more efficient
synoptic graphics with moments in the analytic register, Du Bois helps viewers
Downloaded from https://academic.oup.com/melus/advance-article/doi/10.1093/melus/mlab031/6408585 by guest on 15 December 2021
slow down the process of interpellating themselves or others within totalizing
visual-racial regimes even as he seeks to produce some of his own.
Synoptic Graphics
The majority of data portraits in the Paris Exposition collection are synoptic,
designed to communicate a relatively simple argument—mainly about the
growth/preponderance or decline/minority of some aspect of black life and
how it was correlated with either Reconstruction or Jim Crow socioeconomic pol-
icies. A signal example of a synoptic data portrait is plate 54; Du Bois himself sin-
gles it out for mention in his retrospective report on the Exposition for the
American Monthly Review of Reviews, claiming that “At a glance one can see
the successive steps by which the 220,000 Negroes of 1750 had increased to
7,500,000 in 1890” (“American” 576). Plate 54 not only visualizes this increase
but also the growing percentage of Americans of mixed black and white parentage
(see fig. 5).
The obvious synoptic impression here, struck by a black anvil of ink, is of a
rapid growth in the black population, particularly during Reconstruction, and
the comparatively minor growth in mixed-race populations. The argument seems
clear that given more humane socioeconomic conditions, black communities
flourish, and miscegenation—the ever-present fear of Southerners, refreshed
by post-Reconstruction “one drop” legislation—remains rare.13 Du Bois achieves
this striking synoptic argument largely by leaving the growth in the white popu-
lation during this time out of the frame, a design choice that visually exaggerates
both the percentage and the rate of growth of the black population. The resulting
visual stereotype is one of black strength and dominance in the United States.
The “black wave” synoptic argument of plate 54 is easy to infer even with lim-
ited visual or verbal literacy. Other data portraits require more background
knowledge and education to decode. For example, plate 22 immediately draws
the eye with its vivid concentric circles and jagged labels. Visually, the impression
is of beauty and symmetry but also of violence, with the red dagger stabbing at the
black heart of the graphic. The argument, however, is more complex to assemble,
involving a sharp decline in the rate of black property acquisition following the
rolling back of Reconstruction policies in Georgia (see figs. 6a and 6b).
As noted in the caption to fig. 6 above, the model for this graphic was almost
certainly plate LI from Walker’s 1870 atlas, which employed the novel technique,
at the time, of depicting increase in certain population sectors circumferentially
rather than radially, as was more common for the period (for example, Florence
17Fusco and Olman
Downloaded from https://academic.oup.com/melus/advance-article/doi/10.1093/melus/mlab031/6408585 by guest on 15 December 2021
Fig. 5. Plate 54, “The Amalgamation of the White and Black Elements of the United States,” A Series of
Statistical Charts.
Nightingale’s rose diagrams of seasonal mortality in the Crimean War).14
However, as is obvious from comparing the plates above, Du Bois significantly
innovated on Walker’s designs throughout the Paris series. In plate 22, these
innovations include date range, color, and label style. Technically, Du Bois’s labels
introduce what Edward Tufte has called a “lie factor” (57), as they add visual bulk
to the rings they purport merely to label. However, it is through these exaggera-
tions that Du Bois dramatizes the injury that Jim Crow policies are striking into
the very heart of black progress in the state of Georgia.
These and the many other synoptic graphics in the Exposition collection are
crucial to Du Bois’s stated aim to “picture present conditions” (“American”
18Techniques of Justice
Downloaded from https://academic.oup.com/melus/advance-article/doi/10.1093/melus/mlab031/6408585 by guest on 15 December 2021
Fig. 6. (a) Plate 22, “Assessed Valuation of All Taxable Property Owned by Georgia Negroes,” The
Georgia Negro: a Social Study; (b) Plate LI, “III. Comparative View of the Increase in the Number of
the Blind between 1860 and 1870 [detail],” Walker, Statistical Atlas of the United States.
576) in a way that would achieve “reform and uplift” (Dusk 26). First, they realize
Du Bois’s project of universalizing the black condition in America as a synecdoche
for the devastating global drama of race and socioeconomic policy. The data por-
traits sometimes achieve this goal more literally, through the use of global maps
such as the one in the famous “color-line” graphic (plate 42). Other times, they
achieve the goal abstractly, via the disorienting spiral of plate 52 that shows black
communities trapped in rural labor, or the “black wave” of plate 54. Second, after
the analytic graphics have broken down old stereotypes about black identity and
agency, the data portraits construct new visual stereotypes, abstract but as vivid
and memorable as a face—a new iconography of “reproductive powers,”
“education,” “development,” “progress,” and “prospects” (“American” 576).
As Foucault and the scholars following him have pointed out, however, there is
a danger inherent in the synoptic mode that threatens to work at cross-purposes
to Du Bois’s project: its tendency to disable viewers, particularly subaltern view-
ers, from believing they have any agency to change the racial dynamics being vi-
sualized. Du Bois’s solution to this dilemma traded on the hegemonic authority
attributed to the creator of the synoptic view—that is, the one who can see the
whole problem at a glance is the one who has the power to solve it. By coopting
this power for himself and the Talented Tenth of the American black elite, Du Bois
hoped to shift the balance of racial power in America and the rest of the world.
19Fusco and Olman
Conclusion: Panopticism, Biopolitics, and the Talented Tenth
As we have seen, Du Bois used panoptic practices of seeing to achieve his goals of
Downloaded from https://academic.oup.com/melus/advance-article/doi/10.1093/melus/mlab031/6408585 by guest on 15 December 2021
“reform and uplift” around the issue of race at the Paris Exposition. First, he con-
structed a series of analytic graphics designed to break down existing stereotypes
about black Americans. Then, he created a new set of visually striking, abstract,
synoptic graphics designed to function as new stereotypes of black identity and
progress. Yet how does this effort connect with Du Bois’s larger political projects?
Focusing on the politics of panopticism is key to answering this question. As
discussed above, panopticism is part and parcel of biopolitical control—the cre-
ation of “populations” out of individuals and the manipulation of those popula-
tions by means of statistics, policies, and laws. Du Bois is enthusiastic about this
approach initially when he sets out to change racism from the top down, so to
speak, by assembling data on the black experience into synoptic trends, which
he presented to powerful white viewers in the Philadelphia Negro, at the Paris
Exposition, and in his Bureau of Labor Statistics studies, in hopes that they would
incite policy change (Morris 67–68). However, as he came to realize that racism
was inherent in sociology itself—in the framing of questions, the elimination of
certain populations, the funding of projects, and the gatekeeping involved in pub-
lication—he gave up on scientific panopticism and shifted explicitly to propa-
ganda as a strategy, starting with the Niagara Movement declaration of 1905
and continuing into his editorship at The Crisis, where he used black art and black
faces to generate new stereotypes of black excellence.
Indeed, a brief look at the remarkable covers of The Crisis demonstrates the
degree to which the modes of thinking Du Bois developed in the data portraits
continued into his later career. Just as the propagandistic, or at least rhetorical,
impulse of the later Du Bois was already on display at the Paris Exposition, so,
too, did the visual experiments with analytic and synoptic ways of seeing live
on in Du Bois’s editorship, whether in the magazine’s function as a clearinghouse
for pieces of information from around the nation in the regular “Along the Color
Line” column or the semi-synoptic move of including photographs of business-
men and graduates to stand as racial ideals. As Donal Harris argues, “the over-
riding preoccupation of The Crisis was ‘how to represent racialized bodies’” (69).
Harris’s emphasis on the how of representation accords very much with our read-
ing of Du Bois’s synoptic project. As we have argued, Du Bois sought not only to
replace stereotypical images of black Americans with more photorealistic racial
representatives but also to introduce a whole new form of stereotypes: new signs
and symbols that might economically and efficiently tell the story of the race.
However, such a project is not without its problems, as the synoptic view offers
a totalizing and complete image that the population rendered might find alienat-
ing and problematic. Indeed, we see this response to some of The Crisis covers. As
Harris documents, readers of The Crisis often wrote back to the editor, sometimes
20You can also read