An ALMA survey of the SCUBA-2 CLS UDS field: Physical properties of 707 Sub-millimetre Galaxies - arXiv.org
←
→
Page content transcription
If your browser does not render page correctly, please read the page content below
MNRAS 000, 1–33 (2020) Preprint 22 October 2020 Compiled using MNRAS LATEX style file v3.0

 An ALMA survey of the SCUBA-2 CLS UDS field: Physical
 properties of 707 Sub-millimetre Galaxies

 U. Dudzevičiūtė1★ , Ian Smail1 , A. M. Swinbank1 , S. M. Stach1 , O. Almaini2 ,
 E. da Cunha3,4,5 , Fang Xia An6 , V. Arumugam7 , J. Birkin1 , A. W. Blain8 ,
 S. C. Chapman9 , C.-C. Chen10 , C. J. Conselice2 , K. E. K. Coppin11 , J. S. Dunlop12 ,
 D. Farrah13,14 , J. E. Geach11 , B. Gullberg1 , W. G. Hartley15 , J. A. Hodge16 ,
arXiv:1910.07524v2 [astro-ph.GA] 21 Oct 2020

 R. J. Ivison10,12 , D. T. Maltby2 , D. Scott17 , C. J. Simpson18 , J. M. Simpson1 ,
 A.
 1
 P. Thomson19 , F. Walter20 , J. L. Wardlow21 , A. Weiss22 , P. van der Werf16
 Centre for Extragalactic Astronomy, Department of Physics, Durham University, South Road, Durham DH1 3LE, UK
 2 School of Physics and Astronomy, University of Nottingham, University Park, Nottingham, NG7 2RD, UK
 3 International Centre for Radio Astronomy Research, University of Western Australia, 35 Stirling Hwy, Crawley, WA 6009, Australia
 4 Research School of Astronomy and Astrophysics, The Australian National University, Canberra, ACT 2611, Australia
 5 ARC Centre of Excellence for All Sky Astrophysics in 3 Dimensions (ASTRO 3D)
 6 Department of Physics and Astronomy, University of the Western Cape, Robert Sobukwe Road, 7535, South Africa
 7 Institut de Radioastronomie Millimétrique, 300 rue de la Piscine, Domaine Universitaire, 38406 Saint Martin d’Hères, France
 8 Department of Physics and Astronomy, University of Leicester,University Road, Leicester LE1 7RH, UK
 9 Department of Physics and Atmospheric Science, Dalhousie University Halifax, NS B3H 3J5, Canada
 10 European Southern Observatory, Karl Schwarzschild Strasse 2, Garching, Germany
 11 Centre for Astrophysics Research, School of Physics, Astronomy and Mathematics, University of Hertfordshire, Hatfield AL10 9AB, UK
 12 Institute for Astronomy, University of Edinburgh, Royal Observatory, Blackford Hill, Edinburgh EH9 3HJ, UK
 13 Department of Physics and Astronomy, University of Hawaii, 2505 Correa Road, Honolulu, HI 96822, USA
 14 Institute for Astronomy, 2680 Woodlawn Drive, University of Hawaii, Honolulu, HI 96822, USA
 15 Department of Physics and Astronomy, University College London, Gower Street, London WC1E 6BT
 16 Leiden Observatory, Leiden University, P.O. box 9513, NL-2300 RA Leiden, The Netherlands
 17 Department of Physics and Astronomy, University of British Columbia, 6224 Agricultural Road, Vancouver, BC V6T 1Z1, Canada
 18 Gemini Observatory, Hilo, HI 96720, USA
 19 The University of Manchester, Oxford Road, Manchester, M13 9PL, UK
 20 Max-Planck-Institut für Astronomy, Königstuhl 17, 69117 Heidelberg, Germany
 21 Department of Physics, Lancaster University, Lancaster, LA1 4YB, UK
 22 Max-Planck-Institut für Radioastronomie, Auf dem Hügel 69 D-53121 Bonn, Germany

 Accepted 2020 March 11. Received 2020 March 11; in original form 2019 September 30

 ABSTRACT
 We analyse the physical properties of a large, homogeneously selected sample of ALMA-
 located sub-millimetre galaxies (SMGs). This survey, AS2UDS, identified 707 SMGs across
 the ∼ 1 deg2 field, including ∼ 17 per cent which are undetected at & 25.7 mag. We interpret
 their UV-to-radio data using magphys and determine a median redshift of = 2.61 ± 0.08 (1-
 range of = 1.8–3.4) with just ∼ 6 per cent at > 4. Our survey provides a sample of massive
 dusty galaxies at & 1, with median dust and stellar masses of d = (6.8 ± 0.3) × 108 M
 (thus, gas masses of ∼ 1011 M ) and ∗ = (1.26 ± 0.05) × 1011 M . We find no evolution in
 dust temperature at a constant far-infrared luminosity across ∼ 1.5–4. The gas mass function
 of our sample increases to ∼ 2–3 and then declines at > 3. The space density and masses
 of SMGs suggest that almost all galaxies with ∗ & 3 × 10¹¹ M have passed through an
 SMG-like phase. The redshift distribution is well fit by a model combining evolution of the
 gas fraction in halos with the growth of halo mass past a critical threshold of h ∼ 6 ×10¹² M ,
 thus SMGs may represent the highly efficient collapse of gas-rich massive halos. We show that
 SMGs are broadly consistent with simple homologous systems in the far-infrared, consistent
 with a centrally illuminated starburst. Our study provides strong support for an evolutionary
 link between the active, gas-rich SMG population at > 1 and the formation of massive,
 bulge-dominated galaxies across the history of the Universe.
 Key words: sub-millimetre: galaxies – galaxies: high-redshift – galaxies: starburst

 © 2020 The Authors
2 Dudzevičiūtė et al.
1 INTRODUCTION systems are a non-negligible component of the star-forming pop-
 ulation at high redshift. Very wide-field surveys with the SPIRE
Analysis of the relative brightness of the extragalactic background in instrument on Herschel have traced this dusty luminous population,
the UV/optical and far-infrared/sub-millimetre suggest that around using very large samples, to lower redshifts and lower far-infrared
half of all of the star formation that has occurred over the history of luminosities (e.g. Bourne et al. 2016). However, the modest angular
the Universe was obscured by dust (e.g. Puget et al. 1996). This far- resolution of Herschel/SPIRE and resulting bright confusion limit,
infrared/sub-millimetre emission is expected to primarily comprise at longer far-infrared wavelengths limits its ability to select all but
the reprocessing of UV emission from young, massive stars by dust the very brightest (unlensed) sources at the era of peak activity in
grains in the interstellar medium (ISM) of distant galaxies, which is the obscured population at & 1–2 (Symeonidis et al. 2011). Such
re-emitted in the form of far-infrared/sub-millimetre photons as the low-resolution far-infrared-selected samples are also more challeng-
grains cool. Understanding the nature, origin, and evolution of this ing to analyse owing to the ambiguities in source identification that
dust-obscured activity in galaxies is therefore crucial for obtaining results from ground-based follow-up to locate counterparts, which
a complete understanding of their formation and growth (see Casey is necessarily undertaken at longer wavelengths than the original
et al. 2014 for a review). far-infrared selection.
 In the local Universe, the most dust-obscured galaxies are also With such high star-formation rates, SMGs can rapidly increase
some of the most actively star-forming systems: ultra-luminous their (apparently already significant) stellar masses on a timescale
infrared galaxies (ULIRGs; Sanders & Mirabel 1996) with star- of just ∼ 100 Myr (e.g. Bothwell et al. 2013). High star-formation
formation rates of & 100 M yr−1 . These radiate & 95 per cent of rates and high stellar masses of this population, along with the high
their bolometric luminosity in the mid-/far-infrared as a result of metallicities suggested by the significant dust content, have there-
strong dust obscuration of their star-forming regions. These galax- fore been used to argue that they may be an important phase in
ies have relatively faint luminosities in UV/optical wavebands, but the formation of the stellar content of the most massive galaxies in
far-infrared luminosities of IR ≥ 1012 L and hence they are most the Universe, being the progenitors of local luminous spheroids and
easily identified locally through surveys in the far-infrared waveband elliptical galaxies (Lilly et al. 1999; Chapman et al. 2005; Simpson
(e.g. IRAS 60 m). It has been suggested that the high star-formation et al. 2014). There have also been suggestions of an evolutionary link
rates of ULIRGs arise from the concentration of massive molecular with quasi-stellar objects (QSOs) (e.g. Swinbank et al. 2006; Wall
gas reservoirs (and thus, high ISM densities and strong dust absorp- et al. 2008; Simpson et al. 2012; Hickox et al. 2012) due to the sim-
tion) in galaxies that are undergoing tidal interactions as a result of ilarities in their redshift distributions. More recently these systems
mergers (Sanders et al. 1988). have been potentially linked to the formation of compact quies-
 The far-infrared (&100 m) spectral energy distribution (SED) cent galaxies seen at ∼ 1–2 (e.g. Whitaker et al. 2012; Simpson
of the dust-reprocessed emission from ULIRGs can be roughly et al. 2014; Toft et al. 2014) as a result of their short gas depletion
approximated by a modified blackbody. The rapid decline in the timescales. This connection has been strengthened by recent ob-
brightness of the source at wavelengths beyond the SED peak on servations in the rest-frame far-infrared that suggest very compact
the Rayleigh-Jeans tail creates a strong negative -correction for extents of the star-forming regions (Toft et al. 2014; Ikarashi et al.
observations of this population at high redshifts (Franceschini et al. 2015; Simpson et al. 2015a; Gullberg et al. 2019). Thus several
1991; Blain & Longair 1993). Hence, a dusty galaxy with a fixed lines of evidence suggest that SMGs are an important element for
far-infrared luminosity and temperature will have an almost constant constraining the models of massive galaxy formation and evolution.
apparent flux density in the sub-millimetre waveband (which traces The pace of progress of our understanding of the nature and
rest-frame emission beyond the redshifted peak of the SED) from properties of the SMG population has accelerated in the last five
 ∼ 1 to ∼ 7 (see Casey et al. 2014). As a result, surveys in the sub- years, owing to the commissioning of the Atacama Large Mil-
millimetre waveband in principle allow us to construct luminosity- limetre/Submillimetre Telescope (ALMA). ALMA has enabled
limited samples of obscured, star-forming galaxies over a very wide high-sensitivity ( 1 mJy rms) and high-angular-resolution (. 1 00
range of cosmic time, spanning the expected peak activity in galaxy FWHM) observations in the sub-/millimetre wavebands of samples
formation at & 1–3 (e.g. Chapman et al. 2005; Casey et al. 2012; of dust-obscured galaxies at high redshifts, including SMGs. In the
Weiß et al. 2013; Simpson et al. 2014; Brisbin et al. 2017; Strandet first few years of operations, ALMA has been used to undertake
et al. 2016). a number of typically deep continuum surveys of small contigu-
 Sub-millimetre galaxies (SMGs) with 850- m flux densities ous fields (Walter et al. 2016; Hatsukade et al. 2016; Dunlop et al.
of 850 & 1–10 mJy were first uncovered over 20 years ago using 2017; Umehata et al. 2018; Hatsukade et al. 2018; Franco et al. 2018;
the atmospheric window around 850- m with the SCUBA instru- Muñoz Arancibia et al. 2018), with areas of 10s of arcmin2 (includ-
ment on the James Clerk Maxwell Telescope (JCMT) (Smail et al. ing lensing clusters and proto-cluster regions). These small field
1997; Barger et al. 1998; Hughes et al. 1998; Eales et al. 1999). studies typically contain sources at flux limits of 870 ' 0.1–1 mJy
Subsequent studies have suggested they represent a population of (corresponding to star-formation rates of ∼ 10–100 M yr−1 or far-
particularly dusty, high-infrared luminosity systems (> 1012 L ) infrared luminosities of ∼ (0.5–5)×1011 L ) and so provide a valu-
that are typically found at high redshift ( ∼ 1–4). They have large able link between the bright SMGs seen in the panoramic single-dish
gas reservoirs (Frayer et al. 1998; Greve et al. 2005; Bothwell et al. surveys and the populations of typically less-actively star-forming
2013), stellar masses of the order of 1011 M and can reach very galaxies studied in UV/optical-selected surveys. However, owing
high star-formation rates up to (and in some cases in excess of) to their small areas they do not contain more than a few exam-
∼ 1,000 M yr−1 . SMGs have some observational properties that ples of the brighter SMGs. To efficiently study the brighter sources
appear similar to those of local ULIRGs, such as high far-infrared requires targeted follow-up of sources from panoramic single-dish
luminosities and star-formation rates; however, their space densities surveys. Hence, ALMA has also been employed to study the dust
are a factor of ∼ 1,000 × higher than the comparably luminous local continuum emission from samples of . 100 SMGs selected from
population (e.g. Smail et al. 1997; Chapman et al. 2005; Simpson single-dish surveys at 870 or 1100 m (e.g. Hodge et al. 2013; Bris-
et al. 2014). Thus, in contrast to the local Universe, these luminous bin et al. 2017; Cowie et al. 2018). The primary goal of these studies

 MNRAS 000, 1–33 (2020)
Physical properties of SMGs from AS2UDS 3
has been to first precisely locate the galaxy or galaxies responsible 2019) and to understand the influence of selection biases on our
for the sub-millimetre emission in the (low-resolution) single-dish results and the conclusions of previous studies. With a statistically
source and to then understand their properties (e.g. Simpson et al. well-constrained and complete understanding of their redshift dis-
2014; Brisbin et al. 2017). tribution and physical properties, we are able to address what place
 The first ALMA follow-up of a single-dish sub/millimetre sur- the SMG phase takes in the evolution of massive galaxies. Through
vey was the ALESS survey (Karim et al. 2013; Hodge et al. 2013) our paper, we compare our results to samples of both local ULIRGs
of a sample of 122 sources with 870 ≥ 3.5 mJy selected from the and near-infrared selected high-redshift field galaxies, which we
0.25 deg2 LABOCA 870- m map of the Extended Chandra Deep analyse in a consistent manner to our SMG sample to avoid any
Field South (ECDFS) by Weiß et al. (2009). The multi-wavelength systematic uncertainties affecting our conclusions.
properties of 99 SMGs from the robust main sample were analysed Our paper is structured as follows. In §2 we describe the
using the magphys SED modelling code by da Cunha et al. (2015) multi-wavelength observations of the AS2UDS SMGs. In §3 we
(see also the magphys analysis of a similar-sized sample of 1.1-mm describe the SED fitting procedure using magphys and test its ro-
selected SMGs in the COSMOS field by Miettinen et al. 2017). bustness. We present the results including the redshift distribution,
This approach of using a single consistent approach to model the multi-wavelength properties and evolutionary trends of the whole
UV/optical and far-infrared emission provides several significant AS2UDS SMG population in §4. We discuss the implications of our
benefits for these dusty and typically very faint galaxies, over pre- results in §5 and present our conclusions in §6. Unless stated other-
vious approaches of independently modelling the UV/optical and wise, we use ΛCDM cosmology with with 0 = 70 km s−1 Mpc−1 ,
far-infrared emission (e.g. Clements et al. 2008; Cowie et al. 2018). ΩΛ = 0.7, Ω = 0.3. The AB photometric magnitude system is used
In particular, the use in magphys of an approximate energy bal- throughout.
ance formulation between the energy absorbed by dust from the
UV/optical and that re-emitted in the far-infrared provides more
reliable constraints on the photometric redshifts for the SMGs (e.g.
da Cunha et al. 2015; Miettinen et al. 2017). This is particularly
critical in order to derive complete and unbiased redshift distribu-
tions for flux-limited samples of SMGs, as ∼ 20 per cent of SMGs 2 OBSERVATIONS AND SAMPLE SELECTION
are typically too faint to be detected at wavelengths shortward of
the near-infrared (e.g. Simpson et al. 2014; Franco et al. 2018) and In this section, we describe the multi-wavelength photometric data
hence are frequently missing from such analyses. The energy bal- we use to derive the SED from the UV-to-radio wavelengths for
ance coupling is also expected to improve the derivation of physical each galaxy in our sample. From these SEDs, we aim to derive
properties of these optically faint systems, such as stellar masses and the physical properties of each SMG (such as their photometric
dust attenuation, which are otherwise typically poorly constrained redshift, star-formation rate, stellar, dust and gas masses). To aid
(Hainline et al. 2011; Dunlop 2011). the interpretation of our results, we also exploit the ∼ 300,000 -
 While the studies by da Cunha et al. (2015) and Miettinen selected field galaxies in the UKIDSS UDS (Almaini et al. in prep.).
et al. (2017) have provided improved constraints on the physical We measure the photometry and SEDs for the field galaxies and
parameters of samples of ∼ 100 SMGs, the modest size of these SMGs in a consistent manner and describe the sources of these data
samples does not allow for robust analysis of the evolutionary trends and any new photometric measurements below.
in these parameters within the population (da Cunha et al. 2015),
or to study sub-sets of SMGs, such as the highest-redshift exam-
ples (Coppin et al. 2009; Swinbank et al. 2012) or those that show
signatures of both star-formation and AGN activity (Wang et al.
 2.1 ALMA
2013). To fully characterize the population of SMGs and interpret
their role in the overall galaxy evolution requires a large, homo- A detailed description of the ALMA observations, data reduction
geneously selected sample with precisely located sub-millimetre and construction of the catalogue for the SMGs in our sample can
emission from sub/millimetre interferometers. We have therefore be found in Stach et al. (2019). Briefly, the AS2UDS (defined in
just completed an ALMA study of a complete sample of 716 single- §1) comprises an ALMA follow-up survey of a complete sample of
dish sources selected from the SCUBA-2 Cosmology Legacy Sur- 716 SCUBA-2 sources that are detected at > 4- ( 850 ≥ 3.6 mJy)
vey (S2CLS) 850- m map of the UKIDSS UDS field (S2CLS is in the S2CLS map of the UKIDSS UDS field (Geach et al. 2017).
presented in Geach et al. 2017). This targetted ALMA study – called The S2CLS map of the UDS covers an area of 0.96 deg2 with noise
AS2UDS (Stach et al. 2019) – used sensitive 870- m continuum level below 1.3 mJy and a median depth of 850 = 0.88 mJy beam−1 .
observations obtained in Cycles 1, 3, 4 and 5 to precisely locate All 716 SCUBA-2 sources detected in the map were observed in
(to within  0.1 00 ) 707 SMGs across the ∼ 0.9 deg2 S2CLS–UDS ALMA Band 7 (344 GHz or 870 m) between Cycles 1, 3, 4 and
field. AS2UDS provides the largest homogeneously-selected sam- 5 (a pilot study of 27 of the brightest sources observed in Cycle 1
ple of ALMA-identified SMGs currently available, ∼ 6 × larger than is discussed in Simpson et al. 2015b, 2017). Due to configuration
the largest existing ALMA surveys (Hodge et al. 2013; Miettinen changes between cycles, the spatial resolution of the data varies in
et al. 2017). range 0.15–0.5 00 FWHM, although all of the maps are tapered to
 In this paper, we construct the UV-to-radio SEDs of our sample 0.5 00 FWHM for detection purposes (see Stach et al. 2019, for de-
of 707 ALMA-identified SMGs from the AS2UDS survey using a tails). The final catalogue contains 708 individual ALMA-identified
physically motivated model, magphys (da Cunha et al. 2015; Battisti SMGs spanning 870 = 0.6–13.6 mJy (>4.3 ) corresponding to a 2
et al. 2019). We use the model to interpret the SEDs and so inves- per cent false-positive rate. We remove one bright, strongly lensed
tigate the rest-frame optical (stellar) and infrared (dust) properties source (Ikarashi et al. 2011) from our analysis and the remaining 707
of the SMGs. This sample allows us to both improve the statistics ALMA-identified SMGs are the focus of this study of the physical
to search for trends within the population (e.g. Stach et al. 2018, properties.

MNRAS 000, 1–33 (2020)
4 Dudzevičiūtė et al.
2.2 Optical and near-/mid-infrared imaging et al. (2018) (which have a median 870- m flux of 870 = 1.8 mJy)
 are brighter than = 24.4. Finally, Brisbin et al. (2017) identify
2.2.1 Optical -band to -band photometry
 optical counterparts to 97 / 152 (64 per cent) of ALMA-identified
At the typical redshift of SMGs, ∼ 2.5 (e.g. Chapman et al. SMGs from a Band 6 (1.2 mm) survey of AzTEC sources using
2005; Simpson et al. 2014; Danielson et al. 2017; Brisbin et al. the public COSMOS2015 catalogue (Laigle et al. 2016), which is
2017), the observed optical to mid-infrared corresponds to the rest- equivalent to . 24.7, for the deepest parts. Thus, our detection
frame UV/optical/near-infrared, which is dominated by the (dust- rate of 83 per cent of ALMA SMGs with -band counterparts
attenuated) stellar continuum emission, emission lines, and any pos- is consistent with previous surveys but also demonstrates that even
sible AGN emission. The rest-frame UV/optical/near-infrared also with extremely deep near-infrared imaging, a significant number (17
includes spectral features that are important for deriving photomet- per cent or 108 galaxies) are faint or undetected in the near-infrared
ric redshift, in particular, the photometric redshifts have sensitivity at ≥ 25.7.
to the Lyman break, Balmer and/or 4000Å break and, the (rest- Since SMGs are dominated by high redshift, dusty highly-
frame) 1.6- m stellar “bump”. starforming galaxies, their observed optical/near-infrared colours
 To measure the optical/near-infrared photometry for the galax- are typically red (e.g. Smail et al. 1999, 2004), and so the detec-
ies in the UDS, we exploit the panchromatic photometric coverage tion rate as a function of wavelength drops at shorter wavelengths,
of this field. In particular, we utilise the UKIRT Infrared Deep reaching just 26 per cent in the -band (Table 1). We will return
Sky Survey (UKIDSS: Lawrence et al. 2007) UDS data release 11 to a discussion of the detected fraction of SMGs as a function of
(UKIDSS DR11), which is a -band selected photometric cata- wavelength, their colours, and implications on derived quantities in
logue (Almaini et al., in prep.) covering an area of 0.8 deg2 with § 3.3.
a 3- point-source depth of = 25.7 mag (all photometry in this
section is measured in 2 00 diameter apertures and has been aperture
corrected, unless otherwise stated). This -band selected catalogue
has 296,007 sources, of which more than 90 per cent are flagged 2.2.2 Spitzer IRAC & MIPS observations
as galaxies with reliable -band photometry. For any subsequent
analysis, we restrict our analysis to 205,910 sources that have no Next, we turn to the mid-infrared coverage of the UDS, in partic-
contamination flags. The UKIDSS survey imaged the UDS field ular from Spitzer IRAC and MIPS observations. At these wave-
with the UKIRT WFCAM camera in , and bands and the lengths, the observed 3.6–8.0 m emission samples the rest-frame
DR11 catalogue also includes the matched photometry in - and near-infrared at the expected redshifts of the SMGs. These wave-
 -band to 3- depths of = 26.0 and = 25.5. lengths are less dominated by the youngest stellar populations, and
 In addition, -band photometry was also obtained from the significantly less affected by dust than the rest-frame optical or UV.
VISTA/VIDEO survey, which has a 3- depth of 25.1 mag and Observations of the UDS in the mid-infrared were taken with IRAC
 0 0 -band photometry was obtained from Subaru/Suprimecam onboard the Spitzer telescope as part of the Spitzer Legacy Program
imaging, which has 3- depths of 28.2, 27.6, 27.5, 27.5, and (SpUDS; PI: J. Dunlop).
26.4 mag, respectively. Finally, -band photometry of the UDS We obtained reduced SpUDS images of the UDS from the
field from the CFHT/Megacam survey is also included in the DR11 Spitzer Science Archive. These IRAC observations at 3.6, 4.5, 5.8
catalogue. This -band imaging reaches a 3- point-source depth and 8.0 m reach 3- depths of 23.5, 23.3, 22.3 and 22.4 mag, re-
of 27.1 mag. spectively. The astrometry of all four IRAC images was aligned
 To derive the photometry of the ALMA SMGs in the to the ALMA maps by stacking the IRAC thumbnails of the
optical/near-infrared, first, we align the astrometry between the ALMA positions of 707 AS2UDS sources and corrections in
UKIDSS DR11 catalogue with the ALMA astrometry by match- RA/Dec of (+0.00 00 , +0.15 00 ), (+0.08 00 ,+0.12 00 ), (+0.08 00 ,+0.00 00 )
ing the positions of the ALMA SMGs to the -band catalogue, and (+0.60 00 ,−0.08 00 ) were applied to the 3.6, 4.5, 5.8 and 8.0 m
identifying and removing an offset of ΔRA = 0.1 00 and ΔDec = 0.1 00 images, respectively. To measure the photometry, and minimise
in the -band. We find that 634/707 SMGs lie within the deep re- the effect of blending, we extract 2 00 -diameter aperture photometry
gions of the -band image, after excluding regions masked due to for all of the ALMA SMGs, as well as for all 205,910 galaxies
noisy edges, artefacts, and bright stars. The two catalogues are then in the UKIDSS DR11 catalogue, and calculate aperture correc-
matched using a radius of 0.6 00 (which has a false-match rate of tions to total magnitudes from point sources in the images. The
3.5 per cent; see An et al. 2018 for details). This results in 526/634 UKIDSS DR11 catalogue contains aperture-corrected magnitudes
SMGs with -band detections (83 per cent). We note that 43 of measured in the 3.6- and 4.5- m bands and we confirm our pho-
these sources are within a -band region flagged with possibly con- tometry at these wavelengths by comparing the respective magni-
taminated photometry; however, the inclusion of these sources in tudes, with relative offsets of just Δ[3.6] / [3.6]DR11 = 0.001+0.007 −0.005
our analysis does not change any of our conclusions of this study, and Δ[4.5] / [4.5]DR11 = 0.002+0.009
 −0.003
 .
thus we retain then and flag then in our catalogue. Due to the relatively large PSF of the IRAC images (typically
 Our detection fraction is comparable to, but slightly higher ∼ 2 00 FWHM), blending with nearby sources is a potential concern
than, the fraction identified in smaller samples of SMGs in other (see Fig. 1). We, therefore, identify all of the ALMA SMGs that
fields, which is likely due to the very deep near-infrared coverage have a second, nearby -band detected, galaxy within 2.5 00 and
available in the UDS. For example, in the ALMA survey of the calculate the possible level of contamination assuming that the flux
ECDFS, ALESS – Simpson et al. (2014) show that 61 / 99 (60 per ratio of the ALMA SMG and its neighbour is the same in the IRAC
cent) of the ALMA SMGs have -band counterparts to a limit of bands as observed in the higher-resolution -band images. This
 = 24.4. This is significantly lower than the detection rate in our is conservative as the SMGs are expected to be typically redder
UDS survey, although cutting our UDS catalogue at the same - than any contaminating field galaxies. For any ALMA SMG, if the
band limit as the ECDFS results in a detected fraction of 68 per cent. contamination from the nearby source is likely to be more than
Similarly, 65 per cent of the ALMA SMGs in the CDFS from Cowie 50 per cent of the total flux, the respective IRAC magnitudes are

 MNRAS 000, 1–33 (2020)
Physical properties of SMGs from AS2UDS 5

Figure 1. Examples of 100 of the AS2UDS ALMA-identified SMGs from our sample. The 2500 × 2500 (∼ 200-kpc square at their typical redshifts) colour images
are composed of , IRAC 3.6 m and IRAC 4.5 m bands with the ALMA position of the source given by the open cross. The sources are selected to be
representative of the near-infrared properties of the full sample: thumbnails are ranked in deciles of flux (each row) and deciles of phot within each flux range
(each column). We see that SMGs are in general redder than the neighbouring field galaxies. There is a weak trend for SMGs to become fainter and/or redder
with redshift, but there is no clear trend of observed properties with 870 flux density.

treated as 3- upper limits. This transformation of detected fluxes that is redshifted to & 3 m for an SMG at & 1. We will return to
into upper limits affects 109 sources. a discussion of the mid-infrared colours in § 2.4.

 From the photometry of the ALMA SMGs in the IRAC bands, To demonstrate the typically red colour of the SMGs (in partic-
we determine that 581 / 645 or 90 per cent of the SMGs covered ular compared to the foreground field galaxy population), in Fig. 1
by IRAC are detected at 3.6 m, or 73 per cent when we apply the we show colour images (composed of , IRAC 3.6- m and 4.5- m
conservative blending criterion from above. The increased fraction bands) for 100 representative AS2UDS SMGs ranked in terms of
of the sample that are detected in the IRAC bands, compared to 870 and photometric redshift (see § 4.1 for the determination of the
 -band, most likely reflects the (rest-frame) 1.6- m stellar “bump” photometric redshifts). This figure demonstrates that SMGs gener-

MNRAS 000, 1–33 (2020)
6 Dudzevičiūtė et al.

Table 1. Photometric coverage and detection fractions for AS2UDS SMGs 2018). At ∼ 2.5, the dust SED is expected to peak around an
in representative photometric bands. observed wavelength of 350 m (e.g. see Casey et al. 2014 for a
 review).
 Band covered detected %detected Depth (3- ) Due to the coarse resolution of the Herschel / SPIRE maps
 (∼ 18 00 , 25 00 and 36 00 FWHM at 250, 350 and 500 m, respectively),
 634 162 26 27.1 AB we need to account for the effect of source blending (Roseboom
 590 330 56 27.6 AB et al. 2012; Magnelli et al. 2013). We, therefore, follow the same
 634 526 83 25.7 AB procedure as Swinbank et al. (2014). Briefly, the ALMA SMGs,
 3.6 m 644 5801 902 23.5 AB together with Spitzer / MIPS 24- m and 1.4-GHz radio sources, are
 24 m 628 304 48 60 Jy used as positional priors in the deblending of the SPIRE maps. A
 350 m 707 417 59 8.0 mJy
 Monte Carlo algorithm is used to deblend the SPIRE maps by fitting
 1.4 GHz 705 272 39 18 Jy
 the observed flux distribution with beam-sized components at the
 position of a given source in the prior catalogue. To avoid “over-
1 Including 109 potentially contaminated sources (see §2.2.2) blending” the method is first applied to the 250- m data, and only
2 73% if excluding 109 potentially contaminated sources sources that are either (i) ALMA SMGs, or (ii) detected at > 2- at
Notes: covered – number of SMGs covered by imaging; detected – number 250- m are propagated to the prior list for the 350- m deblending.
of SMGs detected above 3- ; %detected – per centage of total sample Similarly, only the ALMA SMGs and/or those detected at > 2- at
detected.
 350 m are used to deblend the 500- m map. The uncertainties on
 the flux densities (and limits) are found by attempting to recover fake
ally have redder near-/mid-infrared colours than neighbouring field sources injected into the maps (see Swinbank et al. 2014 for details),
galaxies and also that on average higher-redshift SMGs are fainter and the typical 3- detection limits are 7.0, 8.0 and 10.6 mJy at
and/or redder in the near-infrared bands than low redshift ones for 250, 350 and 500 m respectively. The same method is applied to
each of the ALMA flux bins. We see no strong trends in observed the PACS 100- and 160- m imaging, with the final 3- depths of
properties with 870- m flux density in any redshift bin. 5.5 mJy at 100 m and 12.1 mJy at 160 m.
 Mid-infrared observations of the UDS were also taken at 24 m Given the selection of our sources at 870 m, the fraction of
with the Multiband Imaging Photometer (MIPS) on board Spitzer ALMA SMGs that are detected in the PACS and/or SPIRE bands
as part of SpUDS. The 24- m emission provides useful constraints is a strong function of 870- m flux density, but we note that 69
on the star formation and AGN content of bright SMGs since at the per cent (486/707) of the ALMA SMGs are detected in at least one
typical redshift of our sample, the filter samples continuum emission of the PACS or SPIRE bands. This will be important in § 4 when
from heated dust grains. This spectral region also includes broad deriving useful constraints on the far-infrared luminosities and dust
emission features associated with polycyclic aromatic hydrocarbons temperatures.
(PAHs) – the most prominent of which appear at rest-frame 6.2, In terms of the field galaxies, just 3.6 per cent of the -band
7.7, 8.6, 11.3, and 12.7 m, as well as absorption by amorphous sample have a MIPS 24- m counterpart, and of these only 2,396
silicates centred at 9.7 and 18 m (Pope et al. 2008; Menéndez- (out of a total of 205,910 galaxies in DR11) are detected at 250 m,
Delmestre et al. 2009). This MIPS 24- m imaging is also employed with 1,497 and 500 detected at 350 m and 500 m, respectively.
to provide a constraint on the positional prior catalogue that is used Thus the majority of the field population are not detected in the
to deblend the Herschel far-infrared maps (e.g. Roseboom et al. far-infrared (in contrast to the ALMA SMGs, where the majority of
2012; Magnelli et al. 2013; Swinbank et al. 2014). We obtained the galaxies are detected).
the reduced SpUDS / MIPS 24- m image from the NASA Infrared
Astronomy Archive. This imaging covers the entire UDS survey area
and reaches a 3- (aperture corrected) limit of 60 Jy. From the 24- 2.3.2 VLA 1.4 GHz Radio observations
 m image, we identify ∼ 35,000 sources, and cross-matching the Finally, we turn to radio wavelengths. Prior to ALMA, high-
>3- detections in the 24- m catalogue with our ALMA catalogue resolution (∼ 1 00 ) radio maps had often been employed to iden-
with a 2 00 matching radius, we determine that 48 per cent of the tify likely counterparts of single-dish sub-millimetre sources (e.g.
SMGs are detected. This detected fraction is also consistent with Ivison et al. 1998). Although the radio emission does not benefit
that of other fields with similar ALMA and MIPS coverage (e.g. 41 from the negative -correction experienced in the sub-millimetre
per cent in ALESS from Simpson et al. 2014). waveband, the lower-redshift ( . 2.5) ALMA SMGs tend to be
 detectable as Jy radio sources due to the strong correlation be-
 tween the non-thermal radio and far-infrared emission in galaxies
2.3 Far-infrared and Radio Imaging (e.g. Yun et al. 2001; Ivison et al. 2002, 2007; Vlahakis et al. 2007;
 Biggs et al. 2011; Hodge et al. 2013). The standard explanation
2.3.1 Herschel SPIRE & PACS observations
 of this relationship is that both the far-infrared emission and the
To measure reliable far-infrared luminosities for the ALMA SMGs, majority of the radio emission traces the same population of high-
we exploit observations using the Spectral and Photometric Imag- mass stars (& 5 M ). These stars both heat the dust (which then
ing Receiver (SPIRE) and the Photodetector Array Camera and emits far-infrared emission) and produce the relativistic electrons
Spectrometer (PACS) on board the Herschel Space Observatory. responsible for synchrotron radiation when they explode as super-
These observations were taken as part of the Herschel Multi-tiered novae (e.g. Helou et al. 1985; Condon 1992). However, the lack of
Extragalactic Survey (HerMES; Oliver et al. 2012) and cover the ob- a negative -correction in the radio waveband means that at higher
served wavelength range from 100–500 m. These wavelengths are redshifts ( & 2.5), where a large fraction of the SMGs lie, their
expected to span the dust-peak of the SED, which (in local ULIRGs) radio flux densities are often too faint to be detectable, for example,
peak around 100 m, corresponding to a characteristic dust temper- Hodge et al. (2013) show that up to 45 per cent of ALMA SMGs in
ature of d ' 35 K (e.g. Symeonidis et al. 2013; Clements et al. their ALESS survey are not detected at 1.4 GHz.

 MNRAS 000, 1–33 (2020)
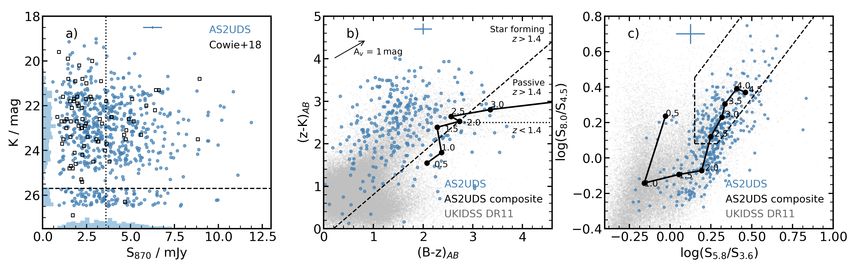
Physical properties of SMGs from AS2UDS 7

Figure 2. Distributions of observed magnitudes and colours of the SMGs from AS2UDS. (a) -band magnitude versus 870 flux density. The dashed line
shows the -band 3- limit of = 25.7 and the dotted line indicates the flux limit of the parent SCUBA-2 survey at 870 = 3.6 mJy. There are 526 -band
detections of SMGs and we plot the 108 limits scattered below the -band limit. The histograms show the -band magnitude distribution as the ordinate and
 870 flux density distribution as the abscissa. For comparison, we also show the Cowie et al. (2018) sample from CDFS, which covers a similar parameter
range. No strong correlation of 870- m flux density and -band magnitude is observed, but we highlight that we see a two order of magnitude range in -band
brightness at a fixed 870- m flux density. (b) ( − ) versus ( − ) colour-colour diagram for 290 SMGs with detections in all three bands and the
classification regions. We stress that these are typically the brighter and bluer examples and so are not representative of the full population. The placement of
the sources on the diagram suggests that the majority (253/290) of these SMGs are high-redshift star-forming galaxies, most of which are significantly redder
than the field population. The reddening vector for one magnitude of extinction in the -band is plotted in the top left. The solid line shows the track predicted
by the composite SMG SED track at increasing redshift (labelled). We see that the average colours of SMGs lies close to the classification boundary and so it
is likely that fainter and redder SMGs would be misclassified using the colours. (c) IRAC colour-colour diagram for 388 SMGs detected in all four IRAC
bands. The dashed line indicates the IRAC colour criteria for AGN selection (up to a redshift of ∼ 2.5) from Donley et al. (2012). The solid line shows the
composite SED as a function of redshift (labelled). We see that a large fraction of SMGs have colours suggestive of AGN, but the majority of these lie at too
high redshifts ( & 2.5) for the reliable application of this classification criterion – with their power-law like IRAC colours resulting from the redshifting of the
1.6- m bump longward of the 5.8- m passband. The field galaxies are also plotted (in grey) and it is clear that SMGs have significantly redder colours, with
the bulk of the field sample falling off the bottom left corner of the plot. The average error is shown in the top of each panel.

 The UDS was imaged at 1.4 GHz with the Very Large Array the near-infrared, but with more limited detection rates in the bluer
(VLA) using ∼ 160 hours of integration. The resulting map has optical bands.
an rms of 1.4GHz ' 6 Jy beam−1 (Arumugam et al. in prep.; for Before we discuss the multi-wavelength SEDs, we first com-
a brief summary see Simpson et al. 2013). In total 6,861 radio pare the optical and near/mid-infrared colours of the SMGs and
sources are detected at SNR> 4, and 706/707 of the ALMA SMGs field galaxies in our sample. As this study makes use of a -band
are covered by the map. Matching the ALMA and radio catalogues selected catalogue, we investigate the distribution of -band mag-
using a 1.6 00 search radius (∼1 per cent false-positive matches) nitudes compared to the ALMA 870 fluxes Fig. 2a.
yields 273 matches at a 3- level, corresponding to a radio detection
fraction of 39 per cent (see also An et al. 2018), which is similar to Colour selection of galaxies can provide a simple method to
the detected radio fraction in other comparable SMG surveys (∼ 30– identify high-redshift galaxies. For example, Daddi et al. (2004)
50 per cent; e.g. Hodge et al. 2013; Biggs et al. 2011; Brisbin et al. suggested a criteria based on ( − ) and ( − ) (BzK) with
2017, although see Lindner et al. 2011). In § 4.1 we will discuss = ( − ) – ( − ) to select star-forming galaxies at ' 1.4–
the redshift distribution of the radio-detected versus non-detected 2.5. Although the SMGs are likely to be more strongly dust-obscured
fractions, as well as the influence of the radio emission on the SED than typical star-forming galaxies at these redshifts, this diagnos-
modelling we perform. tic still provides a useful starting point to interpret the rest-frame
 UV/optical colours, and we show the SMGs in the ( − ) – ( − )
 colour space in Fig. 2b. We see that compared to a field galaxy
 sample, as expected, the SMGs are significantly redder, likely due
2.4 Photometric properties of SMGs in comparison to the
 to their higher dust obscuration and higher redshifts. Neverthe-
 field population
 less, for our sample of 290 AS2UDS SMGs with detections in all
To illustrate the broad photometric properties of our SMG sample three , and -bands, 87 per cent (253/290) of sources lie above
and the constraints available on their SEDs, we list the number of = −0.2, which is the suggested limit that separates star-forming
SMGs detected (above 3- ) in a range of representative optical galaxies from passive galaxies, indicating that the majority of these
and infrared photometric bands in Table 1. It is clear that fewer -detected (hence bluer than average) SMGs have the colours
detections are observed in the bluer optical wavebands, while ∼ 70– expected for a star-forming population. However, we caution that 14
80 per cent of the sample (which are covered by the imaging) are per cent of our sample of these -detected highly dust-obscured
detected in or the IRAC bands; this drops to 56 per cent in the star-forming galaxies are misclassified as “passive”. Moreover, we
 -band. In the far-infrared, 69 per cent of the ALMA SMGs are note that the SMG sub-set shown on this plot is strongly bi-
detected in at least one of the PACS or SPIRE bands. Thus we have ased due to the large fraction that are not shown because they are
good photometric coverage for the bulk of the sample longward of undetected in the optical bands, especially the -band. To highlight

MNRAS 000, 1–33 (2020)
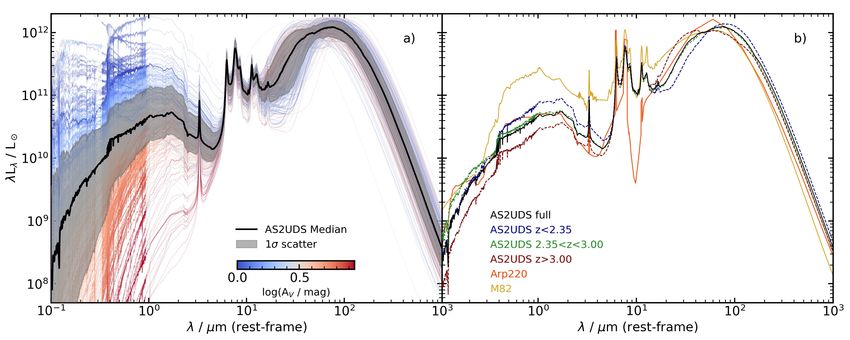
8 Dudzevičiūtė et al.
this, we overlay the track for our composite SED (see § 4.2), which lot (2003), a Chabrier IMF (Chabrier 2003) and metallicities that
should more accurately represent the “typical” SMG, as a function vary uniformly from 0.2 to 2 times solar. Star-formation histories
of increasing redshift. This indicates that at ' 1.5–2.5 the average are modelled as continuous delayed exponential functions (Lee et al.
SMG has colours which lie on the border of the star-forming 2010) with the peak of star formation occurring in range of 0.7–
criterion, suggesting that a significant fraction of . 2.5 SMGs 13.3 Gyr after the onset of star formation. The age is drawn randomly
would not be selected as star-forming systems based on their in the range of 0.1–10 Gyrs. To model starbursts, magphys also su-
colours, even if we had extremely deep -band observations. perimposes bursts on top of the star-formation history. These bursts
 Given that the detection rate of ALMA SMGs is much higher are added randomly, but with a 75 per cent probability that they
in the mid-infrared IRAC bands, in Fig. 2c we show the 5.8 / 3.6 occurred within the previous 2 Gyr. The duration of these bursts
versus 8.0 / 4.5 colour-colour plot for 388 SMGs that are detected varies in range of 30 – 300 Myr with a total mass formed in stars
in all four IRAC bands. This colour-colour space has been used to varying from 0.1 to 100 × the mass formed by the underlying con-
identify high-redshift star-forming galaxies, as well as isolate can- tinuous model. In this way, starbursts, as well as more quiescent
didate AGN at . 2.5 from their power-law spectra (e.g. Donley galaxies, can be modelled. We note that the star-formation rate re-
et al. 2012). In this figure, on average the IRAC-detected ALMA turned from magphys for a given model is defined as the average of
SMGs are again significantly redder than the field population (see the star-formation history over the last 100 Myr.
also Stach et al. 2019). We overlay the track formed from the com- The far-infrared emission from dust in magphys is determined
posite SED of our sample (see § 4.2), which demonstrates that these self-consistently from the dust attenuated stellar emission. Dust
IRAC-detected SMGs are likely to lie at ' 2–3. Hence, although it attenuation is modelled using two components following Charlot
might appear from Fig. 2c that many of the SMGs have mid-infrared & Fall (2000): a dust model for young stars that are still deeply
colours suggestive of an AGN (power-law like out to 8 m), this is embedded in their birth clouds; and a dust model for the interme-
simply because many of these lie at > 2.5 where sources cannot diate/old stars in the diffuse ISM. The far-infrared luminosity we
be reliably classified using this colour selection. Indeed, Stach et al. report is measured by integrating the SED in the rest-frame be-
(2019) estimates a likely AGN fraction in AS2UDS based on X-ray tween 8–1000 m and is calculated through the sum of the birth
detections of just 8 ± 2 per cent. As seen from the composite SED cloud and ISM luminosities, which also include contributions from
track, the sources in the AGN colour region are on average at higher the polycyclic aromatic hydrocarbons, and mid-infrared continuum
redshifts ( > 2.5), where the 1.6- m stellar “bump” falls beyond from hot, warm and cold dust in thermal equilibrium. The dust
the 5.8- m band, and the Donley et al. (2012) AGN criteria breaks mass is calculated using the far-infrared radiation and a wavelength-
down. dependent dust mass coefficient. For a full description of how each
 In summary, the basic photometric properties of SMGs show parameter is modelled see da Cunha et al. (2015) and Battisti et al.
them to be redder than average field galaxies across most of the (2019).
UV/optical to mid-infrared regime, likely due to a combination of For our analysis, we used the updated magphys code from da
their higher redshifts and higher dust obscuration. High-redshift Cunha et al. (2015) and Battisti et al. (2019), which is optimised
SMGs are also fainter than the low-redshift SMGs in the optical to fit SEDs of high redshift ( > 1) star-forming galaxies. This
and near-infrared wavebands (Fig. 1), but with a large dispersion in code includes modifications such as extended prior distributions of
properties at any redshift. star-formation history and dust optical depth effects, as well as the
 inclusion of intergalactic medium absorption of UV photons. The
 updated version also includes photometric redshift as a variable.
 To fit the photometry of a galaxy, magphys generates a li-
3 MAGPHYS: TESTING AND CALIBRATION
 brary of SEDs for a grid of redshifts for each star-formation history
To constrain the physical properties of the AS2UDS SMGs we em- considered. magphys identifies the models that best-fit the multi-
ploy magphys (da Cunha et al. 2008, 2015; Battisti et al. 2019) – wavelength photometry by matching the model SEDs to the data
a physically motivated model that consistently fits rest-frame SEDs using a 2 test and returns the respective best-fit parameters. In
from the optical to radio wavelengths. An energy balance technique this study, we focus on eight of the derived parameters: photometric
is used to combine the attenuation of the stellar emission in the redshift ( ); star-formation rate (SFR); stellar mass ( ∗ ); mass-
UV/optical and near-infrared by dust, and the reradiation of this weighted age (Age ); dust temperature ( d ); dust attenuation ( V );
energy in the far-infrared. The magphys model includes the energy far-infrared luminosity ( IR ) and dust mass ( d ).
absorbed by dust in stellar birth clouds and the diffuse ISM. This For each parameter, magphys returns the probability distribu-
approach provides several significant advances compared to mod- tion (PDF) from the best-fit model. The derived parameters (e.g.
elling the optical and infrared wavelengths separately (e.g. Simpson photometric redshift, stellar mass, etc) are taken as the median from
et al. 2014; Swinbank et al. 2014), allowing more control of the the PDF, with uncertainties reflecting the 16–84th percentile values
covariance between parameters and generally providing more ro- of this distribution (we note that if we instead adopted the peak
bust constraints on the physical parameters (e.g. redshifts, stellar value from the PDF, none of the conclusions below are significantly
masses, and star-formation rates). However, we note that the mod- affected). In a small number of cases, the SEDs are overly con-
elling assumes that sub-millimetre and optical emission is coming strained due to the finite sampling, and the PDFs are highly peaked,
from a region of comparable size, which is a simplification of the meaning the returned uncertainties are unrealistically low. In these
true system. cases, we take a conservative approach and adopt the median un-
 Before we apply magphys to the SMGs in our sample, we certainty from the full sample for that derived parameter. We flag
briefly review the most important aspects of the model that are the sources where this has occurred in the on-line catalogue (Table
likely to affect our conclusions and discuss a number of tests that A1 in Appendix A).
we apply to validate our results. For a full description of magphys A significant fraction of the SMGs in our sample are faint or
see da Cunha et al. (2008, 2015) and Battisti et al. (2019). undetected in one or more of the 22 wavebands that we employ in our
 magphys uses stellar population models from Bruzual & Char- analysis – most frequently this is at the bluest optical wavelengths

 MNRAS 000, 1–33 (2020)
Physical properties of SMGs from AS2UDS 9

 101 ID: 0345.0 ID: 0014.0
 red: 3.16 red: 1.71
 2 2
 100 zphot: 1.66+0.03
 0.06 zphot: 3.69+0.22
 0.12

 10 1
F / mJy

 10 2
 0.05
 10 3
 P(z) 0.1

 P(z)
 10 4
 0.00 1 2 0.002 4 6
 10 5 z z
 101 ID: 0083.0 ID: 0690.0
 red: 0.30 red: 0.40
 2 2
 100 zphot: 3.48+0.48
 0.32 zphot: 3.35+0.62
 0.40

 10 1
F / mJy

 10 2

 0.02 0.01
 10 3
 P(z)

 P(z)
 10 4
 0.002 4 6 8 0.002 4 6 8
 10 105 z z
 1 100 101 102 103 104 105 10 1 100 101 102 103 104 105 106
 / m (observed frame) / m (observed frame)

Figure 3. The observed-frame optical to radio spectral energy distributions of four example AS2UDS SMGs selected to have a decreasing number of photometric
detections: 22/22, in top left; 16, in top right; 11, in bottom left; and 5 in bottom right. Limits in the optical/near-infrared wavebands ( -band to IRAC 8 m)
were treated as 0 ± 3 , while those beyond 10 m (MIPS 24 m to Radio 1.4GHz) are set to 1.5 ± 1 . These limits are indicated as arrows. The solid line
shows the predicted SED at the peak redshift of the best-fit PDF. The inset plots show the redshift probability distributions. As expected, as the number of
photometric detections decreases, the redshift distribution becomes wider and the predicted photometric redshifts becomes more uncertain. For reference, of
our 707 SMGs 50 per cent have ≥ 11 photometric detections, while 82 per cent have ≥ 5 detections.

(see Table 1) due to their high redshift and dusty natures. Thus, we the SEDs: from sources that are detected in all of the available 22
first assess how the flux upper limits affect the model fitting. photometric bands (37 per cent of sources have coverage in 22–16
 bands), 16 bands ( 28 per cent have coverage in 16–11 bands), 11
 As a first step, in any given waveband, we treat a source as
 bands (20 per cent have coverage in 11–5 bands) and down to 5
detected if it has at least a 3- detection. For non-detections, we
 bands (15 per cent have coverage in 5 or less bands). We also plot
conservatively adopt a flux of zero and a limit corresponding to
 the resulting photometric redshift PDF for each of these SMGs. This
3- in the UV-to-mid-infrared bands (i.e. up to 8 m). This is mo-
 demonstrates that when the SED is well-constrained (e.g. the galaxy
tivated by a stacking analysis of ALMA SMGs in ALESS where
 is detected in a large fraction of the photometric bands), the range
the individually optically faint or undetected SMGs yielded no or
 of possible photometric redshifts is narrow, e.g. with a median 16–
only weak detections in the stacks (e.g. Simpson et al. 2014). In
 84th percentile range of Δ = 0.20 for SMGs with detections in all
the far-infrared, most of the “non-detections” occur in the Herschel
 22 bands. However, as the number of detection decreases, this range
maps, which are confusion-noise dominated. Stacking analysis of
 broadens. For our full sample of SMGs, the median number of bands
SMGs at 250–500 m has demonstrated that the flux densities of
 that are detected is 12, which yields a median 16–84th percentile
ALMA SMGs at these wavelengths are often just marginally be-
 redshift range on any given SMG of Δ = 0.50. For reference, the
low the confusion noise (e.g. Simpson et al. 2014). To this end,
 median uncertainty for the 18 per cent of SMGs that are detected
for non-detected sources in the infrared (beyond 10 m), we adopt
 in ≤ 6 bands is Δ = 0.86. Note also that in some cases the reduced
a flux density of 1.5 ± 1.0 . Other choices of limits were tested
 2 decreases as the number of detections decreases. This does not
(e.g. 0 ± 1 for all wavebands, 0 ± 1 for optical/near-infrared and
 necessarily indicate a better fit, but rather often reflects the large
1.5 ± 1.0 for infrared) with no significant changes found for any
 uncertainties in non-detected wavebands.
of the derived physical parameters.
 We run magphys on all 707 ALMA SMGs in our sample, and Finally, before testing the accuracy of the photometric red-
in Fig. 3 we show the observed photometry and best-fit magphys shifts, we ensure that the energy balance technique is appro-
model for four representative examples. All SED fits are shown priate and the far-infrared photometry is not affecting the red-
on-line (Fig. A1 in Appendix A). These examples are selected to shift prediction significantly. We run magphys on SMGs with -
span the range in the number of photometric detections included in band detections including only photometry up to 8 m and com-

MNRAS 000, 1–33 (2020)
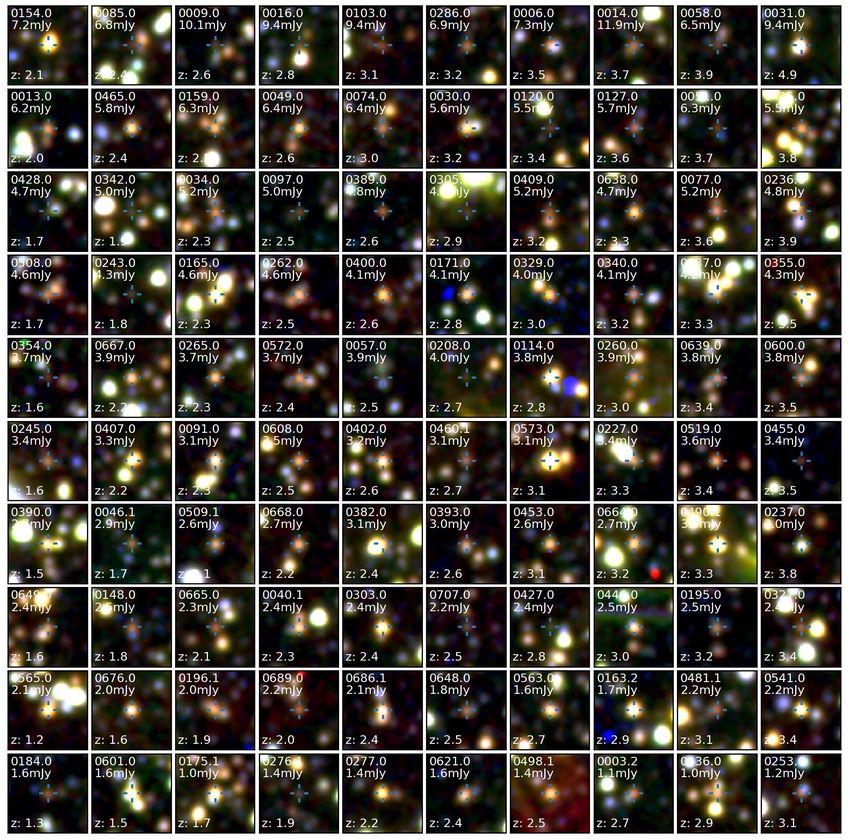
10 Dudzevičiūtė et al.
 ies with spectroscopic redshifts below = 2 to form a field sample
 6 biased towards higher-redshift/fainter sources that is more represen-
 UKIDSS median tative of the distribution of high-redshift SMGs. magphys run on
 10 UKIDSS DR11 this sub-sample yields a median offset between the spectroscopic-
 5 P(z) With opt/near-IR detections and photometric-redshifts of Δ / (1 + spec ) = 0.004 ± 0.001, al-
 No opt/near-IR detections
 though with larger systematic offsets at redshift above ' 2.5
 0.0 0.20
 4 0.2 z / (1+z (Δ / (1 + spec ) = 0.040±0.003). At these redshifts, the photometric
 spec)
zMAGPHYS

 redshift has sensitivity to the intergalactic medium (IGM) opacity
 3 as the Lyman break (rest-frame 912–1215Å) pass through the ob-
 served -band for sources that are bright enough to be detectable.
 Adjusting the IGM absorption coefficient in the SED model can
 2 reduce this systematic Δ offset (e.g. Wardlow et al. 2011). The
 IGM effective absorption optical depth of each model is drawn
 1 from a Gaussian distribution centred at the mean value given in
 Madau (1995), with a standard deviation of 0.5. We, therefore, re-
 0.5 1.0 1.5 2.0 2.5 3.0 3.5 4.0 4.5 5.0
 zspec run magphys for the spectroscopic sample with IGM absorption
 coefficients between 0.2–1.0 of each drawn model value. From this
 test, we find that tuning the IGM coefficient to 0.5 of the initially
Figure 4. Comparison of magphys photometric redshifts versus spectro-
 drawn value minimises the systematic offset between the spectro-
scopic redshifts. The 44 AS2UDS SMGs with spectroscopic redshifts are scopic and photometric redshifts above ∼ 2, whilst maintaining
plotted, as well as field sample of 6,719 -detected UDS galaxies with the closest match at lower redshift, thus we adopt it in any subse-
spectroscopic redshifts. The dashed line shows the running median for quent analysis. In Fig. 4 we show the comparison of the spectro-
the field galaxies, which tracks the spectroscopic redshifts closely up to scopic and photometric redshifts for the field galaxies and SMGs.
 ∼ 3.5. For the SMGs, we identify the four that lack detections in the We see that for the SMGs the three most extreme outliers are opti-
optical bands. The inset panel shows the fractional offset of photometric cally undetected, leading to uncertain estimation of their redshifts.
redshifts from spectroscopic values for the field sample. The median offset The fourth outlier is a secondary ALMA source within a single
is ( spec − phot )/(1 + spec ) = −0.005±0.003 with a dispersion of 0.13. SCUBA-2 map, where the optical photometry may have been mis-
 matched. Over the full redshift range, the offsets between the spec-
 troscopic and photometric redshifts for all 6,719 field galaxies is
pare the predicted photometric redshifts to the values derived us- Δ / (1+ spec ) = −0.005 ± 0.003, and Δ / (1+ spec ) = −0.02 ± 0.03,
ing the full UV-to-radio photometry. We find that the scatter of with a 1 scatter of Δ / (1 + spec ) =0.13, if we just consider the
photometric redshifts is within the error range as the median is 44 SMGs. The photometric redshift accuracy we obtain is compa-
( full − ≤8 m )/( 84
 full
 ℎ − 16 ℎ ) = 0.11 with 68th percentile range
 full rable to that found for SMGs in the COSMOS field by Battisti et al.
of -1.0–0.95. Thus, coupling far-infrared information into the esti- (2019).
mation of photometric redshifts is not introducing any significant We check what effect the error on the photometric redshift
biases. has on our inferred physical properties by running magphys on
 the AS2UDS sub-sample of 44 SMGs with spectroscopic redshifts
 at their fixed spectroscopic redshifts. We investigate whether the
3.1 Testing against spectroscopic redshifts change in the derived value of the property at the spectroscopic
Before discussing the redshift distribution of our SMGs, we first redshift and the photometric redshift is encompassed by the quoted
confirm the reliability of magphys to measure photometric redshifts, errors (at the photometric redshift and including the covariance
and critically their uncertainties, (see also Battisti et al. 2019) by due to the uncertainty in this value) by calculating the fractional
comparing the photometric and spectroscopic redshifts for both the difference, spec / phot , where is any given parameter. The change
SMGs and the field galaxies in the UDS. for all the predicted parameters was, on average, less than . 15 per
 First, we run magphys on all 6,719 -band detected galaxies cent, which is less than the typical errors. Therefore we confirm that
in the UKIDSS DR11 catalogue that have archival spectroscopic the error uncertainty effect on any given parameter is captured in
redshifts, and that have no photometric contamination flags (Smail its error range and is not affecting final parameter distribution.
et al. 2008; Hartley et al. in prep.; Almaini et al. in prep.). This
includes 44 of the SMGs from our sample (including new spectro-
 3.2 Modelling EAGLE galaxies with magphys – a comparison
scopic redshifts from KMOS observations; Birkin et al. in prep.).
 of simulated and magphys derived properties
We note that it is possible, and indeed probable, that given the wide
variety of sources from which these redshifts were taken and the As well as empirically testing the reliability of the predicted pho-
faintness of many of the target galaxies, that some of these spec- tometric redshifts from magphys, we also wish to test how well
troscopic redshifts are incorrect. As a result, we concentrate on the the other magphys-derived parameters are expected to track the
quality of the agreement achieved for the bulk of the sample, giving corresponding physical quantities. This is more challenging, as we
less emphasis to outliers. We also note that, given the heterogeneous lack knowledge of the “true” quantities (e.g. stellar mass or star-
sample selection, the sample contains a mix of populations, which formation rate) for observed galaxies in our field and so we have
is likely to include an increasing fraction of AGN-hosts at higher to adopt a different approach. We, therefore, take advantage of the
redshifts, the SEDs for which are not reproduced by the current simulated galaxies from the Evolution and Assembly of GaLaxies
version of magphys. and their Environments (EAGLE, Schaye et al. 2015; Crain et al.
 We further isolate a sub-sample of all field galaxies with no 2015) galaxy formation model to test how well magphys recovers
photometric contamination flags above = 2 and include 500 galax- the intrinsic properties of realistic model galaxies.

 MNRAS 000, 1–33 (2020)
You can also read