Using Network-Based Machine Learning to Predict Transcription Factors Involved in Drought Resistance
←
→
Page content transcription
If your browser does not render page correctly, please read the page content below
ORIGINAL RESEARCH
                                                                                                                                                 published: 24 June 2021
                                                                                                                                        doi: 10.3389/fgene.2021.652189

                                              Using Network-Based Machine
                                              Learning to Predict Transcription
                                              Factors Involved in Drought
                                              Resistance
                                              Chirag Gupta † , Venkategowda Ramegowda †‡ , Supratim Basu ‡ and Andy Pereira*
                                              Department of Crop, Soil, and Environmental Sciences, University of Arkansas, Fayetteville, AR, United States

                            Edited by:        Gene regulatory networks underpin stress response pathways in plants. However,
                    Valentino Ruggieri,       parsing these networks to prioritize key genes underlying a particular trait is challenging.
               Sequentia Biotech, Spain
                                              Here, we have built the Gene Regulation and Association Network (GRAiN) of rice
                        Reviewed by:
                             Hui Song,
                                              (Oryza sativa). GRAiN is an interactive query-based web-platform that allows users to
Qingdao Agricultural University, China        study functional relationships between transcription factors (TFs) and genetic modules
                            Raju Datla,
                                              underlying abiotic-stress responses. We built GRAiN by applying a combination of
    Global Institute for Food Security
                       (GIFS), Canada         different network inference algorithms to publicly available gene expression data.
                               Fan Lin,       We propose a supervised machine learning framework that complements GRAiN in
      Brightseed Inc., United States
                        Ki-Hong Jung,
                                              prioritizing genes that regulate stress signal transduction and modulate gene expression
  Kyung Hee University, South Korea           under drought conditions. Our framework converts intricate network connectivity
                   *Correspondence:           patterns of 2160 TFs into a single drought score. We observed that TFs with the
                         Andy Pereira
                                              highest drought scores define the functional, structural, and evolutionary characteristics
                    apereira@uark.edu
     † These                                  of drought resistance in rice. Our approach accurately predicted the function of
               authors have contributed
                    equally to this work      OsbHLH148 TF, which we validated using in vitro protein-DNA binding assays and
                    ‡
                      Present address:        mRNA sequencing loss-of-function mutants grown under control and drought stress
        Venkategowda Ramegowda,               conditions. Our network and the complementary machine learning strategy lends itself
     Department of Crop Physiology,
   University of Agricultural Sciences,       to predicting key regulatory genes underlying other agricultural traits and will assist in
                      Bengaluru, India        the genetic engineering of desirable rice varieties.
                       Supratim Basu,
            New Mexico Consortium,            Keywords: rice, oryza, drought, transcription factor, gene regulatory network, machine learning, abiotic stress,
     Los Alamos, NM, United States            R shiny

                   Specialty section:
         This article was submitted to        INTRODUCTION
                      Plant Genomics,
               a section of the journal       The occurrence of environmental stressors, such as extreme drought, heat, cold, and salinity,
                  Frontiers in Genetics       negatively regulates the growth and development of crop plants, causing a substantial loss in yield
         Received: 11 January 2021            and quality (Boyer, 1982; Bray, 1997; Yamaguchi-Shinozaki and Shinozaki, 2006; Palanog et al.,
           Accepted: 13 May 2021              2014). Plants and specific genotypes within a plant species that can withstand sub-optimal growth
          Published: 24 June 2021
                                              conditions would be identified as ‘stress-tolerant’ and offer examples to study the mechanisms
                             Citation:        involved in their survival and productivity in terms of yield. While conventional breeding has been
     Gupta C, Ramegowda V, Basu S             the preferred method of improving stress tolerance in rice and other crops, modern genomics,
           and Pereira A (2021) Using
                                              and genetic engineering strategies have become an integral part of trait enhancement programs
    Network-Based Machine Learning
      to Predict Transcription Factors
                                              (Umezawa et al., 2006; Ashraf, 2010; Gaj et al., 2013). However, a prerequisite for the effective
      Involved in Drought Resistance.         use of genetic engineering tools in trait improvement is the prior knowledge about candidate
            Front. Genet. 12:652189.          genes that are likely to produce a desirable phenotype when genetically intervened. Although
    doi: 10.3389/fgene.2021.652189            transcriptome analysis of rice under water-limited conditions, for example, has identified thousands

Frontiers in Genetics | www.frontiersin.org                                          1                                            June 2021 | Volume 12 | Article 652189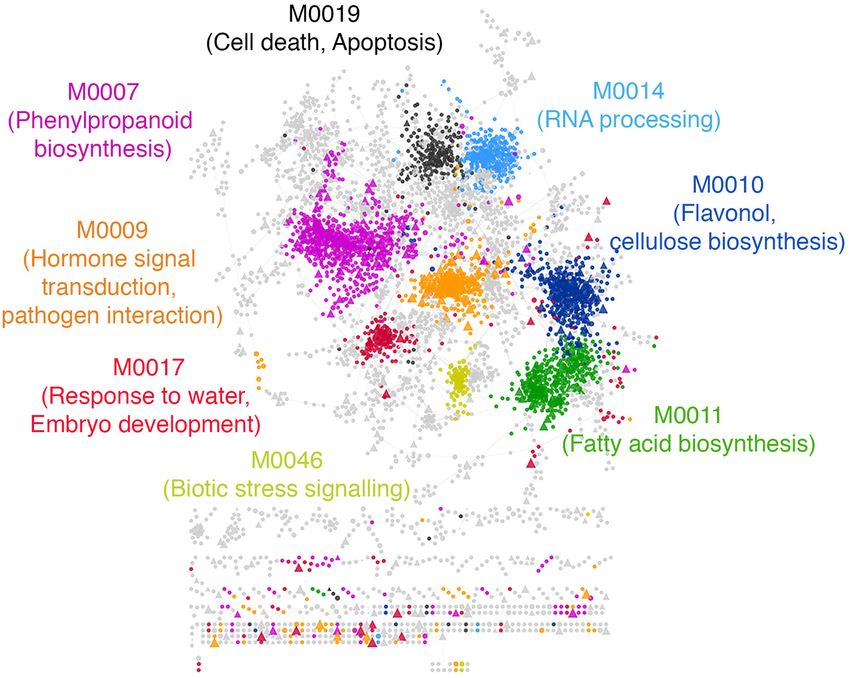
Gupta et al.                                                                                                Gene Regulation and Association Network

of differentially expressed genes, it is difficult to narrow down           limitations tend to cancel out (Michoel et al., 2009; De Smet and
the selection of candidate genes for testing function and genetic           Marchal, 2010; Marbach et al., 2012; Hase et al., 2013). Rather
modification of drought resistance (DR). This lack of candidate             than relying on only one approach, an ensemble-centric approach
genes will be a significant bottleneck in the future, as it impedes         of combining predictions from multiple algorithms appears to be
our ability to upscale targeted genetic screens in order to select          an excellent strategy to infer GRNs even in plants (Vermeirssen
leads for further crop improvement (Gutterson and Zhang, 2004;              et al., 2014; Taylor-Teeples et al., 2015; Redekar et al., 2017; Foo
Century et al., 2008; Jansing et al., 2019; Baxter, 2020). Therefore,       et al., 2018).
new data-driven approaches capable of discovering critical genes                Post the inference of a GRN, mining relevant signals that may
regulating complex traits like DR are needed.                               lead to actionable hypotheses is not straightforward. For example,
    Gene regulatory networks (GRN) play a central role in                   a typical network analysis workflow aims to find modules
mediating plant responses to environmental changes (Chen and                (communities of densely connected genes) in the network and
Zhu, 2004; Clauw et al., 2016; Lovell et al., 2018). Transcription          assign a biological meaning to these modules using statistical
Factors (TFs) are vital nodes (genes) in these networks as                  enrichment of gene ontologies and pathway annotations.
they regulate the expression of several downstream genes                    Biological interpretation using enrichment analysis typically
involved in many stress-responsive pathways and biological                  require modules with a considerable number of genes for
processes. TFs act as ‘switches’ in genetic networks and can                reliable overlap statistics with the already sparse and incomplete
be exploited to engineer stress-resistant crop varieties (Tran              functional annotations. Therefore, modules containing many
et al., 2010; Rabara et al., 2014; Krannich et al., 2015;                   genes are readily interpreted in functional contexts, while smaller
Wang et al., 2016; Hoang et al., 2017). Such gene activity                  modules typically remain less interpretable.
can be monitored dynamically under varying experimental                         Large modules of densely connected genes can be un-inviting
conditions using genome-scale technologies such as microarrays              for experimental biologists who wish to apply network models
and RNA-sequencing. Integration of such transcriptome-level                 in the wet-lab. Biologists should have a protocol that converts
datasets for inference of GRNs remains a feasible approach                  complex ‘hairballs’ of connected genes into a single score for each
(Razaghi-Moghadam and Nikoloski, 2020). Transcriptome-                      gene, allowing non-subjective candidate prioritization before
based network inference techniques have also shown great                    validation. Gene prioritization before experimental testing is vital
promise in accelerating in silico gene discovery for in planta gene         for reducing associated costs, especially when one intends to work
validation in plants (Li et al., 2015; Gupta and Pereira, 2019;             on more than one node in a sub-network (or module) of interest.
Haque et al., 2019).                                                        The popular concept of ‘hub’ genes (genes with a relatively large
    There are several caveats to GRN inference using expression             number of connections in the network) is contextual (Langfelder
data, which mainly stem from co-expression used as a proxy                  et al., 2013; Walley et al., 2016; Vandereyken et al., 2018), as
for co-regulation. A physical interaction (e.g., TF-promoter                hubs in a protein coexpression network can be very different
and TF-TF protein complex) cannot be guaranteed with an                     from hubs in a protein coexpression network (Walley et al.,
observed TF-gene pair that co-express. Incorporating TF-DNA                 2016). In terms of regulatory networks, studies in yeast have
binding data (e.g., ChIP-seq datasets, predictably conserved TF-            shown that hierarchy, rather than connectivity, better reflects
DNA binding motif relationships) into the network inference                 regulators’ importance (Bhardwaj et al., 2010). Therefore, new
workflow can overcome some of these limitations. However,                   computational approaches beyond the estimation of ‘hubbiness’
careful methodological considerations can also circumvent some              or other network parameters for gene prioritization are required.
of these limitations. An increasing corpus of network inference                 Gene prioritization is an essential technique for selecting lead
algorithms aims to eliminate likely indirect interactions between           candidates before experimental testing. One might assume that
TFs and other genes, i.e., correlations arising from transcriptional        a simple test of differential expression can be used for gene
regulation cascades. These algorithms provide an advantage of               prioritization based on the magnitude of fold change under
inferring GRNs using expression data to cover those TFs for                 certain experimental conditions. However, we argue that this
which DNA-binding sites have not been found or confirmed                    method is not the most logical approach for gene prioritization,
as yet, which remains the case for rice (Wilkins et al., 2016),             especially for TFs. Given their regulatory nature, subtle changes
and mostly all crops. We believe that removing TFs with no                  in the expression of TFs could have profound effects on the
DNA-binding data from network inference essentially leads to                expression of downstream genes. Therefore, technically speaking,
the loss of regulatory signals that can be measured by analyzing            such TFs might not naturally qualify to find a position toward the
expression patterns.                                                        top of the sorted list of genes based on fold changes.
    The outcomes of network inference considerably differ                       Recently, supervised machine learning has been useful in
between different algorithms because they adopt different                   generating predictive models for various research aspects in plant
statistical assumptions and filtering schemes to detect regulatory          and crop biology (Ma et al., 2014; Sperschneider, 2019, 2020).
interactions in expression patterns. Therefore, different network           Supervised machine learning algorithms leverage experimentally
inference strategies have their strengths and weaknesses, making            validated gold-standard example genes from the literature
it difficult to narrow down on a single best approach (Stolovitzky          to make new predictions on genes with similar attributes.
et al., 2009; Marbach et al., 2010). Previously, large-scale                For example, thousands of genomic and evolutionary features
evaluations showed that the advantages of combining predictions             that characterize known essential genes were used to train
from different algorithms complement each other, and their                  models predictive of other untested lethal-phenotype genes

Frontiers in Genetics | www.frontiersin.org                             2                                      June 2021 | Volume 12 | Article 652189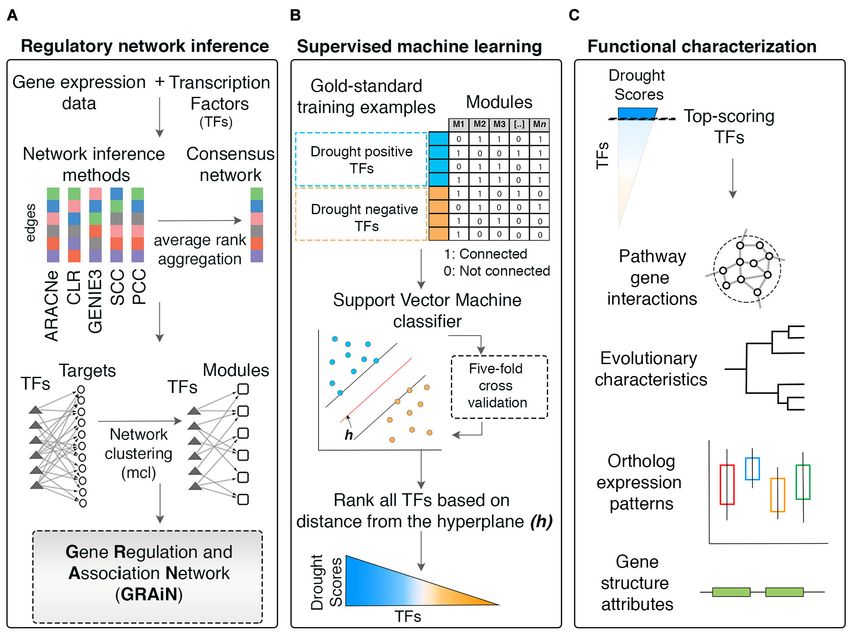
Gupta et al.                                                                                              Gene Regulation and Association Network

(Lloyd et al., 2015). Similarly, several distinguishing features of       the datasets to create a single gene expression matrix representing
genes currently annotated in secondary or primary metabolism              35,151 rice genes’ intrinsic expression in 265 individual samples.
pathways were used to train models capable of predicting new              Our objective was to utilize the correlated and mutually
specialized metabolism genes (Moore et al., 2019). Putative cis-          informative expression patterns in this matrix to predict potential
regulatory elements (CREs) involved in general abiotic and biotic         regulatory interactions between TFs and target genes.
stress responses (Zou et al., 2011), and CREs involved in the
regulation of root cell type responses to high salinity stress            The Outcome of Network Inference
(Uygun et al., 2019) have also been identified by the application         Varies Between Different Algorithms
of supervised machine learning models.                                    Rather than using a single algorithm for the inference of the
   We are particularly interested in studies that used a genome-          rice GRN, we created an ensemble of five diverse methods that
scale network, instead of heterogeneous genomic features, as              use different edge-scoring and filtering strategies. We included
input to the learning algorithm. Such frameworks aim to                   Context Likelihood of Relatedness (CLR) and Algorithm for
capture the network connectivity patterns that characterize               Reconstruction of Accurate Cellular Networks (ARACNe) in the
a set of gold standard (or marker) genes. Network-based                   first category of algorithms that use mutual information (MI) to
machine learning has been used to make reliable predictions               estimate similarity in expression patterns. We included Pearson’s
on disease-gene associations in humans (Guan et al., 2010,                Correlation Coefficient (PCC) and Spearman’s Correlation
2012; Krishnan et al., 2016; Liu et al., 2019). Such predictive           Coefficient (SCC) as the second category’s two correlation-based
systems have immense potential in the development of decision             methods. In the third category, we used GEne Network Inference
systems in clinical diagnostics. However, whether this network-           by an Ensemble of trees (GENIE3) algorithm as the regression-
based supervised machine learning approach can be applied to              based method that infers edges with directionality. We then
predicting regulatory genes associated with specific agricultural         supplied each of these five algorithms with the gene expression
biology traits remains to be tested.                                      matrix to predict regulatory interactions (edges) between TFs and
   In this study, we developed the Gene Regulation and                    target genes (see section “Materials and Methods”).
Association Network (GRAiN) of rice. We built GRAiN using                     We retained only the top 500,000 high confidence edges from
a collection of publicly available gene expression datasets and           each algorithm’s outcome to reduce the computational burden
an ensemble of five different network prediction algorithms               in the network analysis workflow (Supplementary Data 1).
(Figure 1A). GRAiN links 2160 rice TFs to 740 modules of co-              These 500,000 edges represented less than 1% of all theoretically
regulated genes that manifest under abiotic-stress conditions. We         possible edges between TFs and their target genes in the input
utilized GRAiN to develop a model predictive of TFs involved              gene expression matrix (see section “Materials and Methods”).
in the regulation of DR. We used a training set of TFs that               We asked if these high confidence edges predicted by the five
are already known regulators of DR as input to a learning                 algorithms are similar. We observed a minimal overlap (less
algorithm (support vector machine). The learning algorithm                than 1%) between all five algorithms’ outcomes (Figure 2).
used this training data to learn general network patterns that            The most considerable fraction of unique edges came from the
characterize DR. We then used the trained model to identify               CLR algorithm, followed by GENIE3 and PCC. We observed
other TFs that resemble TFs in the training set. Our strategy             a relatively more extensive overlap between the algorithms in
scored 2160 rice TFs according to their potential association             different categories than algorithms in the same category. For
with DR (Figure 1B). Leveraging these scores, we described the            example, the overlap between SCC and ARACNe eclipses the
functional, evolutionary, and structural characteristics of drought       overlap between SCC and PCC. This is probably because SCC
regulation (Figure 1C). We also developed a web application to            and ARACNe, unlike PCC, are not constrained to detecting only
browse GRAiN1 easily. Furthermore, we experimentally validated            linear correlations between TF and target genes. Similarly, we
GRAiN’s predictions on the OsbHLH148 TF using in vitro                    observed a relatively more generous overlap between GENIE3
protein-DNA binding assays and mRNA sequencing loss-of-                   and CLR than between CLR and ARACNe. This could be because,
function mutants grown under control and drought stress                   for filtering edges, both CLR and GENIE3 account for each gene’s
conditions. Our study will provide a valuable resource for                local distribution of background values separately. On the other
generating new testable hypotheses on the genetic basis of stress         hand, ARACNe examines triplets of connected genes and relies
tolerance in rice.                                                        on a global threshold to eliminate the edge with the lowest score
                                                                          in each triplet as an indirect relationship.
                                                                              Overall, our analysis suggests that the outputs of different
RESULTS AND DISCUSSION                                                    network inference algorithms vary greatly and depend mainly on
                                                                          the filtering schemes used to eliminate low confidence edges.
We obtained 35 independently published publicly available
gene expression datasets. These datasets comprise samples
from 50 different genotypes and cultivars, three developmental            The Performance of Network Inference
stages of rice growth, five different tissues, and nine different         Can Be Improved by Combining
environmental stress conditions. We normalized and integrated             Networks Inferred by Multiple Algorithms
                                                                          To test the performance of each algorithm in predicting
1
    http://rrn.uark.edu/shiny/apps/GRAiN/                                 known targets of TFs, we obtained experimentally identified

Frontiers in Genetics | www.frontiersin.org                           3                                     June 2021 | Volume 12 | Article 652189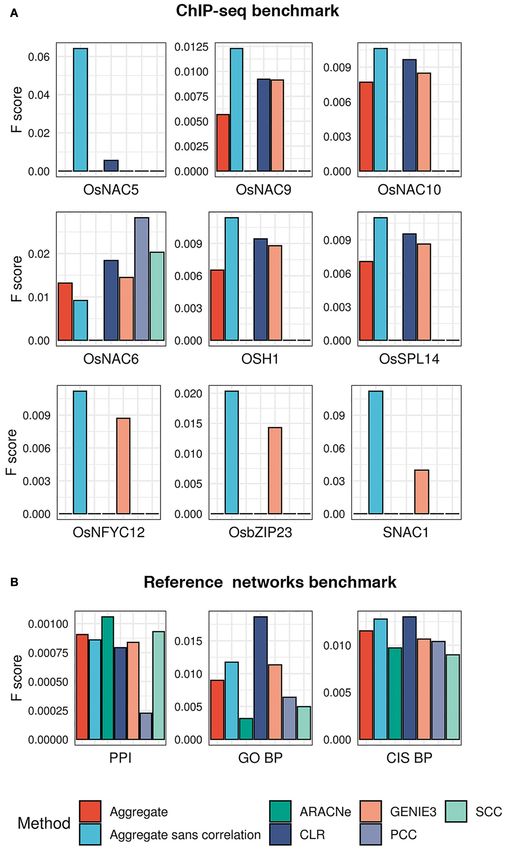
Gupta et al.                                                                                                                  Gene Regulation and Association Network

  FIGURE 1 | Workflow of the network-based machine learning framework developed in this study. (A) A gene regulatory network (GRN) depicting regulatory
  relationships between transcription factors (TFs) and potential target genes was inferred from large-scale expression data (microarrays) of rice. An ensemble of
  network prediction algorithms was applied to the data and the networks inferred by different algorithms were statistically combined using the average rank
  aggregation method, resulting in a single consensus gene regulatory network. This network then was clustered using a network clustering algorithm to identify
  modules of coregulated, and, therefore, functionally associated genes. This modular core of the network was then reconciled with the GRN core, resulting in
  weighted assignments of TFs as the potential regulators of the modules. The network was named Gene Regulation and Association Network (GRAiN). mcl, Markov
  clustering algorithm. (B) Several rice knowledgebases and the literature were mined to obtain a list of TFs that are experimentally validated and reported as
  regulators of drought response phenotypes in rice. We found 165 such TFs reported to date. We regarded these TFs as the ‘gold standard’ examples of drought
  resistance (DR). All DR TFs were labeled as the ‘drought positive’ class. The group of TFs that did not differentially express in our reanalysis of several published
  drought experiments were labeled as the drought negative class. These benchmark drought TFs (positive and negative class), along with their network connectivity
  patterns in GRAiN, were used as input to train a binary classification algorithm, the support vector machine (SVM). The SVM learnt unique network patterns that can
  discriminate between the two classes of benchmark TFs. These patterns were fivefold cross-validated and subsequently used to predict the class label (positive or
  negative) of the remaining unlabeled TFs (ones that are neither in the positive nor the negative class). The final model’s output was used to represent each TF in
  GRAiN (2160 total) along a continuous spectrum (called drought scores), representing its potential association with drought resistance. (C) The functional,
  evolutionary, and genomic features unique to most TFs at the top end of the drought score spectrum were identified and described. GRAiN and predictions on
  regulators of DR can be freely accessed online at http://rrn.uark.edu/shiny/apps/GRAiN/.

targets of 9 TFs in published ChIP-seq experiments (Lu                                  (the fraction of ChIP targets amongst all predicted targets).
et al., 2013; Tsuda et al., 2014; Zong et al., 2016; Chung                              We observed that the CLR algorithm consistently achieved the
et al., 2018; Li et al., 2019). Using these 9 TFs as the                                highest F1 score in more cases than the next best performer,
benchmark, we asked what fraction of their ChIP targets                                 GENIE3 (Figure 3A).
each algorithm could correctly predict. We observed that                                   Note that the TFs used in the ChIP-seq benchmark represents
GENIE3 recovered ChIP targets of 8 out of the 9 TFs in the                              only a fraction (less than 1%) of all TFs for which targets
benchmark, CLR recovered targets of 6 TFs, while ARACNe,                                were predicted. Therefore, we could not regard the ChIP-seq
PCC, and SCC recovered targets of only 1 TF each (Figure 3A                             dataset as a comprehensive benchmark for evaluating different
and Supplementary Table 1). To quantify each algorithm’s                                network inference methods we used in our study. We built
overall performance as a single measure, we calculated the                              additional ad hoc ‘reference networks’ to gauge the algorithms’
F1 score as the harmonic mean of precision (the fraction                                performance. We sought to create reference networks that reflect
of predicted targets that are also ChIP targets) and recall                             putative targets of TFs that can be predicted independently of

Frontiers in Genetics | www.frontiersin.org                                         4                                            June 2021 | Volume 12 | Article 652189
Gupta et al.                                                                                                              Gene Regulation and Association Network

                                                                                         consistently attained the best recall rate in all three reference
                                                                                         networks and outperformed other methods in reconstructing the
                                                                                         CIS-BP and GO BP reference networks in terms of the F1 score
                                                                                         (Supplementary Table 1). The ARACNe algorithm performed
                                                                                         with the best precision in the CIS-BP reference network and
                                                                                         outperformed others in reconstructing the protein interaction
                                                                                         network in terms of the F1 score. SCC’s precision in predicting
                                                                                         CIS-BP edges was lower than that of ARACNe but better than the
                                                                                         other three methods. We observed that PCC outperformed SCC
                                                                                         in CIS-BP and GO BP reference networks (Figure 3B).
                                                                                             Based on these evaluations, we could not establish any
                                                                                         single algorithm as the best performer in reconstructing the
                                                                                         three reference networks or correctly predicting ChIP targets.
                                                                                         Therefore, we asked whether combining the networks inferred by
                                                                                         different algorithms into a single network improves the overall
                                                                                         performance. Rather than taking a union or an intersection,
                                                                                         we chose the ‘average rank aggregation’ approach to combine
                                                                                         different networks (Marbach et al., 2012). The underlying
                                                                                         idea behind the average rank aggregation approach is that a
                                                                                         biologically meaningful edge tends to occur consistently at high
                                                                                         ranks (or confidence scores) across different networks predicted
                                                                                         using different approaches. Hence, averaging the ranks of
  FIGURE 2 | Low overlaps between edges inferred by different network                    individual edges essentially reinforces likely real edges in the final
  prediction algorithms. An Upset plot showing overlaps between the two                  aggregate network. This approach has been previously shown to
  mutual-information based algorithms (ARACNe and CLR), two
                                                                                         efficiently integrate different edge-weighted GRNs into a single
  correlation-based algorithms (PCC and SCC), and one decision-tree based
  algorithm (GENIE3) used for prediction the rice gene regulatory network.               consensus network, even in plants (Vermeirssen et al., 2014).
  ARACNe, Algorithm for Reconstruction of Accurate Cellular Networks; CLR,                   Following the average rank aggregation method, we combined
  Context Likelihood of Relatedness; PCC, Pearson’s Correlation Coefficient;             the networks inferred by all five algorithms in our ensemble
  SCC, Spearman’s Correlation Coefficient; and GENIE3, Gene Network                      into a single GRN (see section “Materials and Methods”). Then,
  Inference by an Ensemble of trees. The filled dots in the canter matrix indicate
                                                                                         we asked whether this aggregation improved the accuracy by
  association between the respective sets and the bars on the top show size of
  the intersection. Green, orange, black, and blue bars indicate intersection size       re-evaluating the ChIP-seq benchmark and the three reference
  between five, four, three, and two algorithms. Red bars indicate unique edges          networks described above. We observed that the aggregate
  identified by the corresponding algorithm.                                             network could not outperform CLR and GENIE3 in most cases
                                                                                         in the Chip-seq set but consistently outperformed ARACNe,
                                                                                         SCC, and PCC (Figure 3A). Interestingly, removing the two
their expression profiles, since we built the network using only                         correlation-based methods from the aggregate almost always
expression data.                                                                         improved the performance, compared to the aggregate that
   For the first reference network, we obtained experimentally                           included the correlation-based methods (Figures 3A,B). The
verified protein interaction partners from the protein interaction                       aggregate-sans-correlation network achieved, on average, 49
network of rice (PRIN) database (Gu et al., 2011). For the second                        and 20% increase in F1 score when tested on the ChIP-
reference network, we used promoters of genes with known                                 seq benchmark and the three reference networks, respectively,
DNA-binding sites of TFs by analyzing the CIS-BP database                                relative to the aggregate that included PCC and SCC. Therefore,
(Weirauch et al., 2014). We created the third reference network                          the aggregate of CLR, ARACNe, and GENIE3 was chosen as the
by linking TFs and non-TFs if they are co-annotated in carefully                         final ‘consensus’ GRN of rice and used in further analysis.
selected, non-redundant Gene Ontology (GO) Biological Process
(BP) terms. For the GO BP reference network, we assumed the
TF and non-TF genes co-annotated to the same BP terms are
                                                                                         Clustering the GRN Identifies Modules of
more likely to have a biological relationship, relative to genes                         Functionally Related and Co-regulated
annotated to distant or unrelated GO BP categories. Although                             Genes
the second and the third reference networks do not guarantee                             Our next objective was to find clusters of co-regulated genes, i.e.,
real biological relationships between TFs and target genes, they                         groups of genes regulated by the same set of TFs. Assuming a
provided us with a valuable resource to include more TFs in the                          guilt-by-association, we expected network clustering to identify
evaluation and gauge the agreement between different data types                          modules of co-regulated, and therefore functionally related
in predicting targets of TFs.                                                            genes. Such modules thereby provide pointers on pathways and
   We asked what fraction of edges present in the three                                  biological processes that could be under the regulatory control
independent reference networks could be predicted by each                                of specific TFs (Hartwell et al., 1999; Segal et al., 2003; Ma et al.,
algorithm in our ensemble. We observed that the CLR algorithm                            2004; Joshi et al., 2009). To achieve such a network clustering,

Frontiers in Genetics | www.frontiersin.org                                          5                                       June 2021 | Volume 12 | Article 652189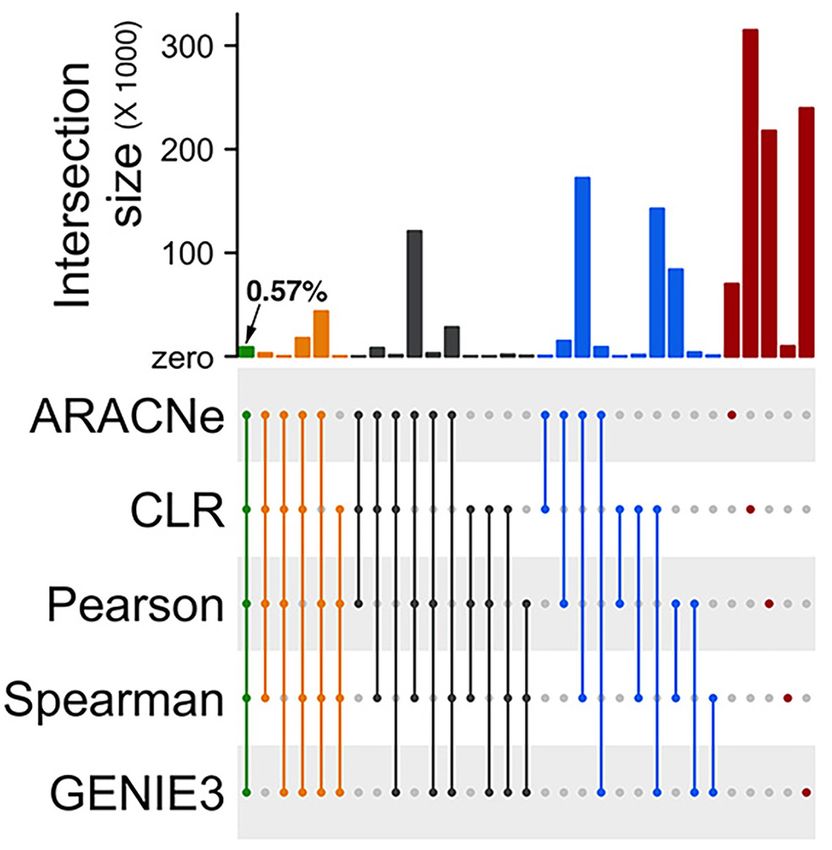
Gupta et al.                                                                                                                   Gene Regulation and Association Network

  FIGURE 3 | Evaluation of the five network prediction algorithms and their aggregate. (A) A ChIP-seq benchmark for 9 TFs was created from publicly available
  datasets. For each of these 9 TFs, we checked the overlap between experimentally validated targets (ChIP-bound genes) and network-predicted targets (genes
  predicted by each of the five algorithms in our ensemble). This evaluation was also made for the consensus network obtained by statistically aggregating the
  predictions from the five algorithms. Each bar plot shows F1 scores (y axis; a measure of performance, the higher the better) of each algorithm (x axis) in correctly
  predicting ChIP-targets of TFs. (B) Due to the unavailability of experimentally validated targets of a large number of TFs in our network, we created additional
  ‘reference networks’ to gauge the quality of the inferred networks. PPI, reference network derived from the predicted protein–protein interaction network of rice
  (PRIN database); GO BP, reference network derived from co-annotations in select gene ontology biological process terms; and CIS BP, reference network obtained
  by utilizing the available putative DNA-binding sites of TFs in the CIS BP database (see “Materials and Methods” for details). The bar plots of F1 scores shows the
  performance of each algorithm in reconstructing the reference networks.

Frontiers in Genetics | www.frontiersin.org                                         6                                             June 2021 | Volume 12 | Article 652189
Gupta et al.                                                                                               Gene Regulation and Association Network

we first linked target genes that had high overlaps between their          Sorting Genes Based on the Magnitude
predicted regulators in the consensus GRN, as done previously              of Differential Expression Is Not a
with the Arabidopsis stress GRN (Vermeirssen et al., 2014).
We then applied the Markov clustering algorithm to this co-                Suitable Approach for Gene Prioritization
regulated gene network (van Dongen and Abreu-Goodger, 2012).               Past genetic research in rice has revealed several examples of
We identified a total of 740 modules, with an average of 45 genes          ‘gold-standard’ drought genes identified by reverse-genetics. This
each (Supplementary Data 2).                                               documented knowledge about the genetic basis of drought is
   To confirm the regulatory association of genes within                   most comprehensive among other abiotic-stresses. It presents us
each module, we analyzed their 1000 bp upstream promoter                   with a unique opportunity to test whether differential expression
regions to check whether putative DNA-binding sites were                   measures can be used as a proxy for gene prioritization.
over-represented. We employed the FIRE (finding informative                We scanned the functional rice gene database (Yao et al.,
regulatory elements) algorithm (Elemento et al., 2007). FIRE               2018), the rice mutant database (Zhang et al., 2006), and the
uses a de novo approach to find short stretches of DNA-                    Oryzabase (Kurata and Yamazaki, 2006). We found 732 genes
sequence motifs that explain promoters’ module-membership                  with genetic evidence of association with drought listed in
(Elemento et al., 2007). Application of the FIRE algorithm                 these knowledgebases. This list of ‘drought associated’ genes
on our network data detected 84 DNA-binding motifs within                  did not represent any particular physiological, morphological,
the co-regulated modules. We observed that more than 50%                   or biochemical phenotype typically measured in the analysis of
of all coregulated modules harbor between five and ten                     drought response. For the sake of convention, we use ‘DR’ as
motifs each (Supplementary Figure 1A), indicating a high                   a broad term to encapsulate various molecular mechanisms by
level of coordination between TFs. We observed that eighty-                which plants adapt, escape, or otherwise tolerate water limiting
one of the FIRE-detected motifs are identical to known                     conditions (Levitt, 1980; Basu et al., 2016). There are currently
plant CREs listed in multiple plant databases and other                    165 DR TFs in this list of known drought genes. We regarded
sources, whereas three are novel DNA motifs (Supplementary                 these 165 TFs as the gold-standard examples of DR, and refer
Figure 1B and Supplementary Data 3). Network analysis of                   to them as DR TFs.
the genes with the three novel motifs suggests that two distinct               Next, we asked how the DR TFs respond to drought in
groups of TF families target them (Supplementary Figure 2).                terms of differential expression. We re-analyzed data from seven
Overall, the over-representation of common plant CREs in                   independently published drought experiments performed on
the promoters of module genes testified that the observed                  multiple varieties, growth stages, and tissues of rice plants (Wang
modules are non-random gene groupings and represent sets of                et al., 2011; Ding et al., 2013; Pabuayon et al., 2016; Mishra
co-regulated genes.                                                        et al., 2018). We estimated genome-wide fold change values
   To further test whether the observed gene modules also                  in each of these datasets, and ranked all TFs based on the
represent a joint biological function, we used function                    absolute values of these fold changes. We observed that, in
annotations from the rice GO BP category and pathway-                      each experiment, the majority of the DR TFs showed minimal
level annotations from Mapman, KEGG, and CYC databases.                    changes (fold change values < 1) regardless of the tissue,
We found statistically significant associations of these functional        growth stage, or the variety of rice plant (Figures 4A,B).
annotations in 31% of all observed modules (hypergeometric                 This suggests that gene prioritization based on differential
test FDR corrected p-values < 0.05). We also found that ∼41%               expression values is constrained by experimental factors and
of all modules we detected in this study were preserved in                 will downplay those that show subtle changes in expression
an independent coexpression network we built earlier with a                but have relevant biological effects. Therefore, we need a more
different dataset and the cluster detection algorithm (Krishnan            sophisticated technique for prioritizing TFs that likely regulate
et al., 2017). Interestingly, 22% of these preserved modules               drought responses in rice.
are the ones that could not be annotated by gleaning function
annotation databases, highlighting significant gaps still exist            Network-Based Supervised Machine
in the current state of function annotations of rice genes
(Supplementary Data 4).
                                                                           Learning Enables Classification and
   We linked TFs to the co-regulated modules, and set the                  Scoring of Drought Resistance
edge-weight according to the Jaccard’s Index (JI) of overlap               Regulators
between the predicted targets of TFs in the consensus GRN                  Our next objective was to develop a network-based gene
and module genes. The JI ranges between 0 and 1, where 0                   prioritization framework that can be objectively tested using
indicates no regulatory association between the corresponding              independent data. We utilized the two good pieces of information
TF-module pair and a JI of 1 indicates a certainly likely regulatory       at hand; a high-quality modular GRN (GRAiN) and a list
association. Therefore, these operations generated a modular               of literature curated gold-standard DR TFs. We posited that
GRN of rice, where TFs are directly linked to target genes and             advanced machine learning models could be trained to recognize
indirectly but quantifiably associated with functional processes.          network patterns in GRAiN that characterize the gold standard
We refer to this network as GRAiN. GRAiN can be searched                   DR TFs. These patterns could then be matched with the
through an online portal (demonstrated in the last section of              patterns of other yet untested TFs and estimate whether they
this manuscript).                                                          resemble the DR TFs.

Frontiers in Genetics | www.frontiersin.org                            7                                     June 2021 | Volume 12 | Article 652189
Gupta et al. Gene Regulation and Association Network FIGURE 4 | Differential expression patterns of gold standard drought regulators. (A) The range of absolute fold-change values (x-axis) of gold standard TFs (y-axis) in three growth stages of Japonica rice variety exposed to drought (data from GSE81253). (B) The range of absolute fold-change values (x-axis) of gold standard TFs (y-axis) in multiple tissues of indica rice variety exposed to drought (data from GSE26280). We chose the support vector machine (SVM), a popular not (see section “Materials and Methods”). We evaluated the binary classification algorithm (Cortes and Vapnik, 1995), to SVM’s accuracy using fivefold cross-validation tests and the area develop the DR classifier. We supplied the SVM with a training under the precision-recall curve (AUC-PR) statistics. The AUC- set of TFs and their connectivity patterns in GRAiN, along PR ranges between 0 and 1, with values closer to 1 indicating with binary labels indicating whether each TF is a DR TF or the model’s superior performance. Our DR classifier achieved Frontiers in Genetics | www.frontiersin.org 8 June 2021 | Volume 12 | Article 652189
Gupta et al.                                                                                                         Gene Regulation and Association Network

an average AUC-PR of 0.81 in 10 independent runs of five-
fold cross-validation tests. We asked if this AUC-PR could be
achieved by randomly picking TFs from the rice genome instead
of using the DR TFs for training. We found the DR classifier’s
AUC-PR to be significantly larger than the AUC-PR of the
classifier trained using randomly picked TFs. Because family
membership could play an essential role in TF function, we
also tested the AUC-PR of the classifier trained by randomly
picking TFs while maintaining the family distribution as that
of the DR TFs. We observed that the AUC-PR of this classifier
was not different than the random classifier, indicating that
family memberships of TFs is not indicative of their roles under
drought (Figure 5A).
   We applied the cross-validated SVM model to the whole
network of 2160 TFs. We used the model’s output – which
represented the model’s confidence in its classification of a TF as a
DR TF – to rank each TF. We then scaled the ranks within a range
of 0 and 1 to make the ranks more interpretable, and referred to
the resulting scores as drought scores (DS). The TFs with DS close
to 1 have the strongest predicted association with DR, while TFs
with relatively smaller DS values are less likely to be associated
with DR (Supplementary Data 5).
   To evaluate this scoring scheme objectively, we asked if
the occurrence of drought can be inferred by the transcript
abundance of TFs with the largest DS. In other words, we wanted
to check if the intrinsic expression levels of TFs with high DS
can indicate if a plant has sensed drought or not. Operationally,
this technique is similar to the ones used in developing clinical
diagnostic models that seek to classify human patient samples as
disease or healthy based on the expression levels of marker genes.
To perform such an evaluation of our model, we downloaded
and reanalyzed the recently published RNA-seq dataset of 214                 FIGURE 5 | Cross-validation of the network-based classifier. (A) Boxplots
                                                                             showing the distribution of the area under the precision-recall curve (AUC-PR;
seedling samples (71 drought samples and 143 control samples)
                                                                             y-axis) in ten independent runs of fivefold cross-validation tests of the classifier
from four different rice varieties (Wilkins et al., 2016). Assuming          trained using gold standard drought TFs (shaded gray), the classifier trained
the first decile TFs in our predictions as ‘drought markers’,                using randomly picked TFs instead of gold standard TFs (shaded white), and
we asked whether the intrinsic expression levels (measured as                the classifier trained using randomly chosen TFs but from the same families
transcripts per million units) of these drought markers can                  like that of the gold standard examples (shaded black). The non-overlapping
                                                                             notches in the boxplots indicate significant differences in the median AUC-PR
predict a sample in the Wilkins dataset as control or drought.
                                                                             for all three classifiers. (B) TFs were sorted according to their decreasing order
   We observed that RNA-seq sample classification accuracy was               of drought scores assigned by the final classifier and grouped into 100
almost perfect when we used the intrinsic expression of top decile           equal-sized bins. Expression levels (transcript per million units) of TFs in each
TFs as features. However, this accuracy gradually decreased as we            bin were then used as features to classify a set of labeled RNA-seq samples
moved toward lower decile TFs (Figure 5B). We observed that                  as drought or control (data from GSE74793). Each boxplot shows the
                                                                             distribution of AUC-ROC (x-axis) from threefold cross-validation tests in
the expression levels of TFs in the last decile was least accurate           groups of ten bins, with lower-numbered bins (y-axis) indicating TFs with
in classifying a sample as drought or control (Figure 5B). This              higher drought scores. The black dotted line connects the mean of each
analysis suggests that the top-scoring TFs are likely responsible            decile’s AUC-ROC scores, indicating decreasing AUC-ROC with lower
for causing the transcriptional-level changes that occur under               drought scores.
drought, and therefore validates our ranking approach.

                                                                            classification of DR TFs in our model. We selected top ‘drought
Predicted Regulators of Drought                                             modules’ using the ‘feature importance’ scores from the model
Resistance Are Involved in                                                  output (Supplementary Data 6). We extracted all TF and
Hormone-Mediated Responses                                                  CREs linked with these drought modules and explored the
It is important to note that the DS we predicted and the out-               interconnected network in Cytoscape (Shannon et al., 2003;
degree of TFs in the network are not correlated (Supplementary              Supplementary Figure 4).
Figure 3), indicating that the predicted DS do not merely                      Exploring this network, we found that the drought modules
reflect on the ‘hubbiness’ of TFs. We investigated the few                  comprise a total of 6968 genes that form core communities
modules (features) that served as the best predictors for the               enriched in several stress response pathways and biological

Frontiers in Genetics | www.frontiersin.org                             9                                               June 2021 | Volume 12 | Article 652189
Gupta et al. Gene Regulation and Association Network
FIGURE 6 | Functional characterization of predicted drought resistance transcription factors. A subset of modules with the highest feature importance scores from
the drought classifier were extracted and labeled as ‘drought modules.’ The drought modules consist of a total of ∼6000 genes. The network shows the top 5%
edges induced between them. Every circle is a functional gene, and triangles are TFs. Genes within a module are similarly colored, and the GO BP enriched within
each module is labeled with the same color in the text. Modules with no statistically enriched GO BP terms are colored gray.
processes (Figure 6). Interestingly, we found that the drought response machinery in rice ubiquitous and specific to land
module are enriched with genes annotated to secondary plants (Wang et al., 2015). Therefore, we pursued this lead and
metabolism pathways broadly related to hormonal signal examined if the orthologs of rice TFs with high DS in our study
transduction, such as phenylpropanoid biosynthesis and have conserved responses to drought exposure.
jasmonic acid biosynthesis. These are traits specific to land plants We created three sets of Arabidopsis drought TFs with known
and is believed to have played an essential role in the adaption of orthologs in rice. The first set was differentially expressed TFs in
plants to water limiting environments (Kenrick and Crane, 1997; response to mild and severe drought stress we reported previously
Emiliani et al., 2009; Wang et al., 2015; Ahammed et al., 2016; (Harb et al., 2010). The second set comprised experimentally
Verma et al., 2016), given its role in lignin biosynthesis (Fraser verified drought TFs in the Arabidopsis phenotype database
and Chapple, 2011). Other relevant GO biological process terms (Lloyd and Meinke, 2012). The third list of TFs was previously
such as ‘response to water,’ ‘response to abscisic acid stimulus,’ predicted to be involved in mild drought responses (Clauw et al.,
‘cellulose biosynthesis,’ ‘flavonol biosynthesis,’ and ‘trehalose 2016). We asked if the rice orthologs of these three sets of
biosynthesis’ were also recovered within the drought modules. Arabidopsis TFs have higher DS than the background of all
We found that the most prominent de novo predicted remaining TFs that did not become a part of the three sets
CREs within the drought modules are related to the abscisic (either due to biological variability or due to lack of ortholog
acid response complex ABRE3HVA22 (Shen et al., 1996) identity). In all three sets, we observed a significantly larger
and the vascular-specific motif ACIIPVPAL2 (Hatton et al., mean DS of orthologous TFs compared to the background
1995), along with the light-responsive GT-1 motif (Lam and (Figure 7A). Similarly, we observed that rice TFs with orthologs
Chua, 1990), the anaerobic-responsive motif GCBP2ZMGAPC4 that differentially expressed in response to the application of
(Geffers et al., 2000) and the dehydration responsive DREB1A drought stress in cobs and leaves of maize (Kakumanu et al.,
motif (Maruyama et al., 2004; Supplementary Data 3). 2012), leaves of barley (Cantalapiedra et al., 2017), and leaves of
sorghum, have significantly larger mean DS than the mean DS of
the background (Figure 7B).
Predicted Drought Scores Are We also asked if the predicted DS and evolutionary age of a
Associated With Evolutionary Features TF are related. We first ordered all rice genes in 13 age groups
The enrichment of genes related to the abscisic acid and (phylostrata) starting from the oldest (i.e., genes conserved across
salicylic acid pathways, along with jasmonate signaling pathways, all cellular life) to the youngest (i.e., genes that appeared in
as well as some of the observed CREs (e.g., vascular-specific the terminal clade Oryza) (Wang et al., 2018). Plotting the
ACIIPVPAL2) within the drought modules indicated a drought distribution of DS of TFs within each phylostrata (PS) showed
Frontiers in Genetics | www.frontiersin.org 10 June 2021 | Volume 12 | Article 652189Gupta et al. Gene Regulation and Association Network
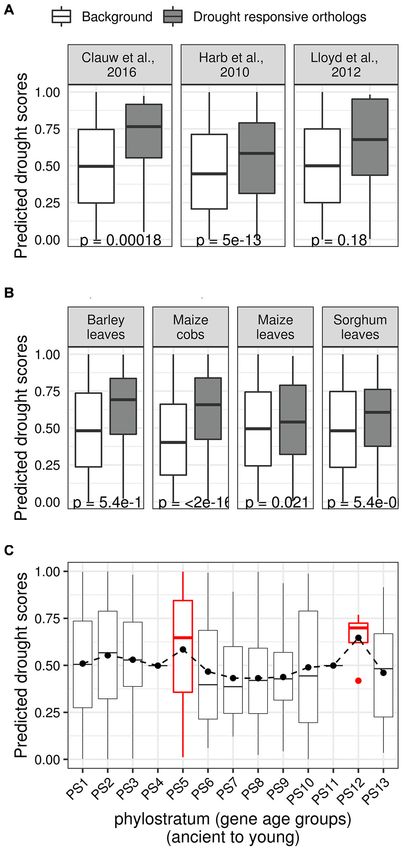
two prominent peaks. The first peak in PS5, which corresponds
with the Embryophytes (land plants) clade, and the second peak
in PS12, which coincides with the Oryza clade, both mirror
significant events in the evolutionary history of rice (Figure 7C).
We also examined the available pan-genome of rice (Sun et al.,
2017) to investigate the distribution of DS of TFs that arose in the
terminal clade (O. sativa, closely related rice varieties). However,
we did not find any significant differences in DS between core
and distributed TFs, or TFs that are Indica- or Japonica-dominant
(Supplementary Figure 5).
Overall, our analysis suggests that a large fraction of high-
scoring DR TFs possibly played a crucial role in driving critical
adaptations of land plants. A few high-scoring TFs that emerged
specifically in rice might be involved in recent morphological
adaptions that contribute to DR (e.g., panicle architecture,
pollen and seed development). Therefore, it would be interesting
to analyze the drought phenotypes of mutants lacking these
high-scoring TFs specific to rice.
Predicted Drought Scores and Structural
Characteristics Are Related
Recent studies in rice and other organisms suggest that
younger genes have relatively simple exon/intron and protein
structure (Neme and Tautz, 2013; Cui et al., 2015; Wang
et al., 2018). Other studies have shown that simple genes, for
example, those that lack introns, are rapidly regulated (Jeffares
et al., 2008; Speth et al., 2018). Such genes represent an
essential component of the possibly conserved stress response
machinery in land plants (Jeffares et al., 2008; Zhu et al., 2016;
Morozov and Solovyev, 2019).
Following this lead, we next investigated if the predicted DS
of TFs and their structural attributes are related since a large
fraction of high-scoring TFs our analysis also appear to have
first emerged in land plants. We started with examining the
family memberships of TFs. We found a statistically significant
enrichment of WRKY, Tify, NAC, MYB, and AP2/ERF families
among the top 10% TFs with the largest DS (Top decile; FDR
corrected hypergeometric test p values < 0.1) (Figure 8A). These
gene families are well-known to associate with drought stress
in multiple crops (Yu et al., 2012; Gahlaut et al., 2016; Hoang
FIGURE 7 | Relationships between predicted drought scores and evolutionary
features. (A) Three sets of putative drought regulators in Arabidopsis were et al., 2017). In contrast, we found that TFs with the smallest
curated from the literature, and their rice orthologs were identified. The three DS (bottom decile) are enriched in growth and development
sets represent rice TFs with orthologs in Arabidopsis genes that were associated gene families such as the MADS, FAR1, and TRAF
predicted as drought regulators (Clauw et al., 2016), that differentially (Smaczniak et al., 2012; Tedeschi et al., 2017; Ma and Li, 2018).
expressed upon different drought treatment regimes (Harb et al., 2010), have
We observed the top decile TFs (top 10% TFs with highest DS)
been experimentally characterized as drought regulators (Lloyd and Meinke,
2012). The boxplots show the distribution of the predicted drought scores of have relatively fewer InterPro protein domain annotations than
these ortholog sets (gray) along with the drought scores of the background of the background of all TFs in the remaining deciles (remaining
remaining TFs (white; rice TFs that did not become part of the three ortholog 90% TFs with relatively smaller DS) (Figure 8B). We also
sets). In each case, the median predicted drought scores of orthologous rice observed that the top decile TFs have significantly smaller average
TFs was found to be significantly higher than the drought scores of the
background. (B) Similarly, boxplots showing the distribution of drought scores
gene length, average CDS length, and average intron length
of rice TFs with orthologs in genes that are differentially expressed in different (Figure 8C) compared to the background of remaining deciles.
crop datasets. (C) Box plot showing the distribution of drought scores in This indicates that TFs with high DS are small genes with
different age groups (ancient to young) according to NCBI taxonomic simple structures.
classification. The distribution of drought scores stays relatively flat, except for
Overall, our analysis suggests that TFs that likely regulate
two peaks that correspond to the Embryophytes clade (PS5) and the Oryza
clade (PS12).
DR in rice have peculiar functional, structural, and evolutionary
characteristics. It is interesting to see such grouping in our data,
Frontiers in Genetics | www.frontiersin.org 11 June 2021 | Volume 12 | Article 652189Gupta et al. Gene Regulation and Association Network
FIGURE 8 | Structural features of transcription factors with the highest drought scores. (A) A heatmap showing the enrichment of gene families in the first and last
decile TFs (top 10% and bottom 10% drought scores). Each grid in the heatmap shows the FDR corrected -log (p-value, Fisher’s exact test) of the gene family on the
x-axis for the decile on the y axis. (B) Boxplots showing that top decile TFs contain a significantly different number of protein domains compared to the background
of TFs in the remaining deciles. (C) Boxplots showing that the top decile TFs have significantly smaller average gene length, coding sequence length (CDS), and
intron length compared with the background of remaining TFs.
given that the underlying network using which we made our analysis tool is used to find co-regulated modules (defined in
predictions started with unclassified gene expression data. this study) over-represented in the query genes. Significantly
enriched modules are presented back to the user, along with
functional (GO BP and Mapman annotations) and cis-regulatory
The GRAiN Web Application Is for annotations (FIRE-identified CREs and weighted links to TFs).
Experimental Rice Biologists; Using We chose the rice transcription factor OsbHLH148
OsbHLH148 as an Example (LOC_Os03g53020) to demonstrate the GRAiN web application
We used the R Shiny framework to develop a user-friendly features. OsbHLH148 was initially present in our list of gold
web application that allows users to interact with GRAiN and standard drought regulators, as it was earlier reported to be
predictions on DR TFs. There are currently two main features of involved in the regulation of drought response via the jasmonic
the GRAiN web application active at http://rrn.uark.edu/shiny/ acid pathway (Seo et al., 2011). However, instead of using it as
apps/GRAiN/. It allows users to search for a single TF gene of a DR TF in the training set, we kept it a hidden example and
interest. In this case, the GRAiN algorithm first retrieves all the treated it as an unlabeled TF throughout model training and
genes predicted as targets of the query TF and then uses the evaluation. Since OsbHLH148 was already being studied in our
inbuilt enrichment analysis tool to find pathways and biological laboratory, our intention behind removing it from the training
processes over-represented in the predicted targets. The second data was to repurpose its phenotypic and RNA-seq data for
feature of the GRAiN application allows users to query a set experimental validations of the GRAiN web application and
of genes instead of a single TF. In this case, the enrichment the DR classifier.
Frontiers in Genetics | www.frontiersin.org 12 June 2021 | Volume 12 | Article 652189Gupta et al. Gene Regulation and Association Network
Our model strongly predicted the association of OsbHLH148 (Figure 9J), testify that OsbHLH148 is involved in grain yield
to DR, assigning it a DS of 0.99 and placing it at rank # 4 under drought stress.
among all rice TFs. We asked if the GRAiN web application Next, we tested whether GRAiN correctly predicted the
can recover the known functional associations of OsbHLH148. interaction of OsbHLH148 with OsRAP2.6 and DREB1B TFs.
The GRAiN query shows 385 genes predicted as targets of An electrophoretic mobility shift assay (EMSA) confirmed
OsbHLH148 (Supplementary Data 7a). Enrichment results that bHLH148 binds to the promoters of OsRAP2.6
show that these predicted target genes participate in the (LOC_Os08g36920) and OsDREB1B (LOC_Os09g35010)
jasmonic acid-mediated signaling pathway and response to salt genes. We then used the steroid receptor-based inducible system
and osmotic stresses (Supplementary Data 7b), in agreement to confirm that OsbHLH148 directly activates the expression
with its previously validated function by Seo et al., 2011. of OsRAP2.6, while activation of OsDREB1B by OsbHLH148
We observed that OsbHLH148 is potentially involved in the requires additional factors (Figures 9K,L).
regulation of ∼54% of genes in the module it is a part of We also wanted to check if the other remaining genes
(M0009; jasmonic-acid biosynthesis genes), indicating it acts predicted by GRAiN as targets of OsbHLH148 are correct.
as a hub in the local subnetwork. Additionally, we found 81 To confirm this, we performed gene expression profiling of
TFs among the predicted targets of OsbHLH148 and ∼82% bhlh148 and WT plants under WW and controlled drought
of these TFs have more than one known bHLH binding stress conditions using mRNA sequencing (see Supplementary
site (50 -CANNTG-30 ) within the 1000 bp upstream promoters Methods). We used leaf tissue from plants maintained at 100
(Supplementary Data 7c). This indicated that most predicted and 40% FC for 10 days as WW and controlled drought
targets of OsbHLH148 are more likely to be downstream targets. stress samples, respectively. We estimated the differential
Other TFs with no bHLH DNA-binding sites could be potentially expression of genes that (1) responded to the knockout, and
be components of a larger co-activator complex. Among the (2) responded specifically to the interaction of mutant with
predicted targets, we found three of the five TFs previously drought (subtracting the WT effect of drought from the mutant)
shown to interact with OsbHLH148 using Y2H assays (Seo (Supplementary Data 8). We found a relatively low overlap
et al., 2011). Among other predicted targets, OsRAP2.6 (also (Gupta et al. Gene Regulation and Association Network
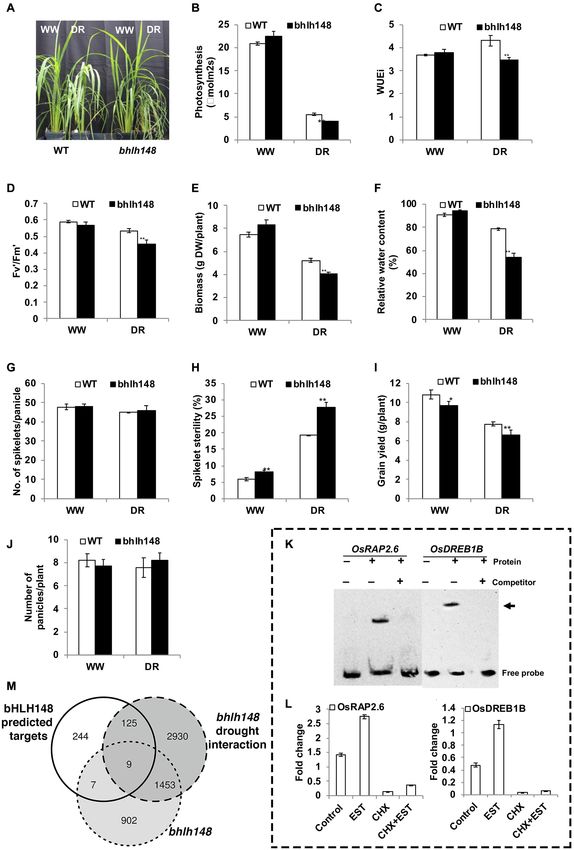
FIGURE 9 | Phenotyping bHLH148 as experimental validation of the GRAiN web application. OsbHLH148 was strongly predicted for association with drought by
our network-based SVM classifier. We queried OsbHLH148 in the GRAiN web application and sought to test the predictions experimentally. (A) Increased sensitivity
of bhlh148 mutant plants under controlled drought stress conditions. Forty-five-day old plants were maintained at 100% (well-watered – WW) and 40% (drought –
DR) FC (field capacity) for 10 days by a gravimetric approach, and performance was measured at the end of the stress period. (B–F) The phenotype of the WT
(Continued)
Frontiers in Genetics | www.frontiersin.org 14 June 2021 | Volume 12 | Article 652189Gupta et al. Gene Regulation and Association Network FIGURE 9 | Continued and bhlh148 mutant plants under drought stress. (B) Assimilation rate, (C) instantaneous water use efficiency (WUEi), (D) the efficiency of Photosystem II in light-adapted leaves, (E) above-ground biomass (dry weight), and (F) relative water content (RWC). Gas exchange measurements were taken using a portable photosynthesis system LI-6400XT at a CO2 concentration of 370 µmol/mol and light intensity of 1000 µmol/m2 /s. The data are the means ± SE (n = 10) and significance using the t-test (**P ≤ 0.01). (G–J) Reduced grain yield of bhlh148 plants under well-watered as well as drought stress conditions. Drought stress was applied by withholding irrigation at the R3 stage for 4–8 days until the leaves roll and wilt, followed by re-watering and maintaining under well-watered conditions until physiological maturity. Yield components were measured under well-watered and drought stress conditions at physiological maturity. (G) the number of spikelets, (H) percent spikelet sterility, (I) grain yield, and (J) the total number of panicles. The data are means ± SE (n = 6) and significance using t-test (*P ≤ 0.05 and **P ≤ 0.01). (K,L) Experimental validation of predicted OsbHLH148 targets predicted from the GRAiN web application. (K) Electrophoretic mobility shift assay (EMSA) was performed with bHLH148 protein and biotin-labeled promoter elements of potential bHLH148 regulated genes. bHLH148-6xHis recombinant protein was incubated with promoter elements at room temperature for 20 min. For competition analysis, the binding reaction was incubated for 10 min on ice before adding 100-fold excess of unlabeled promoter elements, followed by incubation at room temperature for 20 min. The samples were subjected to EMSA by PAGE and subsequent chemiluminescence detection. + and - indicate the presence and absence of the respective component in the binding reaction. Arrows indicate the labeled “free probe” and DNA-protein complex “bound probe” positions. (L) Direct activation of OsRAP2.6 and OsDREB1B by bHLH148. Rice protoplasts were transfected with a bHLH148-HER fusion construct driven by the CaMV35S promoter. Transfected protoplasts were treated with estradiol (EST), cycloheximide (CHX), or EST and CHX together. The expression levels of OsRAP2.6 and OsDREB1B in control and treated protoplast was analyzed by qPCR and shown for RAP2.6 and OsDREB1B. Each data point is mean values ± SE of three biological replicates. (M) Venn diagram showing overlaps between GRAiN predicted targets of OsbHLH148 and genes that are differentially expressed in the mutant as well the mutant treated with drought. Our study agrees with the previous reports which claimed range of clustering parameters). We found that module-based that rather than using a single algorithm, an ensemble-centric network inference algorithms generally have a more considerable approach improves the GRN inference performance. Adding computational burden (data not shown), especially on the diverse methods to an ensemble of network prediction methods relatively larger rice gene expression matrices. Other algorithms should, theoretically, stabilize biologically relevant relationships that use an integrative or supervised approach could also not be between TFs and target genes (Marbach et al., 2012). We observed used in our study (Bonneau et al., 2006; Banf and Rhee, 2017; this phenomenon in our study, as the consensus predictions from Zarayeneh et al., 2017). This is because the only other mutually the five network prediction algorithms outperformed individual exclusive datatype available for integration is the sequence-based methods (Figure 3). Interested researchers who wish to apply this DNA motif data. However, unlike expression patterns, most DNA consensus approach should also note that having more ensemble binding motifs of rice TFs are not experimentally determined algorithms does not guarantee superior network inference but predicted based on homologies. Also, a large fraction of performance. The correct combination of methods will depend rice TFs do not even have their corresponding binding sites on several factors, including the dimensions and the nature of the predicted. Therefore, using DNA-motif data only to gauge the underlying dataset. In our study, removing the two correlation- quality of the networks we predicted, but not the network based methods from the ensemble seems to have improved inference itself, kept us in line with our goal of including as many the final network’s performance in the experimental benchmark genes as possible. (ChIP-seq data) and not the two secondary reference networks We named our network GRAiN. GRAiN is essentially a (Figure 3). This could be explained by the fact that simple bipartite network as it has two types of nodes (TFs and modules). correlation-based methods are prone to a high accumulation Our final goal was to develop an algorithm that uses machine of false positives arising from indirect correlations. The other learning to identify GRAiN patterns that characterize a particular three algorithms (CLR, GENIE3, and ARACNe) are specially set of nodes with verifiable attributes (gold standard TFs). designed to attenuate this problem. Using a consensus of only To select our gold standard, we surveyed various phenotype these three were better able to detect direct regulatory edges databases. Our survey shows that while currently ∼2% (1098 at represented by ChIP-seq data. The ad hoc reference networks, the time of this study) of all known rice genes have been on the other hand, might contain several false positives because linked to various abiotic stresses experimentally, more than they were built from derived data rather than direct experimental 15% of these stress genes are TFs linked with drought or evidence. Therefore, removing the correlation-based methods water deficit related responses. Our survey suggests that the from the ensemble barely made any difference when tested genetic selection of favorable alleles of the stress-inducible on this benchmark. TFs has been widely and inadvertently used as a tool to Several other algorithms not used in our study can improve/select for drought tolerance. We listed 165 TFs linked potentially further improve the ensemble’s diversity. For example, with drought to train the machine learning algorithm. Our module-based algorithms first apply clustering algorithms observations that most of these gold-standard drought regulators to the expression data and then assign regulators to the do not show sizeable differential expression patterns under identified modules. While such an approach can potentially drought further motivated us to develop such a computational retrieve targets of TFs with less correlated expression profiles model (Figure 4). (De Smet and Marchal, 2010), there are several places in the Our framework funnels an inferred modular GRN into the module-based inference workflows where subjective biases can SVM that learned to discriminate between real drought TFs from be introduced (e.g., the choice of the number of clusters to those that are likely not regulators of drought, based on their extract, which should ideally be chosen by thorough testing a network connectivity patterns. Our model’s application ranked Frontiers in Genetics | www.frontiersin.org 15 June 2021 | Volume 12 | Article 652189
You can also read