The 3D Model Acquisition Pipeline
←
→
Page content transcription
If your browser does not render page correctly, please read the page content below
Volume 21 (2002), number 2 pp. 149–172                                               COMPUTER GRAPHICS                   for um

                            The 3D Model Acquisition Pipeline
                                            Fausto Bernardini and Holly Rushmeier

                            IBM Thomas J. Watson Research Center, Yorktown Heights, New York, USA

      Abstract
      Three-dimensional (3D) image acquisition systems are rapidly becoming more affordable, especially systems
      based on commodity electronic cameras. At the same time, personal computers with graphics hardware capable
      of displaying complex 3D models are also becoming inexpensive enough to be available to a large population.
      As a result, there is potentially an opportunity to consider new virtual reality applications as diverse as cultural
      heritage and retail sales that will allow people to view realistic 3D objects on home computers.
      Although there are many physical techniques for acquiring 3D data—including laser scanners, structured light
      and time-of-flight—there is a basic pipeline of operations for taking the acquired data and producing a usable
      numerical model. We look at the fundamental problems of range image registration, line-of-sight errors, mesh
      integration, surface detail and color, and texture mapping. In the area of registration we consider both the
      problems of finding an initial global alignment using manual and automatic means, and refining this alignment
      with variations of the Iterative Closest Point methods. To account for scanner line-of-sight errors we compare
      several averaging approaches. In the area of mesh integration, that is finding a single mesh joining the data from
      all scans, we compare various methods for computing interpolating and approximating surfaces. We then look
      at various ways in which surface properties such as color (more properly, spectral reflectance) can be extracted
      from acquired imagery. Finally, we examine techniques for producing a final model representation that can be
      efficiently rendered using graphics hardware.
      Keywords: 3D scanning, range images, reflectance models, mesh generation, texture maps sensor fusion
      ACM CSS: I.2.10 Vision and Scene Understanding—Modeling and recovery of physical attributes, shape,
      texture; I.3.5 Computational Geometry and Object Modeling—Geometric algorithms, languages and systems;
      I.3.7 Three-Dimensional Graphics and Realism—Color, shading, shadowing, and texture; I.4.1 Digitization and
      Image Capture—Reflectance, sampling, scanning

1. Introduction                                                          Three-dimensional scanning has been widely used for
                                                                      many years for reverse engineering and part inspection [1].
The past few years have seen dramatic decreases in the cost           Here we focus on acquiring 3D models for computer
of three-dimensional (3D) scanning equipment, as well as in           graphics applications. By 3D model, we refer to a numerical
the cost of commodity computers with hardware graphics                description of an object that can be used to render images
display capability. These trends, coupled with increasing             of the object from arbitrary viewpoints and under arbitrary
Internet bandwidth, are making the use of complex 3D                  lighting conditions. We consider models that can be used
models accessible to a much larger audience. The potential            to simulate the appearance of an object in novel synthetic
exists to expand the use of 3D models beyond the well                 environments. Furthermore, the models should be editable
established games market to new applications ranging from             to provide the capability of using existing physical objects as
virtual museums to e-commerce. To realize this potential,             the starting point for the design of new objects in computer
the pipeline from data capture to usable 3D model must be             modeling systems. The geometry should be editable—i.e.
further developed. In this report we examine the state of the         holes can be cut, the object can be stretched, or appended
art of the processing of the output of range scanners into            to other objects. The surface appearance properties should
efficient numerical representations of objects for computer           also be editable—i.e. surfaces can be changed from shiny to
graphics applications.                                                dull, or the colors of the surface can be changed.

c The Eurographics Association and Blackwell Publishers Ltd
2002. Published by Blackwell Publishers, 108 Cowley Road,
Oxford OX4 1JF, UK and 350 Main Street, Malden, MA 02148,
USA.                                                            149
150                                        F. Bernardini and H. Rushmeier / 3D Model Acquisition

   To achieve this flexibility in the use of scanned objects, we             Range                                     Intensity
consider systems which output shape in the form of clouds of                 images                                     images
points that can be connected to form triangle meshes, and/or
fitted with NURBS or subdivision surfaces. The 3D points
are augmented by additional data to specify surface finish                                                      Texture-to-geometry
                                                                          Registration
and color. With the exception of surfaces with relatively                                                           registration
uniform spatial properties, fine scale surface properties such
as finish and color are ultimately stored as image maps
covering the geometry.
                                                                       Line-of-sight error                          Computation of
   The shape of 3D objects may be acquired by a variety                  compensation                           illumination invariants
of techniques, with a wide range in the cost of the acqui-
sition hardware and in the accuracy and detail of the ge-
ometry obtained. On the high cost end, an object can be
                                                                       Integration of scans
CAT scanned [2], and a detailed object surface can be ob-
                                                                        into a single mesh
tained with isosurface extraction techniques. On the low cost
end, models with relatively sparse 3D spatial sampling can
be constructed from simple passive systems such as video
streams by exploiting structure from motion [3], or by ob-             Postprocessing and                             Texture map
serving silhouettes and using space carving techniques [4].             parameterization                             reconstruction

  In this report we focus on scanning systems that capture
range images—that is an array of depth values for points on
the object from a particular viewpoint. While these scanners
                                                                                              Textured Model
span a wide range of cost, they are generally less expensive
and more flexible than full 3D imaging systems such as
                                                                     Figure 1: The sequence of steps required for the reconstruc-
CAT scanners, while obtaining much more densely sampled
                                                                     tion of a model from multiple overlapping scans.
shapes than completely passive systems. We briefly review
various types of range image scanners, and the principles
they work on. However, for this report we consider a range
scanner as a generic component, and consider the model               pattern formed by an ordinary light source passing through
building process given range images as input.                        a mask or slide. A sensor, frequently a CCD camera, senses
                                                                     the reflected light from the object. Software provided with
   The process of building models from a range scanning
                                                                     the scanner computes an array of depth values, which can
system is shown in Figure 1. There are fundamentally two
                                                                     be converted to 3D point positions in the scanner coordinate
streams of processing—one for the geometry, and one for the
                                                                     systems, using the calibrated position and orientation of the
fine scale surface appearance properties. As indicated by the
                                                                     light source and sensor. The depth calculation may be made
dotted lines, geometric and surface appearance information
                                                                     robust by the use of novel optics, such as the laser scanning
can be exchanged between the two processing streams to
                                                                     systems developed at the National Research Council of
improve both the quality and efficiency of the processing of
                                                                     Canada [5]. Alternatively, calculations may be made robust
each type of data. In the end, the geometry and fine scale
                                                                     by using multiple sensors [6]. A fundamental limitation of
surface appearance properties are combined into a single
compact numerical description of the object.                         what can be scanned with a triangulation system is having
                                                                     an adequate clear view for both the source and sensor
                                                                     to see the surface point currently being scanned. Surface
2. Scanning Hardware                                                 reflectance properties affect the quality of data that can be
Many different devices are commercially available to obtain          obtained. Triangulation scanners may perform poorly on
range images. Extensive lists of vendors are maintained at           materials that are shiny, have low surface albedo, or that
various web sites. To build a model, a range scanner can be          have significant subsurface scattering.
treated as a “black box” that produces a cloud of 3D points. It
                                                                        An alternative class of range scanners are time-of-flight
is useful however to understand the basic physical principles
                                                                     systems. These systems send out a short pulse of light, and
used in scanners. Characteristics of the scanner should be
                                                                     estimate distance by the time it takes the reflected light
exploited to generate models accurately and efficiently.
                                                                     to return. These systems have been developed with near
  The most common range scanners are triangulation                   real time rates, and can be used over large (e.g. 100 m)
systems, shown generically in Figure 2. A lighting system            distances. Time-of-flight systems require high precision in
projects a pattern of light onto the object to be scanned—           time measurements, and so errors in time measurement
possibly a spot or line produced by a laser, or a detailed           fundamentally limit how accurately depths are measured.


                                                                    c The Eurographics Association and Blackwell Publishers Ltd 2002
F. Bernardini and H. Rushmeier / 3D Model Acquisition                                        151

                                                                     may only be able to acquire data for points spaced millime-
                                                                     ters apart on the surface. Resolution provides a fundamen-
                                                                     tal bound on the dimensions of the reconstructed surface
                                                                     elements, and dictates the construction of intermediate data
                                                                     structures used in forming the integrated representation.
                                                                       Range scanners do not simply provide clouds of 3D
                                                                     points [7], but implicitly provide additional information.
                                                                     Simply knowing a ray from each 3D point to the scanning
                                                                     sensor indicates that there are no occluding surfaces along
                                                                     that ray, and provides an indicator of which side of the
                                                                     point is outside the object. Since range images are organized
                                                                     as two-dimensional (2D) arrays, an estimate of the surface
                                                                     normal at each point can be obtained by computing vector
                                                                     cross products for vectors from each point to its immediate
                                                                     neighbors. These indicators of orientation can be used to
                                                                     more efficiently reconstruct a full surface from multiple
                                                                     range images.
Laser projector                                  CCD sensor
                                                                     3. Registration
Figure 2: Principles of a laser triangulation system. A laser
projector shines a thin sheet of light onto the object. The          For all but the simplest objects, multiple range scans must be
CCD sensor detects, on each scan line, the peak of reflected         acquired to cover the whole object’s surface. The individual
laser light. 3D point positions are computed by intersecting         range images must be aligned, or registered, into a common
the line through the pixel with the known plane of laser light.      coordinate system so that they can be integrated into a single
                                                                     3D model.
                                                                        In high-end systems registration may be performed by
   Basic characteristics to know about a range scanner are           accurate tracking. For instance, the scanner may be attached
its scanning resolution, and its accuracy. Accuracy is a             to a coordinate measurement machine that tracks its position
statement of how close the measured value is to the true             and orientation with a high degree of accuracy. Passive
value. The absolute accuracy of any given measurement is             mechanical arms as well as robots have been used. Optical
unknown, but a precision that is a value for the standard            tracking can also be used, both of features present in the
deviation that typifies the distribution of distances of             scene or of special fiducial markers attached to the model or
the measured point to true point can be provided by the              scanning area.
manufacturer. The tests used by manufacturers to determine
                                                                        In less expensive systems an initial registration is found by
precision are based on standard tests for length measurement
                                                                     scanning on a turntable, a simple solution that limits the size
developed for coordinate measurement machines or survey-             and geometric complexity of scanable objects (they must fit
ing applications, depending on the scale of the application.         on the turntable and the system provides only a cylindrical
The absolute value of error increases with distance between          scan which cannot re-construct self-occluding objects), and
the scanner and object. The deviation of measurements is             that leaves unsolved the problem of registration for scans
a thin ellipsoid rather than a sphere—the error is greatest          of the top and bottom of the object. Many systems rely on
along the line-of-sight of the sensor. The precision of the          interactive alignment: a human operator is shown side-by-
measurements may vary across a range image. There are                side views of two overlapping scans, and must identify three
some effects that produce random errors of comparable                or more matching feature points on the two images which are
magnitude at each point. Other effects may be systematic,            used to compute a rigid transformation that aligns the points.
increasing the error towards the edges of the scan. Because
models are built from points acquired from many different               Automatic feature matching for computing the initial
range images, it is important to understand the relative             alignments is an active area of research (recent work
reliability of each point to correctly combine them.                 includes [8–12]). The most general formulation of the
                                                                     problem, that makes no assumptions on type of features
  Resolution is the smallest distance between two points             (in the range and/or associated intensity images) and
that the instrument measures. The accuracy of measured 3D            initial approximate registration is extremely hard to solve.
points may be different than the resolution. For example, a          Approximate position and orientation of the scanner can be
system that projects stripes on an object may be able to find        tracked with fairly inexpensive hardware in most situations,
the depth at a particular point with submillimeter accuracy.         and can be used as a starting point to avoid searching a large
However, because the stripes have some width, the device             parameter space.


                                                                   c The Eurographics Association and Blackwell Publishers Ltd 2002
152                                        F. Bernardini and H. Rushmeier / 3D Model Acquisition

3.1. Registration of two views

Neither the controlled motion nor the feature matching
techniques can usually achieve the same degree of accuracy
as the range measurements. The initial alignment must                                                  q
therefore be refined by a different technique. The most
successful approach to solve this problem has been the                                                                     Q         P
                                                                                                        p
Iterative Closest Point (ICP) algorithm, originally proposed
by Besl and McKay [13], Chen and Medioni [14], and                   Figure 3: One step of the ICP algorithm. Point matches
Zhang [15].                                                          are defined based on shortest Euclidean distance. Scan P is
                                                                     then transformed to minimize the length of the displacement
   The ICP algorithm consists of two steps: in the first step,       vectors, in the least-squares sense.
pairs of candidate corresponding points are identified in
the area of overlap of two range scans. Subsequently, an
optimization procedure computes a rigid transformation that                                                                Q
reduces the distance (in the least-squares sense) between
                                                                                                                                P
the two sets of points. The process is iterated until some
convergence criterion is satisfied. The general idea is that at                                        q'
                                                                                             q
each iteration the distance between the two scans is reduced,
allowing for a better identification of true matching pairs,
and therefore an increased chance of a better alignment at                                         p
the next iteration. It has been proved [13] that the process
converges to a local minimum, and in good implementations            Figure 4: In Chen and Medioni’s method, a matching pair is
it does so in few steps. However, the algorithm may or may           created between a control point p on scan P and the closest
not converge to a global minimum, depending on the initial           point q on the tangent plane to Q at q  . q  is the sample point
configuration. One obvious problem arises with surfaces that         on Q closest to the intersection with the line  perpendicular
have few geometric features: two aligned partial scans of a          to P in p.
cylindrical surface can slide relative to each other while the
distance between corresponding points remains zero. When
available, features in co-acquired texture images can help
                                                                     error function to be minimized. They report more accurate
solve this underconstrained problems (see Section 3.3).
                                                                     registration results than Chen and Medioni’s original method
   Variations of the algorithm differ in how the candidate           in controlled experiments. In related work, Dorai et al. [17]
matching pairs are identified, which pairs are used in               check distance constraints (given points p1 and p2 on the
computing the rigid transformation, and in the type of               first surface, and corresponding points q1 , q2 on the second
optimization procedure used. Besl and McKay [13] use the             surface, | p1 − p2  − q1 − q2 | < ε must hold) to prune
Euclidean closest point as the matching candidate to a given         incompatible matches, also leading to improved registration
point. Chen and Medioni [14] find the intersection between           results. Many researchers have proposed incorporating other
a line normal to the first surface at the given point and            features for validating matches: for example thresholding
the second surface, then minimize the distance between the           the maximum distance, discarding matches along surface
given point and the tangent plane to the second surface at the       discontinuities, evaluating visibility, and comparing surface
intersection point. This technique has two advantages: it is         normals, curvature or surface color information (see for
less sensitive to non-uniform sampling, and poses no penalty         example the good review in [18]). Use of the texture images
for two smooth surfaces sliding tangentially one with respect        as an aid to registration is further discussed in Section 3.3.
to the other, a desirable behavior because in flat areas false
                                                                       Given the two sets of matching points P = { p1 , . . . , pn },
matches can easily occur. See Figures 3 and 4.
                                                                     Q = {q1 , . . . , qn }, the next problem is computing a rotation
   Points from the first surface (control points) can be             matrix R and translation vector T such that the sum of
selected using uniform subsampling, or by identifying                squares of pair wise distances
surface features. The set of candidate pairs can be weighted

                                                                                           n
and/or pruned based on estimates of the likelihood of                                 e=          pi − (Rqi + T )2
an actual match, and confidence in the data. Zhang [15]                                    i=1
introduces a maximum tolerable distance and an orientation
consistency check to filter out spurious pairings. Dorai             is minimized. This problem can be solved in closed form by
et al. [16] model sensor noise and study the effect of               expressing the rotation as a quaternion [19], by linearizing
measurement errors on the computation of surface normals.            the small rotations [14], or by using the Singular Value
They employ a minimum variance estimator to formulate the            Decomposition. More statistically robust approaches have


                                                                    c The Eurographics Association and Blackwell Publishers Ltd 2002
F. Bernardini and H. Rushmeier / 3D Model Acquisition                                       153

been investigated to avoid having to preprocess the data to           improve robustness and efficiency. Invalid matches are
eliminate outliers [20,21].                                           detected and discarded at each iteration.
                                                                        A different class of methods models the problem by
                                                                      imagining a set of springs attached to point pairs, and
3.2. Registration of multiple views
                                                                      simulating the relaxation of the dynamic system. Stoddart
When pair wise registration is used sequentially to align             and Hilton [28] assume that point pairs are given and
multiple views errors accumulate, and the global registration         remain fixed. Eggert et al. [18] link each data point to
is far from optimal. Turk and Levoy [22] use a cylindrical            the corresponding tangent plane in another view with a
scan that covers most of the surface of the object, and then          spring. They use a hierarchical subsampling that employs
incrementally register other scans to it. In their variation of       an increasing number of control points as the algorithm
ICP, they compute partial triangle meshes from the range              progresses, and update correspondences at each iteration.
scans, then consider the distance from each vertex of one             They report better global registration error and a larger
mesh to the triangulated surface representing the other scan.         radius of convergence than other methods, at the expense of
                                                                      longer computation times. Their method also assumes that
   Bergevin et al. [23] extend the incremental approach to            each portion of the object surface appears in at least two
handle multiple views. One of the views is selected as                views.
the central (or reference) view. All the other views are
transformed into the reference frame of the central view.
At each iteration, each view is registered with respect to all        3.3. Using the textures to aid registration
other views using a varation of Chen and Medioni’s method.            Images that record the ambient light reflected from an object
The process is repeated until all incremental registration            (rather than a structured light pattern used for triangulation)
matrices are close to the identity matrix. Benjemaa and               may also be captured coincidently with the range images.
Schmitt [24] use a similar approach, but accelerate finding           Color or grayscale images are recorded to be used at texture
matching pairs by resampling the range images from a                  maps (see Section 7). Range and texture images in systems
common direction of projection, and then performing the               that acquire both coincidently are registered to one another
searches for the closest points on these images.                      by calibration. That is, the relative position and orientation
                                                                      of the texture and range sensors are known, and so the
   Pulli [25] describes another incremental multiview regis-
                                                                      projective mapping of the texture image onto the range
tration method that is particularly suited to the registration
                                                                      image is known. When texture images registered to the
of large datasets. Pulli’s method consists of two steps: in the
                                                                      range images are available, they may be used in the scan
first step, range scans are registered pair wise using Chen and
                                                                      registration process. This is particularly advantageous when
Medioni’s method. Matching points are discarded if they lie
                                                                      the texture images have a higher spatial resolution than the
on scan’s boundaries, if the estimated normals differ by more
                                                                      range images, and/or the object itself has features in the
than a constant threshold, or when their distance is too large.
                                                                      surface texture in areas that have few geometric features.
A dynamic fraction, that increases as the registration gradu-
ally improves, of the best remaining pairs (the shorter ones)            Texture images may be used in the initial alignment
is then used for the alignment. After this initial registration,      phase. Gagnon et al. [29] use texture data to assist a human
the overlap areas of each pair of scans is uniformly sampled,         operator in the initial alignment. Pairs of range images are
and the relative position of sample points stored and used in         aligned manually by marking three points on overlapping
the successive step: the algorithm will assume that the pair          texture images. The locations of the matching points are
wise registration is exact and will try to minimize relative          refined by an algorithm that searches in their immediate
motion. The second step considers the scans one at a time,            neighborhoods using image cross-correlation [30]. A
and aligns each to the set of scans already considered. An            least-squares optimization follows to determine a general
inner loop in the algorithm considers all the scans that over-        3D transformation between the scans that minimizes the
lap with the current scan, and recursively aligns each of these       distances between the point pairs.
scans until the relative change is smaller than a threshold,
diffusing error evenly among all scans. By using a small                 Roth [9] used textures in an automatic initial alignment
number of pairs of points in the global registration phase,           procedure. “Interest” points in each texture image, such
the need to have all the scans in memory is eliminated.               as corners, are identified using any of a variety of image
                                                                      processing techniques. A 3D Delaunay tetrahedralization is
   Blais and Levine [26] search for a simultaneous solution           computed for all interest points in each scan. All matching
of all the rigid motions using a simulated annealing                  triangles are found from pairs of potentially overlapping
algorithm. Execution times for even just a few views are              scans, and the transformation that successfully registers the
reportedly long. Neugebauer [27] uses the Levenberg–                  most matching triangles is used. The advantage of using
Marquardt method to solve a linearized version of the                 the triangles is that it imposes a rigidity constraint that
least-squares problem. A resolution hierarchy is used to              helps insure that the matches found are valid. The method


                                                                    c The Eurographics Association and Blackwell Publishers Ltd 2002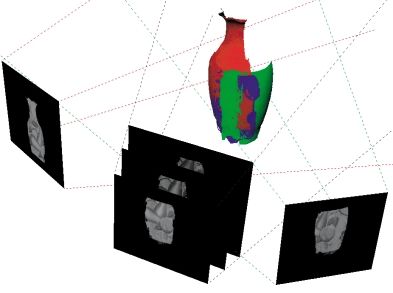
154                                       F. Bernardini and H. Rushmeier / 3D Model Acquisition

requires an adequate number of “interest” points in the
                                                                                                     Si
textures. However, a relatively sparse pattern of points can
be projected onto an object using laser light to guarantee
that such points are available. Projected points were added to         Di
                                                                                                                Sj
texture maps in the case study presented by Bernardini and
Rushmeier [31], however the number of points per scan were                              D̃ j        Sm
not adequate for a completely automatic initial alignment.                             D̃i

   Texture images may also be used in the refinement of the                           Dm
initial alignment. In general, there are two major approaches                                                 Dj
to using texture image data in the refinement phase. In one
approach, the color image values are used as additional
coordinates defining each point captured in the scan. In the
other approach, matching operations are performed using the
images directly.
                                                                    Figure 5: Registration methods that work with images begin
   Johnson and Kang [32,33] describe a method in which              by projecting overlapping textures into the same view. Here
they use color from a texture as an additional coordinate           geometries Si and S j are used to project the corresponding
for each point in an ICP optimization. Because the range            texture maps Di and D j into the same view as a third scan
images they use are of lower spatial resolution than the            Sm .
texture images, the range images are first supersampled
to the texture resolution, and a color triplet is associated
with each 3D point. The color triplets need to be adjusted          pairs. Pulli [36] describes a method similar to Weik’s that
to be comparable in influence to the spatial coordinates.           replaces the use of image gradient and differences with a full
They recommend scaling the color coordinates so that                image registration to find corresponding points. Pulli’s tech-
the range of values matches the range of values in the              nique uses a version of planar perspective warping described
spatial coordinates. Further, to minimize image-to-image            by Szeliski and Shum [37] for image registration. To make
illumination variations they recommend using color in terms         the registration more robust, Pulli describes a hierarchical
of Y I Q rather than RG B, and applying a scale factor to           implementation. Similar to Kang and Johnson, Pulli exam-
the luminance, Y coordinate, that is much smaller than the          ines alternative color spaces to minimize the effects of illu-
chrominance I Q coordinates. The closest point search now           mination variations. For the test cases used—small objects
becomes a search in 6D space, and a 6D k-d tree is used             with rich geometric and textural features—there appears to
to accelerate the search. For tests using scanned models            be no advantage of using images in color spaces other than
of rooms which have many planar areas with high texture             RG B.
variation, they demonstrate order of magnitude reductions
in alignment errors. Schütz et al. [34] present a similar             Both Weik’s and Pulli’s methods require operations on the
extended-coordinate ICP method, that uses scaled normals            full high-resolution texture images. A high degree of overlap
data (with normals derived from the range data) as well as          is required, and scan-to-scan variability in illumination
color data.                                                         introduces error. Fine scale geometry is matched only if
                                                                    these details are revealed by lighting in the images. Both
   The alternative approach to using texture image data is to       methods can be effective if there are substantial albedo
perform matching operations on image data directly. This            variations in the scans that dominate illumination variations.
allows image structure to be exploited, and avoids search
in high dimensional coordinate space. To compare texture              Bernardini et al. [38] present a registration method
images directly, these types of methods begin by using              that combines elements of several of the other texture-
the range scan and an initial estimate of registration to           based techniques. The initial alignment is first refined
project the texture images into a common view direction, as         with a purely geometric ICP. Similar to Weik and Pulli,
illustrated in Figure 5.                                            the texture images are projected into a common view.
                                                                    Similar to Roth, feature points are located in the texture
   Weik [35] projects both the texture image and the texture        images. However, unlike Roth the method does not attempt
gradient image of a source scan to be aligned with a sec-           to match feature points. Rather, similar to the approach
ond destination scan. The difference in intensities in the two      by Gagnon et al. the initial correspondences are refined
images in the same view are then computed. The texture dif-         by doing a search in a small neighborhood around each
ference image and gradient image are then used to estimate          point, and finding corresponding pixels where an image
the locations of corresponding points in the two images. A          cross-correlation measure is minimized. A rigid rotation is
rigid transformation is then computed that minimizes the            then found that minimizes the distance between the newly
sum of the 3D distances between the corresponding point             identified corresponding points.


                                                                   c The Eurographics Association and Blackwell Publishers Ltd 2002
F. Bernardini and H. Rushmeier / 3D Model Acquisition                                         155

3.4. Future directions

Successful refinement of an initial registration has
been demonstrated for a large class of objects. This
step does not appear to be a major obstacle to a fully
automatic model-building pipeline. Robust solutions for the
automatic alignment of totally uncalibrated views are not
available, although some progress is being made. Scanner
instrumentation with an approximate positioning device
seems a feasible solution in most cases. Very promising is                                                   Real surface
the use of improved feature-tracking algorithms from video                                                   Measurement 1
sequences as an inexpensive way of producing the initial                                                     Measurement 2
registration estimate.
                                                                     Figure 6: Probabilistic model of measurement error
                                                                     (adapted from Rutishauser et al. [39]).
4. Line-of-sight Error

After the scans have been aligned the individual points
would ideally lie exactly on the surface of the reconstructed
                                                                        Soucy and Laurendeau [41] model error in a laser triangu-
object. However, one still needs to account for residual error
                                                                     lation system as proportional to the fraction of illuminance
due to noise in the measurements, inaccuracy of sensor
                                                                     received by the sensor, expressed by the cosine square of
calibration, and imprecision in registration. The standard
                                                                     the angle between the surface normal at the measured point
approach to deal with the residual error is to define new
                                                                     and the sensor viewing direction. Overlapping range data is
estimates of actual surface points by averaging samples from
overlapping scans. Often the specific technique used is cho-         resampled on a common rectangular grid lying on a plane
sen to take advantage of the data structures used to integrate       perpendicular to the average of the viewing directions of
the multiple views into one surface. Because of this, details        all contributing scans. Final depth values are computed as
of the assumed error model and averaging method are often            weighted averages of the resampled values, where the weight
lost or overlooked by authors. We believe that this problem          used is the same cosine square defined above. These points
is important enough to deserve a separate discussion. In             are then connected into a triangle mesh.
addition, line-of-sight error compensation, together with
                                                                       Turk and Levoy [22] employ a similar method, but invert
resampling and outlier filtering, is a necessary preprocessing
                                                                     the steps of creating a triangulated surface and finding better
step for interpolatory mesh integration methods.
                                                                     surface position estimates. In their approach individual range
   Among the first to recognize the need for a mathemat-             scans are first triangulated, then stitched together. In areas of
ical model of scanner inaccuracies and noise were Hébert            overlap, vertices of the resulting mesh are moved along the
et al. [40], in the context of data segmentation and poly-           surface normal to a position computed as the average of all
nomial section fitting. Their error model incorporates the           the intersection of a line through the point in the direction of
effects of viewing angle and distance, and is expressed as           the normal and all the overlapping range scans.
an uncertainty ellipsoid defined by a Gaussian distribution.
Other sources of non-Gaussian error, such as shadows, sur-              Neugebauer [27] adjusts point positions along the scanner
face specularities and depth discontinuities, which generally        line-of-sight. He uses a weighted average where each weight
produce outliers, are not included in the model. For a typical       is the product of three components: the first is the cosine
triangulation scanner the error in estimating the x, y position      of the angle between surface normal and sensor viewing
of each sample is much smaller than the error in estimat-            direction (if the cosine is smaller than 0.1, the weight
ing the depth z. Therefore the ellipsoid is narrow with its          is set to zero); the second contribution is a function that
longer axis aligned with the direction towards the sensor,           approximates the square distance of a sample point to the
see Figure 6. Building on the work of Hébert et al. [40],           scan boundary, allowing a smooth transition between scans;
Rutishauser et al. [39] define an optimal reconstruction of a        the third component is Tukey’s biweight function, used to
surface from two sets of estimates, in the sense of probability      filter outliers. The weighting is applied iteratively.
theory. However, they have to resort to some approxima-
tions in their actual computations. For a measured point on             In volumetric methods line-of-sight error compensation
one scan, they find the best matching point (again, in the           is done by computing a scalar field that approximates the
probabilistic sense) on the triangle defined by the three clos-      signed distance to the true surface, based on a weighted
est samples on the second scan. The optimal estimation of            average of distances from sample points on individual range
point location is then computed using the modified Kalman            scans. The details of the various methods will be discussed
minimum-variance estimator.                                          in the next section.


                                                                   c The Eurographics Association and Blackwell Publishers Ltd 2002
156                                        F. Bernardini and H. Rushmeier / 3D Model Acquisition

5. Scan Integration                                                    A commercial software product by Geomagic is based on
                                                                     a different technique to extract the subcomplex, called the
For most applications, it is desirable to merge the aligned          wrap complex [48]. The technique can handle non-uniform
multiple scans into a unified, non-redundant surface repre-          samplings, but requires some interactive input.
sentation. A significant amount of research in this direction
has been done in the past. In this section, we will try to clas-        Amenta et al. [49,50] introduce the concept of crust, the
sify this work based on the type of assumptions and approach         subcomplex of the Delaunay complex of S ∪ P, where P
taken, and we will point to recent publications that are repre-      is the set of poles of the Voronoi cells of S, formed by only
sentative of each category, without trying to exhaustively cite      those simplices whose vertices belong to S. The poles of
the vast literature available on this subject. Previous reviews      a sample point s ∈ S are the two farthest vertices of its
of work in this field include [42–44].                               Voronoi cell. The algorithm automatically handles non-
                                                                     uniform samplings, and its correctness, under somewhat
   The goal of scan integration is to reconstruct the geometry       stringent sampling density conditions, has been proven, both
and topology of the scanned object from the available data.          in the sense of a topologically correct reconstruction and of
The problem is difficult because in general the data points          convergence to the actual surface for increasing sampling
are noisy, they may contain outliers, parts of the surface may       density. Experimental results prove that the algorithm
not have been reached by the scanner, and in general there is        performs well in practice for much less dense samplings
no guarantee that the sampling density is even sufficient for        than the theoretical bound. Based on a similar concept,
a correct reconstruction.                                            but leading to a more efficient and robust implementation
                                                                     is the power crust algorithm [51,52]. The first step of the
   Some progress is being made in characterizing the prob-
                                                                     power crust algorithm is to compute a piecewise-linear
lem more rigorously, at least in restricted settings. A first
                                                                     approximation of the medial axis transform, interpolating
classification of methods can be made based on whether the
                                                                     the poles P of the Voronoi cells of S, defined as above. The
input data is assumed to be unorganized points (point cloud)
                                                                     poles are weighted with the associate (approximate) radius
or a set of range scans. Techniques that deal with the first
                                                                     of the maximal balls that do not intersect the surface. The
kind of input are more general, but also usually less robust
                                                                     second step computes a piecewise-linear approximation of
in the presence of noise and outliers. The second category
                                                                     the surface as a subset of the faces of the power diagram
uses information in addition to simple point position, such as
                                                                     of the set of weighted poles. One additional benefit of the
estimated surface normal, partial connectivity embedded in
                                                                     algorithm is that it produces a closed (“watertight”) surface
the range scan, sensor position, to better estimate the actual
                                                                     in the presence of uneven sampling density. Sampling
surface.
                                                                     assumptions and theoretical guarantees are defined in [52].
  A second classification groups techniques based on the ap-         Practical extensions to deal with sharp features, holes and
proach taken to reconstruct surface connectivity. A practical        noise are discussed in [51]. Experimental results for datasets
consequence of this choice is the size of the problem that can       containing several hundred thousand points are shown.
be solved using given computing resources. We will review               Also using the concept of poles to define a local surface
selected work based on this second categorization.                   approximation is the cocones algorithm proposed by Amenta
                                                                     et al. [53]. Here the poles of the Voronoi diagram of P are
                                                                     used to define an approximate normal for each sample point.
5.1. Delaunay-based methods
                                                                     The complement (restricted to the Voronoi cell of the point)
The Delaunay complex D(S) associated with a set of points            of a double cone centered at p, with axis aligned with the
S in R 3 decomposes the convex hull of S and imposes a               sample point normal and an aperture of 3π/8, is defined
connectivity structure. Delaunay-based methods reconstruct           as the cocone of p. It is proved that the cocone constitutes
a surface by extracting a subcomplex from D(S), a process            a good approximation for the surface in the neighborhood
sometime called sculpting. This class of algorithms usually          of p. The local surface reconstrucion is then defined by
assumes only a point cloud as input. A recent review and             the collection of Delaunay triangles incident on p that are
unified treatment of these methods appears in [45].                  dual to Voronoi edges contained in the cocone of p. The
                                                                     union of all the local reconstruction constitutes a superset
   One technique to select an interesting subcomplex, in fact        of the final manifold triangulation, which is obtained with a
a parameterized family of subcomplexes, is based on alpha-           global prune and walk algorithm. These results are presented
shapes [46]. Bajaj et al. [44,47] use a binary search on             in the context of a practical implementation by Dey et al.
the parameter α to find a subcomplex that defines a closed           [54]. The authors employ a divide and conquer method
surface containing all the data points. Smaller concave              based on an octree partition of the input points to avoid
features not captured by the alpha-shape are found with the          a global Voronoi computation. The pointsets contained in
use of heuristics. The surface is then used to define a signed       each octree node are padded with enough points from
distance. A C 1 implicit piecewise-polynomial function is            neighboring nodes to enforce the computation of compatible
then adaptively fit to the signed distance field.                    triangulations along common boundaries. Again, a global


                                                                    c The Eurographics Association and Blackwell Publishers Ltd 2002
F. Bernardini and H. Rushmeier / 3D Model Acquisition                                        157

prune and walk algorithms selects a manifold subset of                dataset. This allowed the triangulation of a large collection
the candidate triangles. The divide and conquer approach              of scans with millions of samples.
leads to reduced computation times and memory usage,
allowing the treatment of datasets with millions of samples             Gopi et al. [59] compute local 2D Delaunay triangulations
on common workstations.                                               by projecting each point and its neighborhood on a tangent
                                                                      plane, and then lift the triangulation to 3D.
   In the context of Delaunay-based methods it is possible
to study the sampling conditions the guarantee a correct                 Surface based methods can easily process large datasets,
reconstruction. Attempts so far have been mostly restricted           and can handle (and compensate for) small-scale noise in
to the 2D case [55–57], with the exception of [50] and [52].          the data. Robustness issues arise when the noise makes it
The main shortcomings of these methods are their sensitivity          difficult to locally detect the correct topology of the surface.
to noise and outliers (these algorithms interpolate the data
points, so outliers must be removed in preprocessing), and            5.3. Volumetric methods
their computational complexity. Robustly computing and
representing the connectivity of the 3D Delaunay complex              Volumetric methods [60–62] are based on computing
can be a costly task. Experimental results are usually limited        a signed distance field in a regular grid enclosing the
to “clean” datasets with less than a few hundred thousand             data (usually, only in proximity of the surface), and then
points (with the exception of [54]).                                  extracting the zero-set of the trivariate function using the
                                                                      marching cube algorithm [63]. The various approaches
                                                                      differ on the details of how the signed distance is estimated
5.2. Surface-based methods                                            from the available data.
Surface-based methods create the surface by locally param-               Curless and Levoy [60] compute the signed distance from
eterizing (or implicitly assuming a local parameterization            each scan by casting a ray from the sensor through each
of) the surface and connecting each points to its neighbors           voxel near the scan. The length of the ray from the voxel to
by local operations. Some methods make use of the partial             the point in which it intersects the range surface is computed
connectivity implicit in the range images.                            and accumulated at the voxel with values computed from
   The zippering approach of Turk and Levoy [22] works by             other scans using weights dependent, as usual, on surface
first individually triangulating all the range scans. The partial     normal and viewing direction. This approach may lead to a
meshes are then eroded to remove redundant, overlapping               biased estimate of surface location, as noted in [61]. Hilton
triangles. The intersecting regions are then locally retrian-         et al. [62] also blend signed distances from individual scans,
gulated and trimmed to create one seamless surface. Vertex            and use extra rules to handle correctly the case of of different
positions are then readjusted to reduce error, as described in        surfaces in close proximity, both with the same and opposite
Section 4.                                                            orientation. Wheeler et al. [61] propose a solution that is
                                                                      less sensitive to noise, outliers, and orientation ambiguities.
   Soucy and Laurendeau [41] use canonical Venn diagrams              They assign to each voxel the signed distance to the closest
to partition the data into regions that can be easily parameter-      point on the consensus surface, a weighted average of
ized. Points in each region are resampled and averaged (see           nearby measurements. Only measurements for which a user-
Section 4), and locally triangulated. Patches are then stitched       specified quorum of samples with similar position and
together with a constrained Delaunay algorithm.                       orientation is found are used.

   A recent paper by Bernardini et al. [58] describes an algo-           Boissonnat and Cazals [64] use natural neighbor interpo-
rithm to interpolate a point cloud that is not based on sculpt-       lation to define a global signed distance function. The natural
ing a Delaunay triangulation. Their method follows a region           neighbors of a point x   are the neighbors of x in the Delau-
growing approach, based on a ball-pivoting operation. A ball          nay triangulation of P {x}. Using natural neighbors avoids
of fixed radius (approximately the spacing between two sam-           some of the pitfalls of other local surface approximations
ple points) is placed in contact with three points, which form        (for example taking just the points within a given distance
a seed triangle. The three edges initialize a queue of edges          from x, or its k closest neighbors). However, it requires the
on the active boundary of the region. Iteratively, an edge            computation of a global Delaunay triangulation, which lim-
is extracted from the queue, and the ball pivots around the           its the size of the datasets that can be handled by the al-
extracted edge until it touches a new point. A new triangle is        gorithm in practice. Since the Delaunay triangulation of the
formed, the region boundary updated, and the process con-             points must be computed, it can also be used as the starting
tinues. The approach can easily be extended to restart with           point for the construction of piecewise-linear approximation
a larger ball radius to triangulate regions with sparser data         of the surface that satisfies a user-specified tolerance. The
points. This method was implemented to make efficient use             initial approximation is formed by all those Delaunay trian-
of memory by loading at any time only the data in the region          gles whose dual Voronoi edge is bipolar, that is such that
currently visited by the pivoting ball, rather than the entire        the global signed distance function has different signs at its


                                                                    c The Eurographics Association and Blackwell Publishers Ltd 2002
158 F. Bernardini and H. Rushmeier / 3D Model Acquisition
two endpoints. This triangulation is then incrementally re- 6. Postprocessing
fined until the tolerance condition is satisfied. Examples of
Postprocessing operations are often necessary to adapt the
reconstruction from datasets of moderate size are shown in
model resulting from scan integration to the application
the paper.
at hand. Very common is the use of mesh simplification
Volumetric methods are well suited for very large datasets. techniques to reduce mesh complexity [75].
Once the individual range scans have been processed
To relate a texture map to the integrated mesh, the surface
to accumulate signed distance values, storage and time
must be parameterized with respect to a 2D coordinate
complexity are output sensitive: they mainly depend on the
system. A simple parameterization is to treat each triangle
chosen voxel size, or resolution of the output mesh. Memory
separately [32,76] and to pack all of the individual texture
usage can be reduced by explicitly representing only voxels
maps into a larger texture image. However, the use of
in close proximity to the surface [60] and by processing
mip-mapping in this case is limited since adjacent pixels
the data in slices. The choice of voxel size is usually left
in the texture may not correspond to adjacent points on
to the user. Small voxels produce an unnecessarily large
the geometry. Another approach is to find patches of
number of output triangles and increase usage of time and
geometry which are height fields that can be parameterized
space. Large voxels lead to oversmoothing and loss of small
by projecting the patch onto a plane. Stitching methods [2]
features. These problems can be alleviated by using an
use this approach by simply considering sections of the
adaptive sampling (e.g. octree rather than regular grid [65])
scanned height fields as patches.
and/or by postprocessing the initial mesh with a data fitting
procedure [66–68]. Many parameterization methods have been developed
for the general problem of texture mapping. Several
Volumetric methods are also well suited to producing methods seek to preserve the relative distance between 3D
water-tight models. By using the range images to carve out a points in their pairing to a 2D coordinate system [77,78].
spatial volume, an object definition can be obtained without Marschner [79] describes an example of applying a
holes in the surface. Reed and Allen [69] demonstrate the relative distance preserving parameterization in a scanning
evolution of a solid model from a series of range images, application. The surface is subdivided into individual
with the data from each image carving away the solid that patches by starting with seed triangles distributed over the
lies between the scanner and each sample point. Rocchini et object, and growing regions around each seed. Harmonic
al. [70] also describe a volumetric method that fills holes. maps are found to establish a 2D coordinate system for each
patch, so individual patches need not be height fields.
5.4. Deformable surfaces Sloan et al. [80] have observed that maintaining relative
distances may not produce optimal parameterizations
Another class of algorithms is based on the idea of deform- for texture mapping. They suggest that uniform texture
ing an initial approximation of a shape, under the effect of information, rather than distance preservation, should drive
external forces and internal reactions and constraints. the parameterization. They applied this idea to synthetic
Terzopoulos et al. [71] use an elastically-deformable textures only, but it may prove to be an effective approach
model with intrinsic forces that induce a preference for in some scanning applications as well.
symmetric shapes, and apply them to the reconstruction Another important step for applications that involve edit-
of shapes from images. The algorithm is also capable of ing and animating the acquired model is the conversion of
inferring non-rigid motion of an object from a sequence of the mesh to a parametric, higher-order surface representa-
images. tion, for example using NURBS or a subdivision scheme.
Pentland and Sclaroff [72] adopted an approach based on The technique of Hoppe et al. [81] starts with a triangle
the finite element method and parametric surfaces. They start mesh and produces a smooth surface based on Loop’s sub-
with a simple solid model (like a sphere or cylinder) and division scheme [82]. Their method is based on minimizing
attach virtual “springs” between each data point and a point an energy function that trades off conciseness and accuracy-
on the surface. The equilibrium condition of this dynamic of-fit to the data, and is capable of representing surfaces
system is the reconstructed shape. They also show how the containing sharp features, such as creases and corners.
set of parameters that describe the recovered shape can be
used in object recognition. More recently, Eck and Hoppe [83] proposed an alter-
native surface fitting approach based on tensor-product B-
Recently a number of methods based on the concept of spline patches. They start by using a signed-distance zero-
levels sets have been proposed. These methods combine surface extraction method [84]. An initial parameterization
a robust statistical estimation of surface position in the is built by projecting each data point onto the closest face.
presence of noise and outliers with an efficient framework The method continues with building from the initial mesh
for surface evolution. See e.g. [73,74]. a base complex (a quadrilateral-domain complex, with the
c The Eurographics Association and Blackwell Publishers Ltd 2002F. Bernardini and H. Rushmeier / 3D Model Acquisition 159
same topology of the initial mesh) and a continuous param- 7.1. Texture-geometry registration
eterization from the base complex to the initial mesh, lever-
aging on the work of Eck et al. [78]. A tangent-plane con- It is possible to capture the spectral reflectance of an
tinuous network of tensor-product B-spline patches, having object as points are acquired with a polychromatic laser
the base complex as parametric domain, is then fit to the scanner [87]. However, data for texture is typically acquired
data points, based on the scheme of Peters [85]. The fitting by an electronic color camera or using conventional color
process is cast as an iterative minimization of a functional, photographs that are subsequently scanned into electronic
which is a weighted sum of the distance functional (the sum form. The texture images need to be registered with the
of square Euclidean distances of the data points from the sur- acquired 3D points. The most straightforward system for
face) and a fairness functional (thin plate energy functional). doing this is registration by calibration. That is, color images
corresponding to each range image are acquired at the same
Another NURBS fitting technique is described by time, using a camera with a known, measured position
Krishnamurthy and Levoy [86]. The user interactively and orientation relative to the sensor used for obtaining
chooses how to partition the mesh into quadrilateral patches. geometry. As discussed in Section 3.3, an advantage of
Each polygonal patch is parametrized and resampled, this approach is that acquired texture can be used in the
using a spring model and a relaxation algorithm. Finally, geometric registration process.
a B-spline surface is fit to each quadrilateral patch. In
addition, a displacement map is computed that captures the When textures are acquired separately from geometry, the
fine geometric detail present in the data. texture-to-geometry registration is performed after the full
mesh integration phase. Finding the camera position and ori-
Commercial packages that allow a semi-automated
entation associated with a 2D image of a 3D object is the
parametrization and fitting are available.
well-known camera calibration problem. Numerous refer-
ences on solutions to this problem can be found in the Price’s
7. Texture Computer Vision bibliography [88], Section 15.2, “Camera
Calibration Techniques.” Camera calibration involves esti-
In addition to the overall shape of an object, the rendering
mating both the extrinsic and intrinsic parameters. The ex-
of high quality images requires the fine scale surface
trinsic parameters are the translation and rotation to place
appearance, which includes surface color and finish. We
the camera viewpoint correctly in the object coordinate sys-
will refer to such properties generically as the surface
tem. The intrinsic parameters include focal length and radial
texture. Beyond color and finish, texture may also include
distortion. For objects which have an adequate number of
descriptions of fine scale surface geometry, such as high
unique geometric features, it is possible to manually identify
spatial-resolution maps of surface normals or bidirectional
pairs of corresponding points in the 2D images and on the
textures.
numerical 3D object. Given such correspondences, classic
Surface color and finish are informal terms. Color is ac- methods such as that described by Tsai [89], can be used to
tually a perceived quantity, depending on the illumination register the captured color images to the 3D model [2].
of an object, human visual response, and the intrinsic spec-
tral reflectance of the object. Finish—such as smoothness For some objects it may not be possible for a user to
or gloss—is also not a directly acquired property, but is a find a large number of accurate 2D–3D correspondences.
consequence of an object’s intrinsic reflectance properties. Neugebauer and Klein [90] describe a method for refining
The fundamental quantity that encodes the intrinsic proper- the registration of a group of existing texture images
ties of the surface is the Bidirectional Reflectance Distribu- to an existing 3D geometric model. The method begins
tion Function (BRDF). To fully render an accurate image, with a rough estimate of the camera parameters for each
the BRDF must be known for all points on a surface. The image in the set, based on correspondences that are not
BRDF fr (λ, x, y, ωi , ωr ) at a surface point (x, y) is the required to be highly accurate. The parameters for all of the
ratio of radiance reflected in a direction ωr to an incident texture images are improved simultaneously by assuming
energy flux density from direction ωi for wavelength λ. The the intrinsic camera parameters are the same for all images,
BRDF can vary significantly with position, direction and and enforcing criteria that attempt to match the object
wavelength. Most scanning systems consider detailed po- silhouettes in the image with the silhouette of the 3D model,
sitional variations only, with wavelength variations repre- and to match the image characteristics at locations in texture
sented by an RG B triplet, and Lambertian (i.e. uniform for images that correspond to the same 3D point.
all directions) behavior assumed. Furthermore, most scan-
Lensch et al. [91] present a method for finding the camera
ning systems acquire relative estimates of reflectance, rather
position for texture images in terms of a geometric object co-
than attempting to acquire an absolute value.
ordinate system using comparisons of binary images. First,
Here we will consider how texture data is acquired, and a binary version of each texture image is computed by seg-
then how it is processed to provide various types of BRDF menting the object from the background. This is compared to
estimates, and estimates of fine scale surface structure. a synthetic binary image generated by projecting the known
c The Eurographics Association and Blackwell Publishers Ltd 2002You can also read