2019-2021 Community Health Needs Assessment Community Service Plan
←
→
Page content transcription
If your browser does not render page correctly, please read the page content below
Community Health
Needs Assessment
Community Service Plan
2019-2021
Community Health Needs Assessment
                            Community Service Plan
                                   2019-2021

1. Counties covered in this assessment and plan
   Erie County, Niagara County

2. Participating Local Health Department(s)
   Erie County Department of Health:
   Kelly Asher, Community Coalition Coordinator - 716-858-7685 Kelly.Asher@Erie.gov
   Niagara County Department of Health:
   Dan Stapleton, Public Health Director – 716-439-7435 dan.stapleton@niagaracounty.gov

3. Participating Hospital/Hospital System(s) and contact information
   Kaleida Health including its four hospitals:
           Erie County
                   Buffalo General Medical Center/Gates Vascular Institute
                   Millard Fillmore Suburban Hospital
                   John R. Oishei Children’s Hospital
           Niagara County
                   DeGraff Memorial Hospital
   Contact:
   Kathleen Tompkins
   Kaleida Health
   726 Exchange St. Ste. 225
   Buffalo, NY 14210
   716-859-8728
   ktompkins@kaleidahealth.org

4. Name of coalition/entity, if any, completing assessment and plan on behalf of participating
   counties/hospitals

    Kaleida Health is completing its own assessment and plan in collaboration the with Erie
   County Department of Health and Niagara County Department of Health and partner
   organizations.

               Kaleida Health 2019-2021 Community Health Needs Assessment-Community Service Plan   1
Community Health Needs Assessment
                            Community Service Plan
                                   2019-2021

                                         Table of Contents

Executive Summary                                                                                  3

We are Kaleida Health                                                                              7

Kaleida Health Hospitals                                                                           8

Caring for the Underserved                                                                         10

Community Served                                                                                   11

Health Status of the Community                                                                     19

Community Engagement                                                                               33

Health Issues of Concern and NYS Prevention Agenda Priorities                                      37

Kaleida Health Work Plan - Focus Areas, Goals, and Interventions                                   45

Monitoring Plan and Partner Engagement                                                             59

Dissemination to the Public                                                                        59

Approval                                                                                           59

               Kaleida Health 2019-2021 Community Health Needs Assessment-Community Service Plan        2
Executive Summary
  Kaleida Health is a not-for-profit, Article 28, New York State licensed, healthcare delivery system

located in Buffalo, New York and serving the 1.5 million residents of the western region of New York

State (NYS), known as Western New York (WNY).

  Kaleida Health serves WNY’s eight counties of Allegany, Cattaraugus, Chautauqua, Erie, Genesee,

Niagara, Orleans and Wyoming. Erie County and Niagara County comprise an estimated 1.1 million of

the WNY total population. This Kaleida Health 2019-2021 Community Health Needs Assessment-

Community Service Plan (CHNA-CSP) focuses on Kaleida Health’s four hospitals and primary service

areas:

Erie County – Hospital Location and Primary Service Area

   •     Buffalo General Medical Center/Gates Vascular Institute

   •     Millard Fillmore Suburban Hospital

   •     John R. Oishei Children’s Hospital

Niagara County – Hospital Location and Primary Service Area

   •     DeGraff Memorial Hospital

  Kaleida Health participated in collaborative efforts to develop the 2019-2021 Community Health

Assessment-Community Health Improvement Plan for Erie County and Niagara County as led by the Erie

County Department of Health and the Niagara County Department of Health and other hospital and

community partners. Other Erie County partners included Catholic Health System, Bertrand Chaffee

Hospital, United Way of Buffalo & Erie County, Buffalo State College, D’Youville College, State University

of New York at Buffalo, American Heart Association, United Way of Buffalo and Erie County, and the

Population Health Collaborative. Other Niagara County partners included Niagara Falls Memorial

Medical Center, Mount Saint Mary’s Hospital and Health Center, Catholic Health System, Eastern

                     Kaleida Health 2019-2021 Community Health Needs Assessment-Community Service Plan   3
Niagara Hospital System, Niagara County Department of Mental Health and the Population Health

Collaborative.

  The collaborative work groups met for several months in 2018 and 2019 to determine community

health needs and priorities. They considered data from the County Health Rankings, NYS Prevention

Agenda Dashboard, NYS Vital Records, NYS Statewide Planning and Research Cooperative system

(SPARCS), NYS Expanded Behavioral Risk Factor Surveillance Survey (eBRFSS), Centers for Disease

Control and Prevention (CDC), among others. Community and stakeholder input was obtained through

consumer surveys and focus group sessions. The needs of low income and underserved populations was

prioritized throughout the process. Based on analysis and discussion of community need, the county

work groups determined the NYS Prevention Agenda Priority Areas to address for 2019-2021. Kaleida

Health was an active participant in both county work groups.

 Erie County and Kaleida Health
 Health Issues of Concern                                2019-2024 NYS Prevention Agenda Priority Area
 High rates of cardiovascular disease and high           Prevent Chronic Diseases
 incidence of risk factors including high blood
 pressure, diabetes, obesity and smoking
 Increasing rise of opioid addiction and fatal           Promote Well-Being and Prevent Mental and
 overdoses                                               Substance Use Disorders
 Poor outcomes in maternal and infant health,            Promote Healthy Women, Infants and Children
 particularly among underserved populations

 Niagara County and Kaleida Health
 Health Issues of Concern                                2019-2024 NYS Prevention Agenda Priority Area
 High rates of cardiovascular disease and high           Prevent Chronic Diseases
 incidence of risk factors including high blood
 pressure, diabetes, obesity and smoking
 Increasing rise of opioid addiction and fatal           Promote Well-Being and Prevent Mental and
 overdoses                                               Substance Use Disorders

  Additionally, a Kaleida Health CHNA-CSP Steering Committee and work groups comprised of

multidisciplinary staff and physicians met from May through October 2019 to discuss the selected

county Priority Areas, community need, and the interventions that would best meet those needs. The

                    Kaleida Health 2019-2021 Community Health Needs Assessment-Community Service Plan    4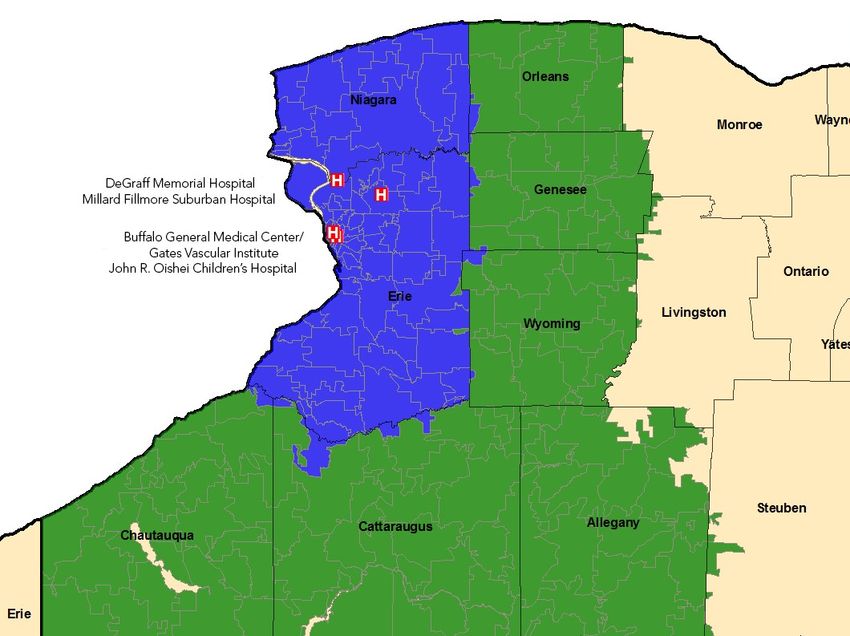
Kaleida Health work groups selected focus areas and interventions including disparities for its 2019-2021
CHNA-CSP, as aligned with the county-focused Priority Areas.
Prevent Chronic Disease – Erie County and Niagara County Priority Area
Erie County – Kaleida Health Focus Areas and Interventions
• Healthy Eating and Food Security – Community Diabetes and Pre-Diabetes Nutrition Education
and Mobile Food Market (Disparity – low income population), Worksite Nutrition and Physical
Activity Programs
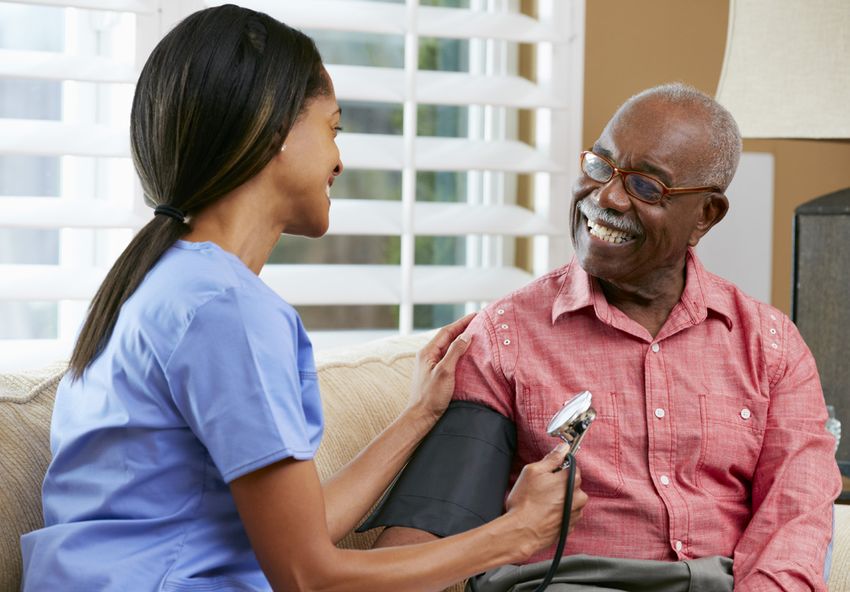
• Preventive Care and Management – Cardiovascular Education and Screening Program in OB-GYN
Centers (Disparity – female, Medicaid population), Chronic Disease Education and Screening
Programs for the Community, Health Literacy Task Force (collaborative county project)
Niagara County – Kaleida Health Focus Areas and Interventions
• Healthy Eating and Food Security – Health Education for Children, Little Free Pantry (Disparity –
food insecure population), Nutrition and Healthy Cooking Education
• Preventive Care and Management – Chronic Disease Education and Screening Programs for the
Community
Prevent Mental and Substance Use Disorders – Erie County and Niagara County Priority Area
Erie County and Niagara County – Kaleida Health Focus Area and Interventions
• Prevent Opioid and Other Substance Misuse and Deaths – Buffalo Matters Buprenorphine and
Treatment Referral Program, Availability and Access and Linkage to Opioid Overdose Reversal
Medications, Medication and Syringe Drop Boxes in Hospital Emergency Departments and Drug
Take-Back Days (Disparity – substance use population)
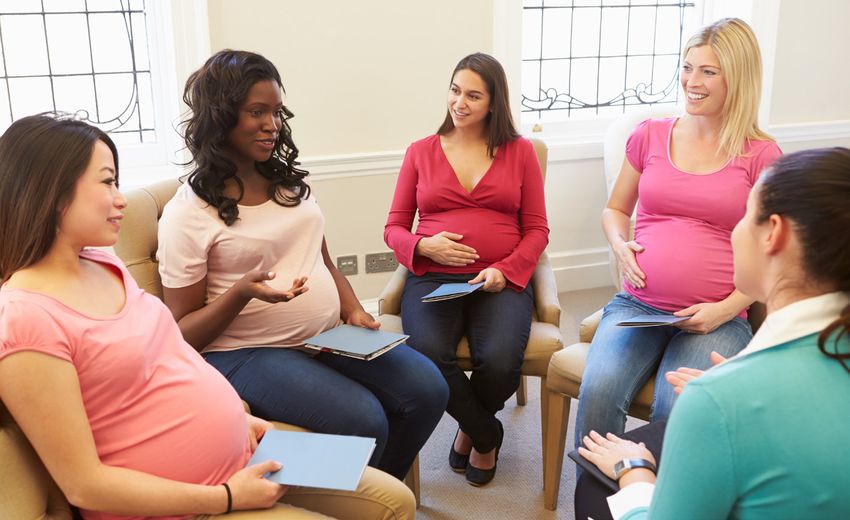
Promote Health Women, Infants, and Children – Erie County Priority Area
Erie County – Kaleida Health Focus Areas and Interventions
Maternal and Women’s Health – Centering Pregnancy Program (Disparity – Medicaid population)
Kaleida Health 2019-2021 Community Health Needs Assessment-Community Service Plan 5
Perinatal and Infant Health – Safe Sleep Initiative, Yomingo® Online Parent Education, Breastfeeding

Promotion and Education Program

  Kaleida Health is responsible for implementing the interventions identified in this 2019-2021 plan,

tracking progress, making any mid-course corrections, and reporting progress and results in annual plan

updates. Kaleida Health will continue to partner with the Erie County and Niagara County work groups

to assess progress. This Kaleida Health 2019-2021 Community Health Needs Assessment-Community

Service Plan is available to the public at http://www.kaleidahealth.org/community/publications.asp.

                   Kaleida Health 2019-2021 Community Health Needs Assessment-Community Service Plan      6
We are Kaleida Health
Kaleida Health’s mission is to “advance the health of its community” and its vision is to “provide
compassionate, high-value, quality care, improving health in Western New York and beyond, educating
future healthcare leaders and discovering innovative ways to advance medicine.”
Kaleida Health is a not-for-profit, Article 28 New York State (NYS) licensed, healthcare delivery system
formed in 1998 with corporate offices located in Buffalo, NY and serving the Western New York (WNY)
region of New York State. The system serves over one million patients annually and leads the region
with 32.8% market share. 1 Kaleida Health has close to 10,000 employees, 1,700 affiliated physicians, and
its economic impact on the region exceeds $2.7 billion. It is affiliated with Great Lakes Health System of
WNY, the entity integrating Kaleida Health, Erie County Medical Center (ECMC) and the University at
Buffalo. Leading Kaleida Health is Jody L. Lomeo, president and CEO, and a 16-member board of
directors.
Kaleida Health hospitals include Buffalo General Medical Center/Gates Vascular Institute in Buffalo, NY;
Millard Fillmore Suburban Hospital in Williamsville, NY; John R. Oishei Children’s Hospital in Buffalo, NY;
and DeGraff Memorial Hospital in North Tonawanda, NY. The system provides long-term care at
HighPointe on Michigan in Buffalo, NY, and the DeGraff Rehabilitation & Skilled Nursing Facility in
Tonawanda, NY. Kaleida Health also operates the Visiting Nursing Association of WNY, a major
laboratory division, 79 clinics and healthcare centers, and multiple ambulatory surgery centers operated
as physician-hospital joint ventures. In 2017, Kaleida Health became the active parent of Upper
Allegheny Health System, which includes Olean General Hospital of Olean, NY, Bradford Regional
Medical Center (BRMC) and The Pavilion at BRMC skilled nursing facility of Bradford, PA. Kaleida Health
is moving toward active parent status with Eastern Niagara Hospital of Lockport, NY. These affiliations
are part of a transformative initiative to cost effectively preserve essential healthcare services in largely
rural WNY communities while assuring linkage to Kaleida Health’s specialty and tertiary healthcare
services.
Kaleida Health further serves as a major clinical teaching affiliate of the University at Buffalo’s (UB)
Jacobs School of Medicine and Biomedical Sciences, providing clinical training to approximately 700 UB
medical students and post-graduate students each year. Through affiliations with a number of
educational institutions, the system also provides a clinical experience for healthcare professionals
training in the fields of pharmacy, nursing, physician assistant, social work and rehabilitation services.
Kaleida Health is committed to providing healthcare for the uninsured and underinsured, offers
programs and services in community-based settings and in its campuses and facilities, and works with
partnering organizations to further meet the community’s health and social needs. The system is a
member of the ECMC Millennium PPS to advance the goals of DSRIP and works actively with NYS
Medicaid Health Homes while also operating Oishei Healthy Kids, a NYS Medicaid Health Home for
Children.
Kaleida Health does not discriminate on the basis of race, color, religion, sex, national origin, disability,
sexual orientation, gender identity or expression, physical appearance, source of payment, or age.

1
    IBM Market Expert (NYS SPARCS) 1st qtr. 2018

                            Kaleida Health 2019-2021 Community Health Needs Assessment-Community Service Plan   7
Kaleida Health Hospitals
Buffalo General Medical Center/Gates Vascular Institute
Founded as Buffalo General Hospital in 1855 with 100 beds, Kaleida Health’s Buffalo General Medical
Center (BGMC) at 100 High Street and the adjoining Gates Vascular Institute (GVI) at 875 Ellicott Street
are now a 484-bed acute care hospital with over 3,300 employees located on the Buffalo Niagara
Medical Campus (BNMC) in the heart of Buffalo, NY. The BNMC is a 120-acre downtown hub for the
region’s leading healthcare, life sciences, research, and educational institutions. BGMC/GVI is a teaching
affiliate of the University at Buffalo’s Jacobs School of Medicine and Biomedical Sciences and offers a
wide range of clinical inpatient and outpatient care to the residents of Western New York and beyond.
In 2018, BGMC/GVI had 25,222 inpatient discharges and 73,437 outpatient visits. The hospital’s state-of-
the-art emergency department is the largest in the region with 53,530 patient visits recorded in 2018.
The emergency department features large private rooms in four separate pods including critical care,
sub-acute care, vascular care, and urgent care. Additionally, BGMC/GVI has a helipad to accommodate
transport of critically ill patients via medical helicopter, providing 24/7 immediate access to a life-saving
intervention or surgery. Specialized programs include cardiac, neurology and vascular services, general
surgery (including robotics), bariatrics, orthopedics, urology, pulmonary, colorectal, allergy and
immunology, otolaryngology, gynecologic surgery, gastroenterology, rehabilitation medicine, imaging,
labs, pathology, mammography screening, among others.
A collaboration between Kaleida Health and the University at Buffalo, the GVI opened in 2012 and brings
clinicians and researchers together under one roof. The results have been major breakthroughs in the
causes and treatment of cardiac, stroke, and vascular disease, while utilizing state-of-the-art technology
and innovative diagnostic treatment options in the care of patients.
Millard Fillmore Suburban Hospital
Kaleida Health’s Millard Fillmore Suburban Hospital (MFSH) opened its doors in 1974 at 1540 Maple
Road in the Town of Amherst, one of Western New York’s (WNY) fastest growing suburbs. Today, the
facility is a full service, 265-bed acute care hospital with over 1,800 employees providing a wide array
medical and surgical services, both inpatient and outpatient. In 2018, the hospital had 18,080 inpatient
discharges, 59,598 outpatient visits, and 49,845 emergency department visits. Additionally, the hospital
serves as a major clinical teaching affiliate of the University at Buffalo School of Medicine and
Biomedical Science.
Services at MFSH include acute care nursing units, ambulatory surgery, cardiology, cardiac non-invasive
procedures, GI lab, imaging with 3D Tomsynthesis mammography, interventional radiology, laboratory,
obstetrics and gynecology, neonatal care, oncology, palliative care, pulmonary function lab, respiratory
therapy, urology suite and vascular lab, women’s services, and specialty surgical services including hand
surgery, minimally invasive robotic surgery, neurosurgery and orthopedics.
Launched in 2014, the hospital’s Survivor Steps program is a supportive cancer rehabilitation and
recovery program for survivors of any type of cancer diagnosis with the focus on improving an
individual’s physical and emotional functioning as well as their quality of life. Survivor Steps is unique in
that it can help those throughout their battle with cancer from diagnosis to remission. A 10-bed Level II
Neonatal Intensive Care Unit (NICU) specializing in the care of ill or premature newborn infants opened
at MFSH in October 2015.

                    Kaleida Health 2019-2021 Community Health Needs Assessment-Community Service Plan           8
John R. Oishei Children’s Hospital
Kaleida Health’s John R. Oishei Children’s Hospital (OCH) is a new, state-of-the-art, freestanding
children’s hospital located at 818 Ellicott Street on the Buffalo Niagara Medical Campus and connected
to Buffalo General Medical Center and the Gates Vascular Institute. The hospital dates back to 1892 and
was previously located at 219 Bryant Street as Women & Children’s Hospital of Buffalo. A 185-bed
facility with over 1,600 employees, OCH is a regional center for comprehensive pediatric, neonatal,
surgical, perinatal and obstetric services as well as a teaching hospital for the University at Buffalo’s
Jacobs School of Medicine and Biomedical Science. In 2018, OCH had 12,815 inpatient discharges,
115,259 outpatient visits, and 53,530 emergency department visits. Approximately 65% of OCH patients
are Medicaid beneficiaries.
OCH services include emergency, inpatient, outpatient, and surgical services in the areas of pediatric,
neonatal, surgical, perinatal, and obstetrical. Specialty areas include general and thoracic surgery,
adolescent medicine, allergy/immunology, dermatology, ear/nose/throat, endocrinology/diabetes,
epilepsy, gastroenterology, genetics, hematology/oncology, infectious diseases, labor and delivery,
neonatology, nephrology, neurology, ophthalmology, orthopedics, pulmonology, rheumatology,
urology, trauma, sexual assault treatment, among others.
OCH has the only NYS Regional Perinatal Center for WNY, the only Level IV Neonatal Intensive Care Unit
and the only Level I Pediatric Trauma Unit serving the region, and a Pediatric Intensive Care Unit. The
hospital has a helipad for emergency transport of sick or injured children. Its outpatient specialty care
clinics in the new Oishei Children’s Outpatient Center provide services to children with special
healthcare needs through the hospital’s Robert Warner Rehabilitation Center and the Children’s Guild
Foundation Autism Spectrum Disorder Center. Additionally, OCH operates a child psychiatry clinic, two
pediatric primary care clinics and two OB-GYN clinics, and is home to Oishei Healthy Kids, a NYS
Medicaid Health Home Serving Children, Children’s Healthy Weigh of Buffalo, Craniofacial Center of
WNY, Early Childhood Direction Center, Lead Poisoning Prevention Resource Center, Safe Babies New
York, Sickle Cell & Hemoglobinopathy Center of WNY, and the Youth Link Program addressing pediatric
HIV.
DeGraff Memorial Hospital
Kaleida Health’s DeGraff Memorial Hospital (DeGraff), located at 445 Tremont Street, North Tonawanda,
NY, was established in 1914 to serve the healthcare needs of WNY’s Northtown communities. DeGraff, a
community hospital with approximately 300 full-time and part-time employees, provides a wide array of
medical services with a focus on emergency and outpatient care. In 2018, the hospital had 324 inpatient
admissions, 26,963 outpatient visits, and 11,944 emergency visits. DeGraff services include emergency
care, case management/patient management, cancer rehabilitation and recovery, cardiac-non-invasive
testing, cardiac rehabilitation, imaging, blood draw, laboratory and pathology, occupational therapy,
physical therapy, speech language therapy, sub-acute rehabilitation, and pharmacy. The facility also
includes Buffalo Therapy Services.
Due to declining inpatient admissions, inpatient and outpatient surgery over the last few years, DeGraff
experienced declining revenue and operational challenges. In 2017, the hospital announced its DeGraff
2020 plan to right size inpatient care with a strengthened focus on emergency department access and
outpatient services. In 2018, in response to community need, DeGraff expanded and renovated its
emergency department from 4,800 square feet to approximately 10,000 square feet. The new, modern,
technology-based emergency department has a physical layout that maximizes the delivery of patient-
focused care and allows for better access, parking and visibility for patients, families and visitors.
Kaleida Health 2019-2021 Community Health Needs Assessment-Community Service Plan 9DeGraff serves as an urgent care gateway for patients requiring more specialized tertiary care at Kaleida
Health’s Buffalo General Medical Center/Gates Vascular Institute, the new John R. Oishei Children’s
Hospital and Millard Fillmore Suburban Hospital.
Caring for the Underserved
Kaleida Health has initiatives in place to assist individuals to access affordable health care. Through its
Financial Counseling program, counselors are available at Kaleida Health facilities to support patients
who are uninsured/underinsured and in need of financial assistance. The counselors assist and advocate
for the patient to enroll them in appropriate medical coverage including Medicaid and Child Health Plus.
Charity care is also available to for those patients who have incurred a financial hardship and do not
have the resources to reimburse Kaleida Health for services rendered. These programs are based
income and asset verification.
Medicaid provides health insurance for low-income individuals and a high percentage of Medicaid
patients are provided health care services at Kaleida Health hospitals. In 2018, of the total inpatient
discharges, emergency department visits, and outpatient visits for all four hospitals, 35.8% were
Medicaid.
Kaleida Health Hospitals - YTD 2018 Total Inpatient Discharges, Emergency Department Visits,
Outpatient Visits (Kaleida Health – EPSI FY2018) *Does not include other Kaleida Health non-
hospital services.
Buffalo Millard
John R. Oishei DeGraff Total Kaleida
General Fillmore
Children’s Memorial Health
Medical Suburban
Hospital Hospital Hospitals
Center Hospital
Medicaid 45,886 118,724 16,558 6,777 277,801
All Payers 158,456 181,604 127,523 39,231 774,937
% Medicaid 28.9% 65.3% 13.0% 17.2% 35.8%
Kaleida Health has supported the NYS DSRIP (Delivery System Reform Incentive Payment) program in
WNY as a partner in the Millennium Collaborative Care (MCC) PPS to assure access to affordable,
preventive, and quality care for the Medicaid population and to meet the statewide DSRIP goal of
reducing avoidable hospital admissions by 25% over five years.
In 2016, John R. Oishei Children’s Hospital (OCH) established a NYS Medicaid Health Home Serving
Children named Oishei Healthy Kids to provide care management to Western New York children with
Medicaid who have complex physical and/or behavioral health conditions. Currently, 1,293 children are
enrolled in the program and 38 children are in the outreach phase. Primary health home partners
include Child and Family Services, Endeavor, Gustavus Family Services, Jewish Family Services, Native
American Community Services, People, Inc., Say YES, Summit and the ARC. OCH also provides healthcare
services to medically underserved children in Buffalo Public Schools through its seven School Based
Health Centers.
Buffalo General Medical Center/Gates Vascular Institute (BGMC/GVI) is home to the MedLaw
Partnership of WNY offering patients legal expertise and services at no charge to address patients’
health-related social needs. The service offers a range of advice and counsel in matters such as income
maintenance, health insurance, housing and utilities, employment issues, legal status, health care proxy,
power of attorney, simple wills family issues, consumer issues, and mortgage foreclosure. BGMC/GVI
doctors, nurses and care providers are encouraged to refer patients in need of legal assistance to the
MedLaw Partnership. Since opening on January 2, 2019, the MedLaw Partnership of WNY have assisted
Kaleida Health 2019-2021 Community Health Needs Assessment-Community Service Plan 10with 171 referrals. The hospital joins a growing list of over 300 hospitals and healthcare centers in 46
states to implement a medical-legal partnership.
Through its Language Assistance Service program, Kaleida Health provides interpreting and translation
services to Limited English Proficient (LEP) patients. Every patient or patient representative with a
communication barrier who enters a Kaleida Health facility is advised of her or her right to Language
Assistance Services, and the service is provided free of charge.
The Visiting Nursing Association of WNY, Inc., Kaleida Health’s home care affiliate, also works to
promote the health of the community. This includes educating chronic care patients on self-
management and personal care in areas such as rehabilitation services, nutrition education and therapy,
infection control, falls risk assessment and intervention, depression risk assessment and intervention
and health education related to improved lifestyle choices for individuals and families in their homes
and the community.
Kaleida Health’s Community Health Services provide outreach and health education programs, speakers
on health-related topics, and community referrals to people of all ages. Programs and events promote
the reduction of health disparities, effective use of health services, and promote overall community
health and wellness. Topics range from health insurance enrollment to diabetes, stroke, heart disease,
maternal and child health, and health career exploration. In 2018, 46,483 people were reached through
community service programming. All outreach programs are free and reach a cross section of cultures,
ethnicities, languages, religions and genders, including the LGBTQ community. Throughout 2019-2021,
Kaleida Health will continue to participate in multiple events in various communities across Western
New York, including Buffalo, a city with a poverty rate of 30.9% and several census tracts federally
designated as Medically Underserved Areas.
Community Served
Kaleida Health serves Western New York’s (WNY) eight counties of Allegany, Cattaraugus, Chautauqua,
Erie, Genesee, Niagara, Orleans and Wyoming. The population for the region is approximately 1.5
million with Erie County and Niagara County comprising an estimated 1.1 million of this total. Kaleida
Health has three hospitals located in Erie County and one hospital located in Niagara County. In 1st
quarter 2018, overall Kaleida Health market share was 40.7% for Erie County and 31.31% for Niagara
County. 2 Erie County and Niagara County are the focus of this Kaleida Health 2019-2021 Community
Health Needs Assessment-Community Service Plan (CHNA-CSP) as they are the WNY counties identified
as primary service areas for Kaleida Health hospitals. Each hospital’s primary service area is defined in
the following tables as the county with the highest percentage of all WNY counties for 2018 inpatient
discharges, emergency department visits and outpatient visits.
2 IBM Market Expert (NYS SPARCS) 1st qtr. 2018
Kaleida Health 2019-2021 Community Health Needs Assessment-Community Service Plan 11Erie County - Hospital Location and Primary Service Area
• Buffalo General Medical Center/Gates Vascular Institute – 100 High St. Buffalo, NY 14203
Buffalo General Medical Center – 2018 Inpatient Discharges, ED Visits, Outpatient Visits (Kaleida
Health, EPSI, FY2018)
2018 WNY 8 County Total No. Erie County No./% of Total
Inpatient Discharges 25,222 18,283/72.4%
Emergency Department Visits 59,797 52,114/87.1%
Outpatient Visits 73,437 61,190/83.3%
• Millard Fillmore Suburban Hospital – 1540 Maple Rd., Williamsville, NY 14221
Millard Fillmore Suburban Hospital – 2018 Inpatient Discharges, ED Visits, Outpatient Visits
(Kaleida Health, EPSI, FY2018)
2018 WNY 8 County Total No. Erie County No./% of Total
Inpatient Discharges 18,080 13,459/74.4%
Emergency Department Visits 49,845 39,605/79.4%
Outpatient Visits 59,598 48,303/81.0%
• John R. Oishei Children’s Hospital – 818 Ellicott St., Buffalo, NY 14203
John R. Oishei Children’s Hospital – 2018 Inpatient Discharges, ED Visits, Outpatient Visits
(Kaleida Health, EPSI, FY2018)
2018 WNY 8 County Total No. Erie County No./% of Total
Inpatient Discharges 12,815 9,869/77.0%
Emergency Department Visits 53,530 45,559/85.1%
Outpatient Visits 115,259 92,954/80.6%
Niagara County – Hospital Location and Primary Service Area
• DeGraff Memorial Hospital – 445 Tremont St., North Tonawanda, NY 14120
DeGraff Memorial Hospital – 2018 Inpatient Discharges, ED Visits, Outpatient Visits (Kaleida
Health, EPSI, FY2018)
2018 WNY 8 County Total No. Niagara County No./% of Total
Inpatient Discharges 324 214/66.0%
Emergency Department Visits 11,944 7,253/60.7%
Outpatient Visits 26,963 *11,948/44.3%
*DeGraff Memorial Hospital is located on the border of Niagara County and Erie County and
therefore serves a high number of Erie County residents. 14,771/54.8% of outpatient visits at DeGraff
represent Erie County residents.
Kaleida Health 2019-2021 Community Health Needs Assessment-Community Service Plan 12Map of Western New York by County – Kaleida Health’s Primary Service Area (blue)
Demographics and Population – Erie County
Erie County is located in the western portion of New York State bordering Lake Erie, and lies on the
international border between the United States and Canada. It includes a total area of 1,227 square miles,
of which 1,043 square miles is land and 184 square miles is water. 3 Erie County is largely an urban county
with the majority of the population living within its cities and surrounding suburban communities. There
is also a significant rural population that resides outside of the first and second ring suburban areas of the
county’s largest city of Buffalo.
Erie County’s total 2018 population is 919,719. There are three cities in Erie County including Buffalo,
population 256,304; Lackawanna, population 17,768; and Tonawanda, population, 14,798. Buffalo is the
second largest city in the state and the largest city in the region and serves as the county seat. In addition,
there are 16 villages, 25 towns, and two Native American Indian reservations within the county, including
the Tonawanda Reservation in the northeastern part of the county in the town of Akron and the
Cattaraugus Reservation in the southwestern part of the county bordering Cattaraugus County. The town
of Amherst is one of the county’s largest towns with a population of 125,659. 4
3 Wikipedia, Erie County
4 US Census, 2018 Population Estimates
Kaleida Health 2019-2021 Community Health Needs Assessment-Community Service Plan 13Buffalo is home to Kaleida Health’s Buffalo General Medical Center/Gates Vascular Institute and John R.
Oishei Children’s Hospital and Amherst is home to Kaleida Health’s Millard Fillmore Suburban Hospital.
The table below identifies key population characteristics of the City of Buffalo, Town of Amherst, Erie
County and all of New York State.
Population Demographics for Buffalo, Amherst, Erie County, New York State (US Census, Quick Facts, Population Estimates, July 1, 2018)
Descriptive Buffalo Amherst Erie County New York State
Population Total
Population Estimates 256,304 125,659 919,719 19,542,209
Age
Persons under 5 years 6.8% 4.7% 5.5% 5.9%
Persons under 18 years 22.9% 19.3% 20.4% 20.9%
Persons 65 years and over 12.2% 19.2% 17.5% 15.9%
Race or Ethnicity
White alone 47.6% 80.6% 79.4% 69.6%
Black or African American alone 37.1% 6.5% 14.0% 17.7%
American Indian and Alaska Native alone 0.4% 0.2% 0.7% 1.0%
Asian alone 5.2% 8.9% 3.8% 9.1%
Hispanic or Latino 11.3% 3.7% 5.5% 19.2%
Income & Poverty
Median Household Income (in 2017
$34,268 $72,459 $54,006 $62,765
dollars) 2013-2017
Persons in Poverty 30.9% 10.8% 14.5% 14.1%
Housing (2013-2017)
Owner-occupied housing unit rate 41.0% 70.6% 65.0% 54.0%
Median value of owner-occupied
$77,800 $186,600 $139,900 $293,000
housing units
Median gross rent $735 $1,020 $778 $1,194
Families & Living Arrangements (2013-
2017)
Households 110,636 49,872 386,371 7,302,710
Language other than English spoken at
17.6% 15.8% 10.3% 30.6%
home, percent of persons age 5 years+
Education (2013-2017)
High School Graduate or Higher, percent
83.9% 95.4% 91.1% 86.1%
of persons age 25+
Bachelor’s Degree or Higher, percent of
25.8% 55.3% 32.9% 35.3%
persons age 25+
Health
With a disability, under age 65 years,
12.7% 5.7% 9.2% 7.5%
2013-2017
Persons w/o Health Insurance, under 65 7.1% 2.9% 4.5% 6.6%
Disparities exist throughout Erie County and particularly in the city of Buffalo. While 79.4% of the
population of Erie County is white, 69.5% of the total New York State population is white, and 47.6% of
the population of Buffalo is white. Buffalo has a high minority population with 37.1% of its residents
being African American and 11.3% Hispanic as compared to all of Erie County with 14.0% being African
American and 5.5% Hispanic or Latino. New York State’s African American population is 17.7% and its
Hispanic population is 19.2%. The Town of Amherst has a significant Asian population of 8.9% while the
Asian population in Erie County is just 3.8%. 5
Erie County has had an influx of foreign-born and refugees settling in the area throughout the last 10
years. From 2000 to 2010, the Buffalo-Niagara Metropolitan Area saw a 33% rise in its foreign-born
population, growing from 4.4% of the total population in 2000 to 6.0% in 2010. From 2003 to 2013, Erie
County resettled 9,723 refugees. In 2016, of the 5,028 refugees resettled in New York State, 1,361 or
34% resettled in Erie County. Buffalo is home to a majority of these refugees. The top 14 countries of
5 US Census, 2018 Population Estimates
Kaleida Health 2019-2021 Community Health Needs Assessment-Community Service Plan 14origin for immigrants and refugees in Erie County from 2008 to 2016 include Afghanistan, Burma,
Bhutan, Burundi, Congo, Democratic Republic of Congo, Cuba, Ethiopia, Eritrea, Iraq, Iran, Somalia,
Sudan, and Syria. 6 (Buffalo Brief, February 2018, Immigrants, Refugees, and Languages Spoken in
Buffalo)
The 2018 Population Estimates indicate that 10.3% of Erie County residents speak a language other than
English at home, age 5+ years, 2013-2017, as compared to 17.6% in Buffalo. 7 Among Buffalo Public
School students, English as a New Language (ELL) students comprise 15% of the district’s total
enrollment. While Spanish is the primary language of Buffalo’s ELL students, in 2016-2017, the district
had 5,668 ELL students with 83 different languages spoken. In addition to language barriers, it is
important to note that many of the refugees have societal and cultural differences, and several have
experienced trauma and other hardships. 8 Lackawanna, just south of Buffalo, is home to a large Yemen
community, many of whom do not speak English. 19.0% of Lackawanna residents speak a language
other than English at home (age 5+ years), 2013-2017. 9
While Erie County’s poverty rate is 14.5%, Lackawanna’s poverty rate is 25.4%, and Buffalo’s poverty
rate is 30.9%. 10 Furthermore, Buffalo has the fourth highest youth poverty rate in the country. Of the
58,618 Buffalo residents under 18 years of age, 27,678 or 47% of those children live below the federal
poverty level. The Erie County rate is 19.8% and the NYS rate at 20.8%. Only Detroit, Rochester and
Cleveland have worse youth poverty rates. 11 The median household income in Buffalo is $34,268 while
the median household income in Erie County is $54,006 and in New York State, it is $62,765. 12
There are other economic variances throughout the county. The median value of owner-occupied
housing units (2013-2017) is $77,800 in Buffalo, $186,600 in Amherst and $139,900 in Erie County as
compared to $293,000 in New York State. The owner-occupied housing unit rate in the city of Buffalo is
41.0% while the rate in Erie County is 65.0%, and the rate in Amherst is 70.6%. 13
The 2018 average unemployment rate is 4.4% for Erie County, 5.7% for Buffalo and 3.5% for Amherst. 14
Educational attainment in the high-poverty communities such as Buffalo and Lackawanna is also a
challenge. In Erie County, 91.1% of persons age 25+ are high school graduates or higher while the rate is
83.9% in Buffalo and 80.4% in Lackawanna. In Erie County, 32.9% of persons age 25+ have a bachelor’s
degree or higher while the rate is 25.8% in Buffalo and 13.7% in Lackawanna. Furthermore, the Buffalo
Public School District’s 2018 four-year high school graduation rate is 63.9%. Poverty and racial disparities
are evident throughout its 31,203 students with 79% eligible for the federal free lunch program and 80%
representing a minority population. In Lackawanna, 82% of its 1,900 students are eligible for the federal
free lunch program and 37% represent a minority population. 15
In light of the success of the Affordable Care Act and New York State of Health to increase the number of
individuals with health insurance, the rate of persons under 65 years without health insurance in the
City of Buffalo is 7.1% while the Erie County rate is 4.5%, and the Amherst rate is 2.9%. 16 The percentage
of individuals with public coverage is 54.1% in Buffalo, 30.2% in Amherst, and 38.5% in Erie County. 17
6 Buffalo Brief, February 2018; Immigrants, Refugees and Languages Spoken in Buffalo
7 US Census, 2018 Population Estimates
8 Buffalo Brief, February 2019; Immigrants, Refugees and Languages Spoken in Buffalo
9 US Census, 2018 Population Estimates
10
US Census, 2018 Population Estimates
11 Buffalo Business First, Buffalo Post the Nation’s Fourth Worst Poverty Rate for Children, G. Scott Thomas, January 15, 2019
12 US Census, 2018 Population Estimates
13 US Census, 2018 Population Estimates
14
2018, NYS Department of Labor
15 https://data.nysed.gov/
16 US Census, 2018 Population Estimates
17 US Census, 2017 American Community Survey
Kaleida Health 2019-2021 Community Health Needs Assessment-Community Service Plan 15Access to a regular source of care is a concern among the uninsured and underinsured as well as the
general population given provider shortages throughout the region. In Erie County, the primary care
provider rate is 1,230:1 and the Niagara County rate of 2,300:1 as compared the New York State (NYS)
rate of 1,200:1. The mental health provider rate for Erie County is 360:1 while the rate for Niagara
County is 960:1 and the rate for NYS is 370:1. 18 Mobility and transportation issues may further
contribute to lack of access to healthcare services. The rate of individuals with a disability (under age 65
years) in the City of Buffalo, a city of significant poverty, is 12.7% while the rate throughout Erie County
is 9.2%, and the rate in the more affluent Town of Amherst is 5.7%, while the NYS rate is 7.5%. The rate
of persons with an ambulatory difficulty in Erie County is 7.5% and the NYS rate is 6.7%. Persons with an
ambulatory difficulty, such as serious difficulty walking or climbing stairs, may be limited in their physical
activity and may have unique requirements for accessibility, such as ramps or elevators. Individuals in
urban areas may have access to public transportation options, but mobility issues may still be a
challenge. Lack of a privately owned vehicle challenges all populations in accessing healthcare services.
The rate of occupied housing units with no vehicles is 12.99% in Erie County and 9.86% in Niagara
County. 19
In Erie County, 88.4% of adults 18 years and over, age-adjusted, have a usual source of health care while
11.6% do not have a usual source of health care. 20 The percentage of Erie County adults aged 18 to 64
years that report having visited a doctor for a routine checkup within the past year (2014) is 78.1% and
the NYS rate is 70.9%. 21 The age-adjusted rate of adults in Erie County who were unable to afford to see
a doctor in the past 12 months is 6.2% while the NYS rate is 11.5%. 22 The percentage of children who
have had the recommended number of well child visits in government sponsored insurance programs in
Erie County is 71.6% while the NYS rate is 74.0%. 23 (2016 NYS Prevention Agenda Dashboard, NYSDOH
Office of Quality and Patient Safety data as of February 2018)
Demographics and Population – Niagara County
Niagara County is located in the western portion of New York State (NYS), just north of Buffalo (Erie
County) and adjacent to Lake Ontario on its northern border and the Niagara River and Canada on its
western border. The county has a total area of 1,140 square miles, of which 522 square miles is land and
617 square miles is water. The county’s total population is 210,443 and is comprised of urban, suburban,
and a significant rural population. Its cities include Niagara Falls with a population of 48,144, North
Tonawanda with a population of 30,372, and its county seat of Lockport with a population of 20,434. 24
North Tonawanda is home to Kaleida Health’s DeGraff Memorial Hospital.
18 2019 County Health Rankings
19 US Census, 2013-2017 American Community Survey
20 2016, NYS Expanded Behavioral Risk Factor Surveillance Survey
21
2014, NYS Behavioral Risk Factor Surveillance Survey
22 2016, NYS Expanded Behavioral Risk Factor Surveillance Survey
23 2016, NYS Department of Health, Prevention Agenda Dashboard, Office of Quality and Patient Safety data as of February 2018
24 Wikipedia, Niagara County
Kaleida Health 2019-2021 Community Health Needs Assessment-Community Service Plan 16The table below identifies key population characteristics of Niagara County and the cities of Niagara
Falls, North Tonawanda, Lockport and for all of NYS.
Population Demographics for Niagara Falls, North Tonawanda, Lockport, Niagara County, New York State (US Census, Quick Facts,
Population Estimates, July 1, 2018)
North
Descriptive Niagara Falls Lockport Niagara County New York State
Tonawanda
Population Total
Population Estimates 48,144 20,434 30,372 210,433 19,542,209
Age
Persons under 5 years 6.8% 6.3% 5.7% 5.2% 5.9%
Persons under 18 years 22.3% 22.4% 18.6% 20.1% 20.9%
Persons 65 years and over 15.4% 15.0% 18.5% 18.5% 15.9%
Race or Ethnicity
White alone 69.5% 87.6% 95.2% 87.8% 69.6%
Black or African American alone 22.6% 6.6% 1.5% 7.3% 17.7%
American Indian and Alaska
1.5% 0.1% 0.4% 1.1% 1.0%
Native
Asian alone 1.0% 1.5% 0.4% 1.1% 9.1%
Hispanic or Latino 3.6% 4.2% 2.1% 2.9% 19.2%
Income & Poverty
Median Household Income (in
33,965 $41,477 $53,002 $51,656 $62,765
2017 dollars) 2013-2017
Persons in Poverty 27.5% 15.4% 8.8% 12.4% 14.1%
Housing (2013-2017)
Owner-occupied housing unit
57.2% 57.0% 68.9% 71.5% 54.0%
rate
Median value of owner-occupied
$69,900 $88,500 $112,600 $114,800 $293,000
housing units,
Median gross rent $645 $693 $666 $669 $1,194
Families & Living Arrangements
(2013-2017)
Households 21,299 8,992 13,667 87,978 7,302,710
Language other than English
spoken at home, persons 5+ 5.0% 4.3% 3.9% 4.1% 30.6%
years
Education (2013-2017)
High School Graduate or Higher,
87.8% 87.5% 92.7% 91.0% 86.1%
percent of persons age 25+
Bachelor’s Degree or Higher,
17.5% 21.0% 24.5% 23.5% 35.3%
percent of persons age 25+
Health
With a disability, under age 65
12.9% 10.6% 12.7% 10.0% 7.5%
years, 2013-2017
Persons w/o Health Insurance,
6 .4% 8.1% 5.1% 5.1% 6.6%
under 65
Disparities exist throughout Niagara County including its small cities and rural areas. While most of
Niagara County is white (87.8%), a high percentage of historically, underserved minority populations
reside in Niagara Falls given that 22.6% of residents are black-African American. 4.1% of Niagara County
households speak a language other than English at home (5+ years) and the rate is 5.0% in Niagara Falls.
While Niagara County’s poverty rate is 12.4%, poverty is significant in Niagara Falls with a 27.5% poverty
rate, Lockport at 15.4% and North Tonawanda at 8.8%. The poverty rate for children under 18 years of
age in Niagara County is 18.4% and the NYS rate is 20.8%. 25
The median household income (2013-2017 in 2017 dollars) in Niagara County is $51,656 as compared to
$62,765 in NYS. Income disparities are further evidenced in the cities of Niagara County with a median
household income of $33,965 in Niagara Falls and $41,477 in Lockport. (US Census, 2018 Population
25 US Census, 2018 Population Estimates
Kaleida Health 2019-2021 Community Health Needs Assessment-Community Service Plan 17Estimates) The Tuscarora Reservation with a population of 1,288 has a poverty rate of 13% and a
median income of $32,500, much lower than that of Niagara County. 26
There are other economic variances throughout the county. The median value of owner-occupied
housing units (2013-2017) is $114,800 in Niagara County with a low of $69,900 in Niagara Falls as
compared to $293,000 in NYS. The owner-occupied housing unit rate in Niagara County is 71.5% while
the rate in Niagara Falls is 57.2%. 27 The 2018 average unemployment rate is 5.2% for Niagara County
and 6.7% for Niagara Falls, 6.0% for Lockport and 4.4% for North Tonawanda. 28
Educational attainment in the high poverty communities such as Niagara Falls and Lockport is also a
challenge. In Niagara County 91.0% of persons age 25+ are high school graduates or higher while the
rate is 87.8% in Niagara Falls and 87.5% in Lockport. In Niagara County, 23.5% of persons age 25+ have a
bachelor’s degree or higher as compared to the NYS rate of 35.3%. This rate is even lower in Niagara
Falls with 17.5% of persons age 25+ with bachelor’s degree or higher. 29 The four-year graduation rate for
students of the Niagara Falls City School District is 63%. Poverty and racial disparities are evident
throughout its 6,648-student base as 63% of students are eligible for the federal free lunch program and
59% of students represent a minority population. The graduation rate in Lockport is 87%, and in North
Tonawanda, the rate is 75%. Lockport and North Tonawanda also have a significant percentage of
students eligible for the federal free lunch program with 47% of Lockport students and 40% of North
Tonawanda students. 30
In light of the success of the Affordable Care Act and New York State of Health to increase the number of
individuals with health insurance, the rate of persons without health insurance is still high in some cities
and rural areas. Lockport has a rate of 8.8% for uninsured persons under 65 year while Niagara Falls and
North Tonawanda both have a 5 to 6% rate and Niagara County has a rate of 5.1% of uninsured persons
under 65 years. The NYS rate of uninsured under 65 years is 6.6%. 31 The percentage of individuals with
public coverage is 56.2% in Niagara County and 72.4% in Niagara Falls. 32
Access to a regular source of care is a concern among the uninsured and underinsured as well as the
general population. In Niagara County, the primary care provider rate (2016) is 2,300:1 as compared to
neighboring Erie County with the provider rate at 1,230:1 and the NYS rate at 1,200:1. The mental
health provider rate (2018) for Niagara County is 960:1 while the rate in Erie County is 360:1 and in NYS
is 370:1. 33
Mobility issues may further contribute to inaccessibility to healthcare services. The rate of individuals
with a disability (under age 65 years) in the city of Niagara Falls, a city of significant poverty, is 12.9%
while the rate throughout Niagara County is 10.0%. The rate of persons with an ambulatory difficulty in
Niagara County is 7.7% and the NYS rate is 6.7%. Persons with an ambulatory difficulty may be limited in
physical activity leading to a further decline in health and may have unique requirements for
accessibility, such as ramps or elevators. Individuals in urban areas may have access to public
transportation options, but mobility issues may still be a challenge. Lack of a privately owned vehicle
challenges all populations in accessing healthcare services. The rate of occupied housing units with no
vehicles is 12.99% in Erie County and 9.86% in Niagara County. 34
26 Wikipedia, Niagara County, US Census 2000
27
US Census, 2018 Population Estimates
28 2018, NYS Department of Labor
29 US Census, 2018 Population Estimates
30 https://data.nysed.gov
31
US Census, 2018 Population Estimates
32 US Census, 2017 American Community Survey
33 2019 County Health Rankings
34 US Census, 2013-2017 American Community Survey
Kaleida Health 2019-2021 Community Health Needs Assessment-Community Service Plan 18In Niagara County, 85.9%% of adults 18 years and over (age-adjusted), have a usual source of health
care while 11.6% do not have a usual source of health care. 35 The percentage of Niagara County adults
aged 18 to 64 years that report having visited a doctor for a routine checkup within the past year (2014)
is 75.3% and the NYS rate is 70.9%. 36 The age-adjusted rate of adults in Niagara County who were unable
to afford to see a doctor in the past 12 months is 10.0% while the NYS rate is 11.5%. 37The percentage of
children who have had the recommended number of well child visits in government sponsored
insurance programs in Niagara County is 78.5% while the NYS rate is 74.0%. 38
Health Status of the Community
This assessment of the health of Erie County and Niagara County was conducted by Kaleida Health using
data from multiple sources including the County Health Rankings, New York State Department of Health
(NYSDOH), NYS Prevention Agenda Dashboard, NYS Vital Records, NYS Statewide Planning and Research
Cooperative system (SPARCS), NYS Expanded Behavioral Risk Factor Surveillance Survey (eBRFSS),
Centers for Disease Control and Prevention (CDC), among others. Kaleida Health further engaged the
Erie County Department of Health, the Niagara County Department of Health, and other partners in the
development of the complete assessment including surveys and focus group sessions with input from
the underserved as described in the Community Engagement section of this report.
County Health Rankings and Leading Causes of Death
The County Health Rankings & Roadmaps program, a collaboration of the Robert Wood Johnson
Foundation and the University of Wisconsin Population Health Institute, provide annual actionable data
to identify health issues of concern to a community and to plan strategies for health intervention
throughout the counties of the United States. The 2019 County Health Rankings has ranked Erie County
and Niagara County as follows:
• Health Outcomes - Erie County is ranked 56 out of 62 counties in New York State (NYS) for
length of life and 51 out of 62 counties for pre-mature death. Niagara County is ranked 56 out of
62 counties and Niagara County is ranked 58 out of 62 counties in NYS for length of life and 61
out of 62 counties for pre-mature death. Health outcomes as based on equal weighting of length
and quality of life.
• Erie County is ranked 32 out of 62 counties and Niagara County is ranked 52 out of 62 counties
in NYS for health factors, based on weighted scores for health behaviors, clinical care, social and
economic factors, and the physical environment.
Leading causes of all deaths in Erie County and Niagara County are indicated below:
• Heart disease is the number one cause of death in the counties and accounts for 183.2 per
100,000 population of all deaths in Erie County and 232.4 per 100,000 in Niagara County. Cancer
is the next leading cause of death in the counties at 166.0 per 100,000 population in Erie County
and 175.0 per 100,000 in Niagara County. It is important to note that cancer is the number one
cause of premature (disease at 50.9 per 100,000 population, unintentional injury at 49.0 per 100,000 and stroke at
28.4 per 100,000. 39
Chronic Disease
Cardiovascular Disease
The CDC states that about 610,000 people die of heart disease in the United States every year – that is
one in every four deaths. (https://www.cdc.gov/heartdisease/facts.htm )
A number of health descriptors indicate that both Erie County and Niagara County have a higher
percentage of its population suffering from cardiovascular disease than all of New York State (NYS), and
Niagara County rates fare worse than Erie County rates.
• The cardiovascular disease premature death rates (ages 35-64) per 100,000 is 132.6 in Erie
County and much higher at 152.9 in Niagara County while the NYS rate is 102.4 40
• The cardiovascular disease hospitalization rates per 10,000 is 163.8 for Erie County and
significantly higher in Niagara County with a rate of 197.9 while the NYS rate is 149.9. 41
• The age-adjusted heart attack hospitalization rates per 10,000 (2014-2016) is 16.65% in Erie
County and even higher in Niagara County with a rate of 23.6% while the NYS rate is 13.8%. 42
Racial and ethnic disparities exacerbate the cardiovascular disease rates in Erie and Niagara counties.
• The mortality rate for diseases of the heart per 100,000 population (age-adjusted) for Erie
County is 217.5 for Non-Hispanic, African Americans, 174.5 for whites, and 135.2 for Hispanics.
• The mortality rate for diseases of the heart per 100,000 population (age-adjusted) for Niagara
County is 293.4 for Non-Hispanic, African Americans, 220.9 for whites, and 197.7 for Hispanics. 43
Disparities further exist among women. According to the American Heart Association, cardiovascular
disease is the number one cause of death in American women and claims over 400,000 lives each year
equating to one death every 80 seconds. Unfortunately, the statistics are worse for women of color. The
prevalence of cardiovascular disease among African-American women is nearly 48% versus 35% among
Caucasian women. 44 Erie County and Niagara County rates demonstrate the disparities:
• The Erie County emergency department visit rate due to hypertension per 10,000, 18+ years at
over in Erie County is 26.3 for women and 23.0 for men. In Niagara County, the rate for women
is 27.0 and 23.5 for men. 45
Heart disease is largely preventable and knowledge is key. In a 2012 survey conducted by the American
Heart Association, 56% of women were unaware that heart disease in the leading cause of death among
women. Additionally, only 36% of black women and 34% of Hispanic women knew that heart disease is
their leading cause of death, compared to 65% of white women. 46
High Blood Pressure
High blood pressure (also referred to as HBP or hypertension) is when an individual’s blood pressure,
the force of blood flowing through your blood vessels, is consistently too high. Nearly half of American
adults have high blood pressure. Many don’t even know they have it. (American Heart Association,
39
2016, NYS Vital Statistics data as of May 2018
40 2014-2016, NYS Vital Statistics data as of May 2018
41 2016, NYS SPARCS data as of December 2017
42 2016, NYS SPARCS data as of August 2016
43
2014-2016, Erie County and Niagara County Health Indicators by Race/Ethnicity, NYS Department of Health
44 American Heart Association, www.heart.org
45 2014-2016, NYS SPARCS data
46 American Heart Association, www.heart.org
Kaleida Health 2019-2021 Community Health Needs Assessment-Community Service Plan 20www.heart.org) According to the CDC, high blood pressure increases the risk of dangerous health
conditions including heart attack, stroke, and kidney disease.
The impact of high blood pressure among Erie County and Niagara County residents is exemplified by
below statistics:
• The age-adjusted percentage of adults with physician-diagnosed high blood pressure (2016) is
26.7% in Erie County, and the rate is 29.5% in Niagara County while the NYS rate is 28.39%. 47
• The age-adjusted hypertension emergency department visit rate per 10,000, age 18 year and
older is 25.0 in Erie County and 25.5 in Niagara County and the NYS rate of 28.4. 48
Hypertension rates are significantly higher among minority populations in Erie and Niagara counties.
• The age adjusted Erie County emergency department visit rate due to hypertension per 10,000
18+ years is 96.5 for African Americans and 34.3 for Hispanics versus 14.2 for the white
population.
• The age-adjusted Niagara County emergency department visit rate due to hypertension per
10,000 18+ years is 118.5 for African Americans and 32.7 for Hispanics versus 19.1 for the white
population. Niagara County is home to the Tuscarora Indian Reservation, and the emergency
department visit rate for this American Indian population is extremely high at 54.4. 49
Stroke
According to the CDC, a stroke causes brain tissue to die, which can lead to brain damage, disability and
death. Stroke is the fifth leading cause of death in the United States and the leading cause of serious
long-term disability. This is disturbing because about 80% of strokes are preventable. Individuals can
greatly reduce their risk for stroke by making lifestyle changes to help control your blood pressure and
cholesterol levels and, in some cases, by taking medication. The CDC states that about 140,000
Americans each year – that is one out of every 20 deaths and costs the United States an estimated $34
billion each year in healthcare services, medicine to treat stroke and missed days of work.
Stroke rates in Erie County and Niagara County are significantly higher than for New York State (NYS) as
evidenced by below 2014-2016 statistics.
• The age-adjusted cerebrovascular disease (stroke) mortality rate per 100,000 is 36.8 for Erie
County and 30.6 for Erie County while the NYS rate is 25.6. 50
• The age-adjusted cerebrovascular disease (stroke) hospitalization rate per 10,000 is 27.2 in Erie
County and 27.1 in Niagara County while the NYS rates is much lower at 21.2. 51
Disparities exist for stroke among the minority populations of Erie County and Niagara County as
evidenced by below data.
• The Erie County age-adjusted cerebrovascular disease (stroke) mortality rate per 100,000
population (2012-2014), is 35.0 for the white population while it is 52.1 for African Americans
and 24.9 for Hispanics.
• The Niagara County age-adjusted cerebrovascular disease (stroke) mortality rate per 100,000
population (2012-2014), is 29.6 for the white population while it is 43.5 for African Americans
and 19.0 for Hispanics. 52
47 2016, NYS Expanded Behavioral Risk Factor Surveillance System
48 2016, NYS SPARCS data as of December 2017
49
2014-2016, NYS SPARCS data
50 2014-2016, NYS Vital Statistics as of May 2018
51 2016, NYS SPARCS data as of December 2017
52 2014-2016, Erie County and Niagara County Health Indicators by Race/Ethnicity, NYS Department of Health
Kaleida Health 2019-2021 Community Health Needs Assessment-Community Service Plan 21You can also read


