Children and Young People's Needs Assessment - Kingston upon Thames September 2017 - Kingston ...
←
→
Page content transcription
If your browser does not render page correctly, please read the page content below

Children and
               Young People’s
              Needs Assessment

Kingston upon Thames

September 2017

Contact:
Kingston Data Team
data@kingston.gov.uk

[Type here]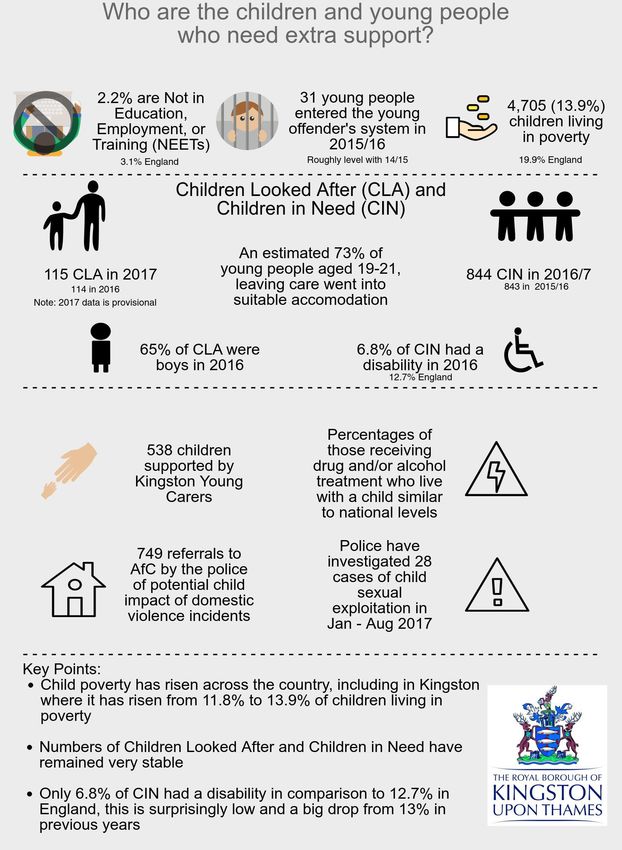
Contents
Introduction ................................................................................................................................. 4
Executive Summary .................................................................................................................... 5
Progress and Priorities for 2018/19 ............................................................................................. 8
National Context ....................................................................................................................... 10
Local Context ............................................................................................................................ 13
   The Children and Young People’s Plan .................................................................................................... 13
   Kingston’s approach to commissioning ................................................................................................... 14
   Achieving for Children (AfC) .................................................................................................................... 14
   Ofsted Inspection .................................................................................................................................... 14
   Local Safeguarding Children Board (LSCB) .............................................................................................. 15
   Kingston LSCB .......................................................................................................................................... 15
   Kingston LSCB Annual Report 2016/17 ................................................................................................... 15
   Serious Case Review ................................................................................................................................ 16
   Kingston Youth Council............................................................................................................................ 16
   Further information................................................................................................................................. 17
Who makes up our population of children and young people? .................................................. 18
   Total population 19 or Under .................................................................................................................. 18
   Population by Ward................................................................................................................................. 18
   Population projections by age ................................................................................................................. 20
   Ethnic population projections ................................................................................................................. 23
   Births ....................................................................................................................................................... 24
   Migration ................................................................................................................................................. 24
Family, Households and Housing in Kingston ........................................................................... 25
   Households .............................................................................................................................................. 25
   Families and household types ................................................................................................................. 25
   Housing tenure ........................................................................................................................................ 25
   Housing type............................................................................................................................................ 26
   Housing projections ................................................................................................................................. 26
   Child yield from housing .......................................................................................................................... 27
   Number of school places ......................................................................................................................... 27
Kingston – How many schools do we have? ............................................................................. 28
What are the characteristics of our school pupils? .................................................................... 29
   Number of school pupils ......................................................................................................................... 29
   Ethnic diversity of school pupils .............................................................................................................. 29
   English as an additional language ........................................................................................................... 30
   Special Educational Needs (SEN) ............................................................................................................. 31
                                                                                                                                                                 2
Attainment and absences: a high performing borough .............................................................. 32
   Pupil absences ......................................................................................................................................... 32
   Early Years Foundation Stage Profile (EYFSP).......................................................................................... 32
   Key Stage 1 Attainment ........................................................................................................................... 33
   Key Stage 2 attainment ........................................................................................................................... 34
   Key stage 4 attainment............................................................................................................................ 38
How healthy are our children? ................................................................................................... 40
   Breastfeeding prevalence........................................................................................................................ 40
   Childhood immunisations........................................................................................................................ 40
   Childhood obesity .................................................................................................................................... 41
   Child and Adolescent Mental Health (CAMHS) ....................................................................................... 43
   Teenage conceptions............................................................................................................................... 45
   Alcohol, Smoking and Drugs .................................................................................................................... 46
Children who may need extra support ....................................................................................... 48
   Children in low income families/Child poverty ....................................................................................... 48
   Children living in poor quality/inadequate housing ................................................................................ 48
   Inadequate Housing Arrangements ........................................................................................................ 49
   Free school meals .................................................................................................................................... 50
   Lone Parents ............................................................................................................................................ 51
   Children who care ................................................................................................................................... 51
   NEET and Not Known .............................................................................................................................. 51
   Young offenders ...................................................................................................................................... 52
   Missing Children and Child Sexual Exploitation (CSE) ............................................................................. 52
   Female Genital Mutilation (FGM)............................................................................................................ 53
   Children in Need ...................................................................................................................................... 53
   Looked after children (LAC) ..................................................................................................................... 56
   Impact of Domestic Violence................................................................................................................... 61
   Parental Substance Misuse ..................................................................................................................... 62
   Parent Mental Ill Health .......................................................................................................................... 64

                                                                                                                                                             3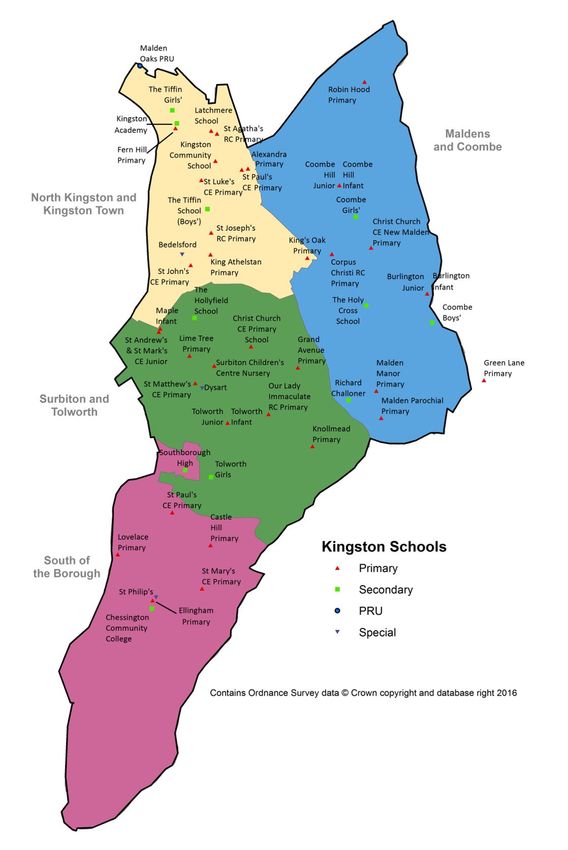
Introduction
This document brings together a range of information about children and young people (0-19 years old)
living and studying in the Royal Borough of Kingston upon Thames to help assess the varying and
changing needs of this section of society. This document has been produced as a strategic needs
assessment in partnership with the London Borough of Richmond upon Thames.

In April 2014, the London Borough of Richmond upon Thames and the Royal Borough of Kingston upon
Thames created a community interest company, Achieving for Children (AfC), to provide our children’s
services. This innovative structure is a completely new way of delivering Council services. AfC, acting as
the mechanism for delivering front line services to children and young people across both boroughs,
produces a range of local needs assessments and profiles throughout the course of their work. However,
as commissioning organisations, it is important for us as Councils to continue to assess and review the
overall needs of children and young people to inform our commissioner-service delivery relationship with
AfC.

The Joint Strategic Needs Assessment (JSNA) for Kingston provides in depth needs assessments and
chapters on a large selection of health and well-being specific issues and provides commissioners with the
information needed to ensure effective service provision in the borough. This Children and Young
People’s Needs Assessment sits within the suite of needs assessments. It specifically is the chapter for
Children’s Safeguarding but fulfils a wider purpose to inform the commissioning of AfC and the Children
and Young People’s Plan.

                                                                                                         4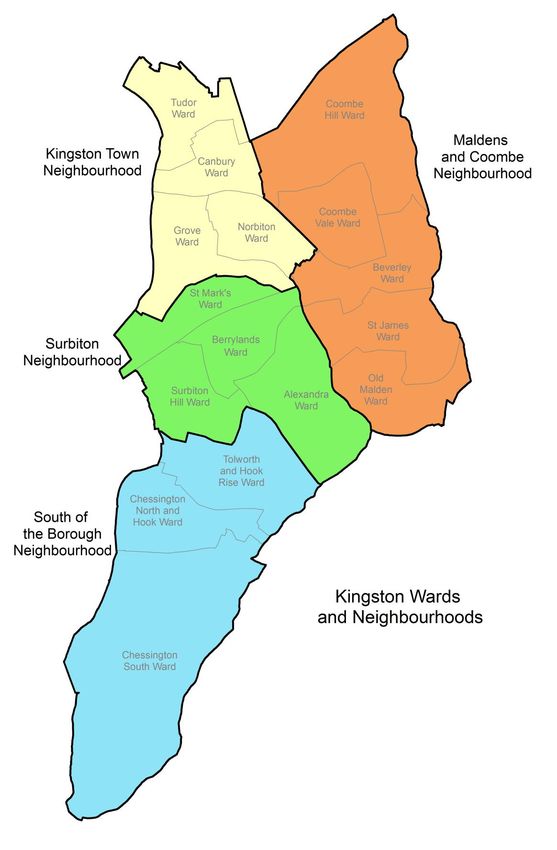
Executive Summary

                    5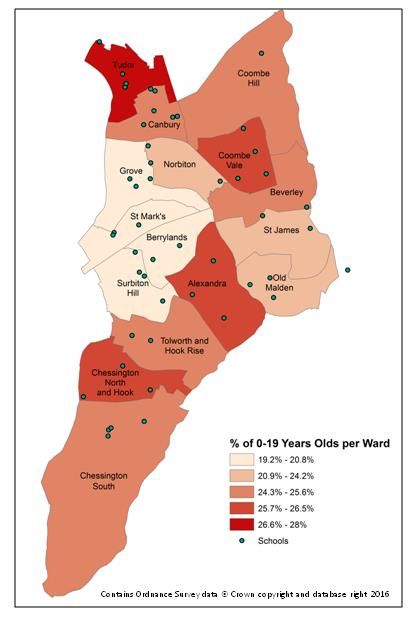
6
7

Assessment Highlights, Progress and Priorities for 2018/19
There has been a slight rise in the population in the last year of those aged 19 and under from
41,600 to 42,100 but the rise since 2011 is over 6,000 and the projections for 2026 add another
5,000. These rises lead to considerable pressure on services and require service providers to
meet the demand for universal provision (ie schools and healthcare) and look carefully at
demand management for specialist provision. The situation is obviously heightened when
considered against the severe financial constraints public services are under.
The spacial distribution of children and families across the borough also has significant impact
on service demand. Canbury (the area just to the north of Kingston station) has the highest
population of any ward in the borough, estimated at over 4,000 young people. The wards of
Canbury and Tudor in the north west of the borough have the highest proportion of children aged
19 and under at 27% and 28% respectively. This is reflected in the continuing high demand for
primary school places within the area.
Schools within the borough provide a good education for children and young people with high
Ofsted ratings and attainment levels. Recent changes in attainment monitoring has made
comparison to previous years difficult but there are gaps in attainment for black young people at
GCSE level and for those eligible for pupil premium grants.
Nationally there are concerns about rising obesity in children. In Kingston there are very low
levels when children start school at age 5 (84% healthy weight) but by the time they leave
primary school aged 11 there is a sharp rise in the proportion of obese and over weight children
(67% healthy weight). These trends can be seen nationwide but it does not reduce the concern
and potential demand for future physical and mental health services.
Child poverty increased from 4,000 to 4,700 (2013 to 2014). This rise is also reflected nationally
but it should be noted that this rise was when significant changes to welfare benefits were
implemented which affect households of single parents and children most significantly. These
changes are also reflected in the number of households in temporary accommodation which
increased to 671 in March 2017 (629 in 2016). Although these figures are lower than those for
much of the country this is still a significant proportion of children and families.
11% of pupils have Special Educational Needs of which 2.8% have a statement or Educational
Health and Care Plan. The Joint Strategic Needs Assessment for Special Educational Needs
was published during the year and contains significant detail on service provision and 29
recommendations for implementation.
Attainment at school for pupils in receipt of Free School Meals is considerably lower than
average and approximately half of all Children in Need receive Free School Meals and a high
proportion of pupils with Special Eduational Needs also have Free School Meals.
There has been good news for service demand within social care; the number of referrals to
social care, children in need and children looked after were stable during the year which is
reflected in the rates (number per ten thousand) which have declined. This shows that demand
is being successfully managed by Achieving for Children. However, further detailed work is
planned in the coming year to look at the turnover hidden within those figures and placement
types as this will assist in understanding spending. Performance of Achieving for Children,
being monitored through their monthly reporting, has been good and generally performance
exceeds national averages. There were a couple of exceptions which are being addressed by
Achieving for Children.
The main legislative change during the year has been the Children and Social Work Act 2017.
The Act mainly focuses on Children Looked After, care leavers and local safeguarding children’s
boards. There is now a requirement to publish a local offer for care leavers and offer support to
8
them up to the age of 25. In 2016 78% of care leavers aged up to 21 were in touch with
Achieving for Children. Only about half of care leavers are in employment, education or training.
This is the same as national rates but, nevertheless, a cause of concern for future public
services.
Early Years Learning / Education
90% of nursery provision graded by Ofsted as Number of births has remained stable, although at
Good or Outstanding. much higher levels than 10 years ago. However
growth plans for the borough will increase the
Breast feeding and immunisation take up remain
number of dwellings and demand for school places.
high, but still progress to be made.
Priorities Good Attainment 8 and Progress 8 results for
Preparation for extension of child care provision Kingston in comparison to england
to 30 hours
Implementation of the joint health and early
years reviews for 2-2½ year old children Priorities
All schools to be rated by Ofsted as Good or
Outstanding
Close the gap in attainment between those with
Social Care and without pupil premiums and of different
ethnicities
Numbers of Children Looked After, Children in Provision of sufficient school places as dwelling
Need and children with a Child Protection Plan number increase
have stabilised but the numbers of children with a
Child Protection Plan remain high.
Health / Prevention / Early Help
Performance levels of AfC for children looked after
remain very high but have dropped since the
78% of pupils were ‘quite’ or ‘very’ happy with their
Ofsted inspection.
lives. This is reflected in the low numbers of self-
harm related hospital admissions. Rates of alcohol
Priorities
admissions and NEET remain low. Teenage
Ensure placements of CLA are appropriate, in
conceptions have also decreased.
borough and scrutinised
Services for CLA and CP need particular focus There continues to be a low percentage of healthy
on those aged 16+ weight children in Y6.
Special Educational Needs & transitions from
children’s to adults services Numbers of first time entrants to youth justice
remain extremely low.
Families Far more young carers are being supported by
Kingston Young Carers than identified in the census
Percentage of young people in RBK with English of 2011.
as an Additional Language (EAL) is increasing.
Priorities
Child poverty numbers have increased as have the
number of households in temporary Monitor and address Y6 obesity in RBK by
accommodation. ensuring services work together in a joined up
way
Priorities Reduce anxiety around exams
Ensure families live in appropriate housing Services for and outreach to young carers
Ensure return home interviews are promoted Work together to stop children going missing
for all missing children from home, school and care by raising
awareness and ensuring rigorous safeguarding
procedures to prevent and improve our ability to
monitor CSE
Tackle issues of risky and unhealthy behaviours
of young people amongst specific groups
9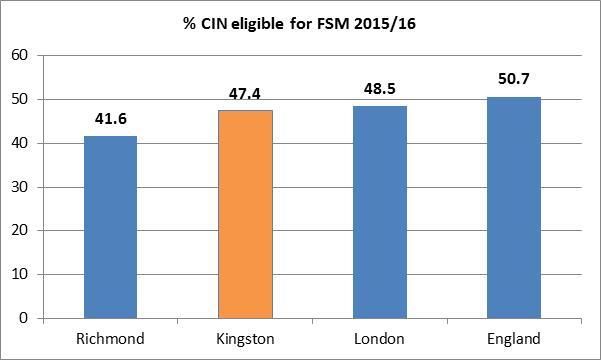
National Context
This section provides a brief summary of recent and forthcoming legislative and regulatory changes
impacting on children and young people and the services provided to them.

The Children and Social Work Act 2017 updates sections of the Children’s Act 2004, making provision
about looked-after children, the welfare and safeguarding of children, as well as outlining the roles of
social workers and corporate parents. It outlines the local authorities’ duty to looked after children, and
previously looked after children, as well as the requirements for local authorities to publish a ‘local offer for
care leavers’, which provides information about services the local authority offers that may assist or help
prepare care leavers for adulthood and independent living. Finally, there have been updates to the
sections on the provision of education relating to relationships and sex, changes to Local Safeguarding
Children’s Boards and on child death reviews. In respect of the latter, hitherto this was undertaken by
Local Safeguarding Children Boards but the local authority and clinical commissioning group will now
assume responsibility for this function as lead partners.

The Children Act 1989 (Amendment) (Female Genital Mutilation) Bill 1is currently going through the
legislative process in Parliament. FGM is recognised internationally as a violation of the human rights of
girls and women. A number of legislative changes on FGM were introduced by the Serious Crime Act
2015, which was given royal assent on 3 March 2015. The first reading of this amended Bill took place on
3 July 2017; and a second reading is yet to be scheduled at time of publication.

The Immigration Act 2016 2amends Schedule 3 of the Nationality, Immigration and Asylum Act 2002, in
order that former looked after children, who have no immigration permission when they turn 18, will be
excluded from receiving all forms of care leaving support under the relevant sections of the Children Act
19893. This Act will remove the automatic right to support for the unaccompanied asylum seeker following
their 18th birthday. The local authority will therefore generally no longer have a duty as a corporate parent
to safeguard the welfare of former looked after children who are visa over-stayers, have never regularised
their status, or are ‘appeal rights exhausted’ following an unsuccessful asylum claim when they are 18 or
older.

The Education and Adoption Act 2016 4focuses on schools in England that are causing concern,
outlining the provision for their conversion into Academies. It also describes the methods for joint
arrangements for carrying out local authority adoption functions in England. The Act makes amends to
the Education and Inspections Act 2006, updating the eligibility for local authority intervention and sending
warning notices to schools.

Working parents with young children now have 30 hours of free childcare available to them as a result of
the updates to the Childcare Act 20165. The duty for publishing information about childcare and related
matters by local authorities has also been amended.

In January 2016, the Department for Education published its vision for Children’s Social Care Reform6.
The Government wants every child in the country to have the opportunity to fulfil their potential, and is

1https://www.google.co.uk/url?sa=t&rct=j&q=&esrc=s&source=web&cd=6&cad=rja&uact=8&ved=0ahUKEwjA26fj7rrV

AhUQmbQKHboZDeMQFghHMAU&url=https%3A%2F%2Fapps.warwickshire.gov.uk%2Fapi%2Fdocuments%2FWC
CC-850-644&usg=AFQjCNEsvuGPVLHbqq9xKKSTyhz2h6qsfQ

http://services.parliament.uk/bills/2017-19/childrenact1989amendmentfemalegenitalmutilation.html
2   http://www.nrpfnetwork.org.uk/Documents/immigration-bill-careleavers.pdf
3These include sections 23C, 23CA, 23CZA, 23D, 24A or 24B, the ‘leaving care provisions’: accommodation, financial
support, contact, a personal adviser, a pathway plan, funding for education or training and ‘staying put’ with foster
carers.
4   http://www.safecic.co.uk/freebies/55-free-downloads-and-safeguarding-links/401-eng
5   http://www.legislation.gov.uk/ukpga/2016/5/pdfs/ukpga_20160005_en.pdf
6https://www.gov.uk/government/uploads/system/uploads/attachment_data/file/491968/Childrens_social_care_reform

_a_vision_for_change.pdf

                                                                                                                  10
working across organisations to implement appropriate and effective changes. Their vision to do this
includes focusing on people and leadership; practice and systems; and governance and accountability.
The Government aims to ensure that every local children’s social care service across this country has a
workforce with the knowledge and skills to support children’s needs, and is driving for excellence.
In July 2016, Sir Martin Narey conducted an independent review of children’s residential care in
England. His review included analysis and recommendations for improving the commissioning of
residential care; fostering, closeness to home and secure care; the criminalisation of children; Ofsted;
children’s home staff; and Staying Put. The Government has made commitments to several of Narey’s
recommendations including using the Children’s Social Care Innovation Programme to test innovative
ways in which residential care could be used in a more dynamic and creative way to support children and
to link seamlessly with other care placements and services; introducing Staying Close for those leaving
residential care; inviting local authorities to come together to bid to pilot new larger scale, regional
commissioning arrangements; undertaking a national stocktake of foster care; and clarifying the steps that
residential care workers can take to protect children. The Government sought views on fostering from
April to June 2017, and are currently analysing this feedback before moving forward with the
recommendations.
The Government has set out its strategy for breaking the cycle of disadvantage, and working to end child
poverty, in the Child Poverty Strategy 2014-177. This includes supporting families into work and
increasing their earnings; improving living standards; and preventing poor children becoming poor adults
through raising their educational attainment. The strategy builds on the 2011 strategy, and focuses on
tackling the root causes of poverty.
Prevent 8is part of the Government’s counter-terrorism strategy, CONTEST, and aims to stop people
becoming terrorists or supporting terrorism, by working with sectors and institutions where there is risk of
radicalisation which needs addressing. The Government believes that it is vital for Prevent to engage with
schools, higher and further education, as these establishments play a vital role in preparing young people
to challenge extremism and the ideology of terrorism. Schools can also help to protect children from
extremist and violent views in the same ways that they help to safeguard children from drugs, gang
violence or alcohol. Engaging with schools will have a large impact on children and young people in the
UK.
The Home Education (duty of Local Authorities) Bill (HL) 2017-199 makes provision for local
authorities to monitor the educational, physical and emotional development of children receiving elective
home education, and for connected purposes. It also outlines the responsibility of the parent to register
their child with the local authority, and the role of the local authority in assessing the child’s educational,
physical and emotional development. This Bill is currently in the House of Lords.
There has been a growing awareness of mental health over the past year, and the Schools (Mental
Health and Wellbeing) Bill [HL] 2017-19 10is designed to make provision for state maintained schools to
promote the mental health and wellbeing of their pupils alongside academic attainment, amending the
Education Act, 2002. This Bill is currently in the House of Lords.
In amendment to the Immigration and Asylum Act 1999, the Unaccompanied Asylum Seeking Children
(Legal Advice and Appeals) Bill (HL Bill 53)11 outlines the duty of the Secretary of State to ensure the
provision of legal advice for unaccompanied asylum seeking children as soon as possible after a child is
first encountered by any public authority, and must meet the fees and costs associated with the legal
advice.
7
https://www.gov.uk/government/uploads/system/uploads/attachment_data/file/324103/Child_poverty_strategy.pdf
8 https://www.gov.uk/government/uploads/system/uploads/attachment_data/file/97976/prevent-strategy-review.pdf
9http://services.parliament.uk/bills/2017-19/homeeducationdutyoflocalauthorities.html
https://publications.parliament.uk/pa/bills/lbill/2017-2019/0011/lbill_2017-20190011_en_2.htm#l1g4
10 http://services.parliament.uk/bills/2017-19/schoolsmentalhealthandwellbeing.html
https://publications.parliament.uk/pa/bills/lbill/2017-2019/0040/lbill_2017-20190040_en_2.htm#l1g2
11 https://publications.parliament.uk/pa/bills/lbill/2017-2019/0053/lbill_2017-20190053_en_2.htm#l1g3
11Child Sexual Exploitation12
Child sexual exploitation “occurs where an individual or group takes advantage of an imbalance of power
to coerce, manipulate or deceive a child or young person under the age of 18 into sexual activity (a) in
exchange for something the victim needs or wants, and/or (b) for the financial advantage or increased
status of the perpetrator or facilitator. The victim may have been sexually exploited even if the sexual
activity appears consensual. Child sexual exploitation does not always involve physical contact; it can also
occur through the use of technology”.
Perpetrators of child sexual exploitation are found in all parts of the country and are not restricted to
particular ethnic groups. Local Safeguarding Children Boards (LSCBs) are responsible for ensuring that
appropriate local procedures are in place to tackle child sexual exploitation. All frontline practitioners need
to be aware of those procedures (including ones for early help) and how they relate to their own areas of
responsibility. LSCBs and frontline practitioners should ensure that actions to safeguard and promote the
welfare of children and young people who are sexually exploited focus on the needs of the child.
The Child Sexual Exploitation Protocol 13is a non-statutory document produced to help practitioners,
local leaders and decision makers to identify Child Sexual Exploitation (CSE) in London. The Protocol
outlines the identification of CSE, and operations for safeguarding and protecting the welfare of children
from CSE in London. It is a police-led protocol, and complements the existing London Child Protection
Procedures.
Following the Ofsted report ‘Missing Children’ published in February 2013, the Department for Education
(DfE) released guidance relating to the safeguarding of children who run away or go missing from care in
January 2014. Local authorities are responsible for protecting children whether they go missing from their
family home or from local authority care. The guidance details the role of the local authority, LSCB and
agencies, and defines the need to establish a Runaway and Missing From Home and Care (RMFHC)
protocol.
Welfare Reform
The Welfare Reform Act 2012 and Welfare and Work Act 2016 aims to ensure people are better off in
work than out of work. For example, the Benefit Cap aims to ensure that working-age households on out-
of-work benefits will no longer receive more in benefits than the average weekly wage.
Changes to benefits introduced via the government’s Welfare Reform agenda include:
The Benefit Cap which limits total benefit income. The total benefit threshold was decreased by the
government in November 2016 to £23,000 which has resulted the a doubling of the number of households
in Kingston impacted by the Benefit Cap
The reduction in Spare Room Subsidy (RSRS), or ‘bedroom tax’ brought in April 2013 means that working
age residents in social housing who have more bedrooms in their property than they need, according to
the size criteria, have their housing benefit reduced accordingly
Localisation of Council Tax benefits so that each local authority manages their criteria, rather than a
centrally governed scheme
Personal Independence Payments – Disability Living Allowance is being replaced by Personal
Independence Payments. Re-assessment for existing claimants is being rolled out across the country;
new claimants have had to claim PIP from June 2013 and existing claimants are being re-assessed.
Universal Credit, which brings together housing and out-of-work benefits and tax credits into one payment,
is being rolled out nationally. Initial rollout is for new, single claimants with full roll out scheduled by the
DWP for March 2018 in Kingston.
12 https://www.nwgnetwork.org/what-is-cse/
13 http://www.redbridgelscb.org.uk/wp-content/uploads/2016/04/London-CSE-Operating-Protocol-Final-June-2017.pdf
12Households that have been impacted most by welfare benefit changes are single parents with dependent
children. This has been seen nationally and locally in Kingston where the majority of those impacted by
the Benefit Cap are single parents 14.
Healthcare
Clinical Commissioning Groups are membership organisations made up of GPs. The responsibility for
Public Health was transferred to local authorities. The Kingston CCG is made up of the 25 GP practices in
Kingston working alongside health practitioners from community healthcare, pharmacy and secondary
care. South West London Collaborative Commissioning is made up of Croydon, Kingston, Merton,
Richmond, Sutton and Wandsworth NHS Clinical Commissioning Groups and NHS England.
The Kingston Health and Well-being Board is a statutory body with responsibility for strategic decision
making for local health and social care services. Membership consists of representatives from NHS, public
health, social care and children’s services, elected representatives and representatives from HealthWatch
(an independent consumer champion) who come together to identify how they can work with each other to
better the health and well-being of people in their area.
Care Act 2014
The Care Act 2014, together with a range of regulations and statutory guidance, is the base upon which
social care will develop over the next few decades. It enshrines the new statutory principle of individual
wellbeing, the driving force behind the Act, and makes it the responsibility of local authorities to promote
wellbeing when carrying out any of their care and support functions. Most of the Act’s changes take effect
from April 2015. However, the major reforms to the way social care is funded, including the care cap and
care account will not come into operation until April 2020.
Under the Care Act 2014, local authorities will have a duty to consider the needs of children living in
households where there is an adult who has a disability or impairment that requires help or care as part of
a “whole family assessment”.
The act also enables children to have their own carers' needs assessment carried out, and introduces a
new right for young carers aged 16 to 18 who are transitioning to adulthood to have their specific needs
assessed in light of how their role might change.
The measures, alongside those introduced in the Children and Families Act 2014, aim to identify child
carers and their support needs earlier.
Local Context
The Children and Young People’s Plan
The Kingston Children and Young People’s Plan 2017/20 is a collaborative document that sets the vision
for children’s services in the borough across all partners including the Council, health services, police and
voluntary sector. Published in 2017, it sets out five themes around which the outcomes for children are
focussed:
1. Keeping children and young people safe and supported at home and school
2. Helping children and young people to be healthy and make good choices about their health
3. Ensuring children and young people enjoy life, do well in school and get involved in activities
4. Prevention: Providing help to families when they need it
5. Making sure services are right for families and work well.
14 Impact of Welfare Reforms in Kingston, 2016
13Kingston’s approach to commissioning
Reductions in funding have led local authorities to take a fundamental look at how services are delivered,
to ensure that they are making the most effective and efficient use of resources. In Kingston, the Council
has identified strategic commissioning as an approach to help meet the challenges ahead.
Commissioning is about deciding what service is needed, how it should be delivered and by whom – be it
public, private or voluntary sector. This will include exploring how things can be done differently rather
than being constrained by how things have been done in the past. In Kingston, the Council and its
partners have looked for opportunities to jointly commission services, as reflected by the creation of joint
posts with the CCG, sharing services with other Local Authorities and Achieving for Children (AfC). AfC is
a community interest company commissioned jointly by Richmond and Kingston Councils to provide
children’s services across both boroughs.
AfC offers greater capacity for safeguarding and looking after the most vulnerable children in both
boroughs; responsive, joined-up preventative services based around local clusters; and high quality
support and challenge for schools through the School Performance Alliance for Richmond and Kingston
(SPA[RK]). At the same time, the efficiencies created by bringing together services and setting up a Joint
Management Team help meet the financial challenges ahead.
Achieving for Children (AfC)
The main service areas that AfC delivers on are:
Prevention and early help – organising targeted support to children and young people to ensure good
school attendance, promote family wellbeing, and prevent crime and anti-social behaviour; also providing
specialist support for children with special educational needs and disabilities.
Child protection – a single point of access for referral and assessment, and the development of
interventions and support for children requiring protection.
Social care – provision for children in care including fostering and adoption, and services for care leavers.
Education – planning sufficient school places, managing school admissions, and providing challenge and
support to schools, early years providers and governing bodies so that they are able to carry out their
statutory duties.
Health integration – working with general practitioners, public health and health care providers to ensure
integrated services for all children and young people.
The commissioning intentions of the Council for AfC are reviewed each year to ensure they meet the
needs of the borough’s children, young people and families.
Ofsted Inspection
In summer 2015 Ofsted inspected Kingston’s services for children in need of help and protection, children
looked after and care leavers and reviewed the effectiveness of the local safeguarding children board.
The determination published in August 2015 stated that Children’s services in the Royal Borough of
Kingston upon Thames are “good”. This outcome is a considerable achievement for all involved in
children’s services.
The executive summary of the Ofsted report states that:
“Services to children and their families have been transformed since the last inspections of children looked
after services and safeguarding. The 2012 safeguarding and looked after children inspection found
services for looked after children to be adequate and safeguarding services to be inadequate. The 2013
inspection of local authority arrangements for the protection of children also found provision to be
14inadequate. Council leaders, together with Achieving for Children (AfC), the Local Safeguarding Children
Board (LSCB) and the Children’s Services Improvement Board (CSIB), have successfully delivered
against an ambitious improvement plan. This has led to an impressive level of change in service delivery
for children and families across Kingston upon Thames. Almost all areas identified for improvement in the
previous inspections have been addressed in full and this is having a positive impact for children.”
A number of recommendations for improvement were made which have been incorporated into actions
plans for the future.
The Ofsted inspection of LB Richmond was conducted in autumn 2017 and resulted in a ‘good’
determination of Children’s Services.
Local Safeguarding Children Board (LSCB)
Kingston LSCB
Kingston Local Safeguarding Children Board’s (LSCB) role is to ensure that relevant agencies and
professionals work together to protect the borough’s children from abuse, harm and neglect.
The LSCB develops, monitors and reviews child protection and child safety policies, procedures and
practice within Kingston. It also co-ordinates and provides inter-agency training for staff across the
borough who work with children and families.
The LSCB’s job is to have an overview of how effectively children are safeguarded and identify
improvements where necessary. For this reason, the LSCB is an independent body that can check on the
work of all organisations working with children and families.
Kingston LSCB Annual Report 2016/17
The following is an extract from the foreword from the LSCB Annual Report for 2016/17. The complete
document is available on the LSCB website.
The annual report considers the priorities identified for the year, what has been achieved, provides
information on the LSCB, data on the demography and services in the borough and provides the priorities
for 2017/18.
The priorities for 2016/17 were to:
Scrutiny of transitions between agencies, teams and sectors including those of children to adults’
services
An enhanced focus on matters of ethnicity and diversity, and reinforcing outreach to community
and faith groups
The strengthening of communication and information sharing between professional interfaces
A focus on the mental health and emotional wellbeing to run through all our work to ensure
stronger prevention and timely help, and
Plan for the implementation of the Wood Report.
The priorities for 2017/18 are:
Transition of children between agencies, teams and sectors, including those of children to adults’
services;
Continued learning and development around ethnicity and diversity;
Outreach to community and faith groups;
Communication and information sharing to be strengthened between professional interfaces; and
A focus on the mental health and emotional wellbeing, to run through all our work to ensure
stronger prevention and timely help.
15Serious Case Review
The serious case review subgroup has met seven times this year, including one extraordinary meeting;
the group has overseen three learning and improvement case reviews.
The group has overseen several local serious incidents, Councillor safeguarding requirements, a review of
injuries to some children in summer 2016, together with Hounslow LSCB, an overview of a presentation of
a young baby to Kingston Hospital, A&E, as well as the learning and development framework of local case
reviews.
Kingston Youth Council
The Kingston Youth Council (KYC) is a proactive group of young people aged between 11 and 19 (or 25 if
they have additional needs) who actively represent the views, interests, concerns and aspirations of young
people in Kingston. The Youth Council undertakes consultations and peer research with young people to
establish a clear picture of their needs and use this information to influence decisions and bring about
positive change for young people in the borough.
A scheme called Recruits Crew allows young people to have a say in the recruitment of staff in the Royal
Borough of Kingston. Members of the Recruits Crew can create interview questions and sit on an
interview panel when potential employees are being considered.
Youth Associates is a project for young people to have their say on services offered to young people.
They help by designing, co-producing and contributing to, evaluating and developing services and
provision that are accessed by young people. There are three roles available to young people in the
borough:
Youth inspection which involves inspecting youth centres, libraries, sexual health clinics, leisure
centres and other places that young people access
Policy proofing which involves reviewing and exploring policies to make sure that the Royal
Borough of Kingston’s policies take full consideration of young people’s needs, wishes and
concerns
Social action researchers which allows young people to carry out research projects on behalf of
services to review them, identify areas for improvement and make sure they are young people
friendly
The Kingston Youth Council outlined following priorities in their manifesto for 2015-2017:
Mental Health and Wellbeing
Dealing with stress
Internet safety
Good mental health
Sexual health
Substance Misuse
Legal and illegal highs
Smoking
Cannabis
Alcohol
Areas for further research
NEET in care
YP with disabilities
Child Sexual Exploitation
Radicalism
16 Young People and crime
Work experience opportunities
Education about life skills and budgeting
They plan on tackling these issues through activities such as:
Working with professionals, schools, and council services to help them offer a better service to
young people
Conducting peer research to find out issues affecting young people
Making films and hold events to create awareness
Attending public meetings to represent young people
Working with school councils across the borough
Organising a crime conference in Spring 2018
Further information
The AfC Equality Needs Assessment can be found on the Achieving for Children website15. The document
brings together a range of equalities data and information about children and young people in both
Kingston upon Thames and Richmond upon Thames and is structured around the nine protected
characteristics.
15 http://www.achievingforchildren.org.uk/Equality-Diversity
17Who makes up our population of children and young people?
Total population 19 or Under
There are 42,144 children and young people in Kingston according to the latest population estimates from
the Office for National Statistics (2016 Mid-Year Estimates). In comparison to 2015/16, we have seen an
increase of 1.5% in the total population for Kingston. The age group where we saw the highest increase
was 5-9 (3.5%).
Total Total
Population Population Population Population population population
Area aged 0-4 aged 5-9 aged 10-14 aged 15-19 aged 0-19 All Ages
Kingston 11,694 11,642 9,443 9,365 42,144 176,107
London 635,561 579,680 487,596 468,639 2,171,476 8,787,892
England 3,429,000 3,428,300 3,070,300 3,179,400 13,007,000 55,268,100
Source: Office for National Statistics (2016 Mid-Year Estimates)
Population by Ward
The data for population by small areas such as ward or locality is not released by the Office for National
Statistics until later this year. As such, the below information is from the 2015 Mid-Year Estimates. A map
is also provided showing the percentage of young people per ward along with school locations in
Kingston. The highest concentration of young people is in Canbury ward which is quite an increase since
last year (14.3%). While wards such as Grove – which contains the town centre - and those around
Surbiton, have the lower concentration of young people. Chessington North and Hook showed the lowest
levels of concentration of young people.
Total
population
Number Number Total
Population by Number Number of Young
aged 10- aged 15- Population -
Ward aged 0-4 aged 5-9 People
14 19 All Ages
(aged 0-
19)
Alexandra 618 740 691 588 2,637 10,234
Berrylands 787 719 449 333 2,288 10,483
Beverley 796 869 707 558 2,930 11,400
Canbury 1,314 1,306 870 629 4,119 15,259
Chessington
585 607 578 513 2,283 9,267
North and Hook
Chessington
738 793 663 616 2,810 11,100
South
Coombe Hill 638 732 644 840 2,854 11,215
Coombe Vale 629 743 719 542 2,633 10,417
Grove 714 546 370 700 2,330 12,619
Norbiton 865 728 558 513 2,664 11,192
Old Malden 609 688 665 587 2,549 10,153
St James 495 636 694 575 2,400 9,599
St Mark's 695 557 309 1,231 2,792 11,978
Surbiton Hill 790 662 465 380 2,297 11,493
Tolworth and
821 806 605 528 2,760 11,010
Hook Rise
Tudor 582 857 824 576 2,839 10,284
Source: Office for National Statistics (2015 Mid-Year Estimates)
18% of % of % of % of % of % of % of % of % of
Young Total Young Total Young Total Young Total Total
Ward People Pop People Pop People Pop People Pop Pop
aged aged 0- aged 5- aged 5- aged 10- aged aged 15- aged aged 0-
0-4 4 9 9 14 10-14 19 15-19 19
Alexandra 23% 6% 28% 7% 26% 7% 22% 6% 26%
Berrylands 34% 8% 31% 7% 20% 4% 15% 3% 22%
Beverley 27% 7% 30% 8% 24% 6% 19% 5% 26%
Canbury 32% 9% 32% 9% 21% 6% 15% 4% 27%
Chessingt
on North 26% 6% 27% 7% 25% 6% 22% 6% 25%
and Hook
Chessingt
26% 7% 28% 7% 24% 6% 22% 6% 25%
on South
Coombe
22% 6% 26% 7% 23% 6% 29% 7% 25%
Hill
Coombe
24% 6% 28% 7% 27% 7% 21% 5% 25%
Vale
Grove 31% 6% 23% 4% 16% 3% 30% 6% 18%
Norbiton 32% 8% 27% 7% 21% 5% 19% 5% 24%
Old Malden 24% 6% 27% 7% 26% 7% 23% 6% 25%
St James 21% 5% 27% 7% 29% 7% 24% 6% 25%
St Mark's 25% 6% 20% 5% 11% 3% 44% 10% 23%
Surbiton
34% 7% 29% 6% 20% 4% 17% 3% 20%
Hill
Tolworth
and Hook 30% 7% 29% 7% 22% 5% 19% 5% 25%
Rise
Tudor 21% 6% 30% 8% 29% 8% 20% 6% 28%
Source: Office for National Statistics (2015 Mid-Year Estimates)
19Source: Office for National Statistics (2015 Mid-Year Estimates)
Population projections by age
The Greater London Authority (GLA) project the population of 0-19 year olds in Kingston borough to be
43,100 in 2017 and for this to increase to 47,700 in 2026.
The table below shows the projected population across the borough by gender and three age brackets
along with the census 2011 figures:
Year 0-19 20-64 65+
Male Female Persons Male Female Persons Male Female Persons
2011 19,120 19,070 38,240 50,270 51,460 101,730 8,950 11,560 20,510
2017 21,640 21,440 43,090 55,690 55,800 111,480 10,770 13,080 23,850
2021 22,960 22,530 45,480 58,040 57,620 115,660 11,810 14,000 25,810
2026 24,120 23,560 47,680 60,280 59,500 119,790 13,480 15,570 29,050
Source: GLA 2016 based demographic projections (Trend Projections, Central Migration Scenario)
The growing population will inevitably increase demand for universal services such as health and
education provision as well as homes in the borough.
20The tables below show population projections broken down by 5-year age bands for children and young
people by Neighbourhood, as well as the percentage change for each age group in each neighbourhood
from 2017. Each of the four neighbourhoods in Kingston is made up of multiple wards and the
neighbourhood boundaries correspond to ward boundaries (i.e. neighbourhood boundaries do not split
wards). A reference map is provided to show location of the neighbourhoods and to indicate which wards
comprise which neighbourhoods.
21Not surprisingly, the majority of age groups show an overall increase between 2017 and 2031. While
Maldens and Coombe and Surbiton shows decreases in 0-4 and 5-9 year olds, increases in the other
neighbourhoods more than offset these decreases. A large increase in the 10-14 year old and 15-19 year
old groups is expected in all neighbourhoods, most significantly Kingston Town where the 15-19 year old
group is projected to increase by 24.6% by 2031.
Neighbourhood Year 0-4 year olds 5-9 year olds 10-14 year olds 15-19 year olds
2017 3,297 3,219 2,514 2,320
2021 3,438 3,132 2,956 2,582
Kingston Town
2026 3,476 3,196 2,903 3,103
2031 3,502 3,235 2,959 3,078
2017 3,064 3,456 3,302 2,976
Maldens and 2021 3,132 3,326 3,669 3,063
Coombe 2026 3,136 3,385 3,586 3,490
2031 3,054 3,357 3,608 3,425
2017 2,060 2,080 1,787 1,588
South of the 2021 2,188 2,042 2,028 1,574
Borough 2026 2,215 2,151 2,022 1,865
2031 2,111 2,129 2,086 1,840
2017 2,740 2,512 1,839 2,437
2021 2,789 2,479 2,245 2,481
Surbiton
2026 2,786 2,530 2,271 2,917
2031 2,710 2,502 2,293 2,909
Source: GLA 2015 round SHLAA-based capped AHS Population Projections
Neighbourhood Year 0-4 year olds 5-9 year olds 10-14 year olds 15-19 year olds
2017 - - - -
2021 4.3% -2.7% 17.6% 11.3%
Kingston Town
2026 5.4% -0.7% 15.5% 33.8%
2031 6.2% 0.5% 17.7% 32.7%
2017 - - - -
Maldens and 2021 2.2% -3.8% 11.1% 2.9%
Coombe 2026 2.3% -2.1% 8.6% 17.3%
2031 -0.3% -2.9% 9.3% 15.1%
2017 - - - -
South of the 2021 6.2% -1.8% 13.5% -0.9%
Borough 2026 7.5% 3.4% 13.2% 17.4%
2031 2.5% 2.4% 16.7% 15.9%
2017 - - - -
2021 1.8% -1.3% 22.1% 1.8%
Surbiton
2026 1.7% 0.7% 23.5% 19.7%
2031 -1.1% -0.4% 24.7% 19.4%
*Note the table uses 2017 figures as comparisons
Source: GLA 2015 round SHLAA-based capped AHS Population Projections
The primary reason for the large growth in the number of 10-14 and 15-19 year olds is due to the aging of
the 0-4 year olds currently living in these areas. It remains to be seen whether the birth numbers will be
sustained or drop in the coming years and whether the substantial new builds planned in some areas will
yield similar numbers of children as has been seen historically.
22Ethnic population projections
As shown in the table below, the Kingston, Black, Asian and Minority Ethnic (BAME) population is
currently estimated to be 31% of the total population, and is forecast to increase to 39% by 2036.
Area % Black & Minority Ethnic Population
2011 2017 2021 2026 2031 2036
Kingston 25% 31% 34% 36% 37% 39%
Richmond 14% 16% 17% 17% 18% 18%
Greater
40% 43% 44% 45% 46% 47%
London
Source: GLA 2015 Round Demographic Projections, 2016, Trend-based ethnic group projections, long-term migration
Ethnicity projection of children and young people in Kingston
between 0-19
2011 2017 2021 2026 2031 2036
White
White British 22,455 21,147 20,057 19,248 18,215 17,869
White Irish 207 193 186 194 192 190
Other White 2,799 4,304 4,808 5,211 5,271 5,275
Mixed
White & Black Caribbean 706 767 809 846 853 870
White & Black African 427 467 486 498 496 505
White & Asian 1,423 1,709 1,824 1,894 1,885 1,897
Other Mixed 936 1,308 1,487 1,673 1,757 1,794
Asian
Indian 1,339 1,558 1,669 1,767 1,779 1,783
Pakistani 1,086 1,331 1,429 1,535 1,580 1,609
Bangladeshi 269 473 593 702 772 803
Chinese 489 587 635 697 721 741
Other Asian 3,822 5,118 5,712 6,247 6,434 6,505
Black
Black African 842 1,012 1,145 1,255 1,282 1,300
Black Caribbean 195 250 279 306 308 320
Other Black 133 230 270 311 334 339
Other
Arab 662 1,096 1,341 1,603 1,769 1,850
Other Ethnic Group 439 622 718 819 856 859
BAME 12,771 16,533 18,395 20,141 20,835 21,167
All Ethnicities 38,238 42,182 43,451 44,798 44,512 44,500
The next table provides the projected number of 0-19 year olds by ethnicity in Kingston. The projected
BAME population for this age group in 2017 is 16,533 or 39% of the 0-19 year old population rising to 48%
by 2036. The children and young people population in Kingston is significantly more diverse than the
older population. This trend is projected to continue for the foreseeable future.
NOTE: Numbers may not sum due to rounding. Source: GLA 2015 Round Demographic Projections, 2016, Trend-
based ethnic group projections, long-term migration scenario
23Births
Over approximately the past decade there has been a general trend of increasing numbers of births in
Kingston Borough (as shown by the blue line in the chart below). While there was a drop in 2014, it has
increased again in 2015 and 2016.
The green ‘natural change’ line in the chart shows the difference between the number of births and the
number of deaths. Natural change is consistently a positive number, thus demonstrating a rising
population as the number of births outweighs the number of deaths in the borough.
Births, Deaths and Natural Change per Year
2500
2000
1500
1000
500
0
2002 2003 2004 2005 2006 2007 2008 2009 2010 2011 2012 2013 2014 2015 2016
Live Births Deaths Natural Change
Migration
Considerable numbers of people move into and out of the borough each year, both internally from
elsewhere in the UK and internationally. The Office of National Statistics produces these figures annually
and includes them in the population estimates. In recent years net international migration has been
approximately double the natural change increase seen in the borough. This is reflected in the the
increase in the ‘White Other’ and ‘BAME’ ethnicity popoulations. There has also been a steady decline of
net internal migration since 2012.
Net Internal Net International
Natural Change Migration Migration
2016 1238 -878 2256
2015 1207 -226 2547
2014 1178 -188 2136
2013 1116 -53 1827
2012 1292 21 2138
Source: ONS Mid Year Estimates 2016, 2015, 2014, 2013, 2012
24Family, Households and Housing in Kingston
Households
The overall number of households in Kingston in 2017 is projected to be approximately 70,694. By 2036,
the number of households in the borough are projected to increase by 19% from 2017 levels. The rises
depend on considerable housing development over the next 20 years.
2017 2021 2026 2031 2036
Number of Households 70,694 73,201 76,858 80,750 84,231
% increase from 2017 - 4% 9% 14% 19%
Source: GLA 2016-based Demographic Projections, 2017, trend projections, long term migration scenario
Families and household types
At the time of the 2011 Census, there were 66,639 households in the borough of Kingston, 31% (19,684)
of which contained dependent children, and 7% (3,550) were lone parent households.16 Kingston had
proportionately fewer lone parent households than both London (9%) and England (6%).
Based on the GLA Household Projections 2016 Round LTM, the rate of households with dependent
children has increased slightly. The data estimate there are approximately 22,686 households in Kingston
with dependent children - approximately 32% of the 70,694 total estimated households in the borough.
Note that GLA does not include lone parent households in their annual household projections. As such,
the 2011 census data is the most current data available.
2011 2017
Number of Households 66,639 70,694
% households with
31% 32%
dependent children
% lone parent households 7% -
Source: 2011 Census and GLA 2016-based Demographic Projections, 2017, trend projections, long term migration
Housing tenure
Since the 2001 census there has been a significant fall in the proportion, and number, of homes in
Kingston owned with a mortgage. The 2011 census showed almost a 7 percentage point difference in the
proportion of households privately rented (21%) compared to 2001 (14%).
2001 2011
All categories: Tenure 61,426 63,639
Owned: Owned outright 17,210 28.0% 17,727 27.9%
Owned: Owned with a mortgage or loan 26,289 42.8% 23,035 36.2%
Shared ownership (part owned and part rented) 418 0.7% 434 0.7%
Social rented: Rented from council (Local Authority) 5,106 8.3% 5,252 8.3%
Social rented: Other 1,726 2.8% 2,250 3.5%
Private rented: Private landlord or letting agency 8,847 14.4% 13,391 21.0%
Private rented: Other 1,830 3.0% 921 1.4%
Living rent free no data no data 629 1.0%
16 Household composition, 2011 Census
25You can also read