Early Years (0-4 years) Needs Assessment
←
→
Page content transcription
If your browser does not render page correctly, please read the page content below
Early Years (0-4 years) Needs Assessment

                   This document contributes to
           Westminster’s Joint Strategic Needs Assessment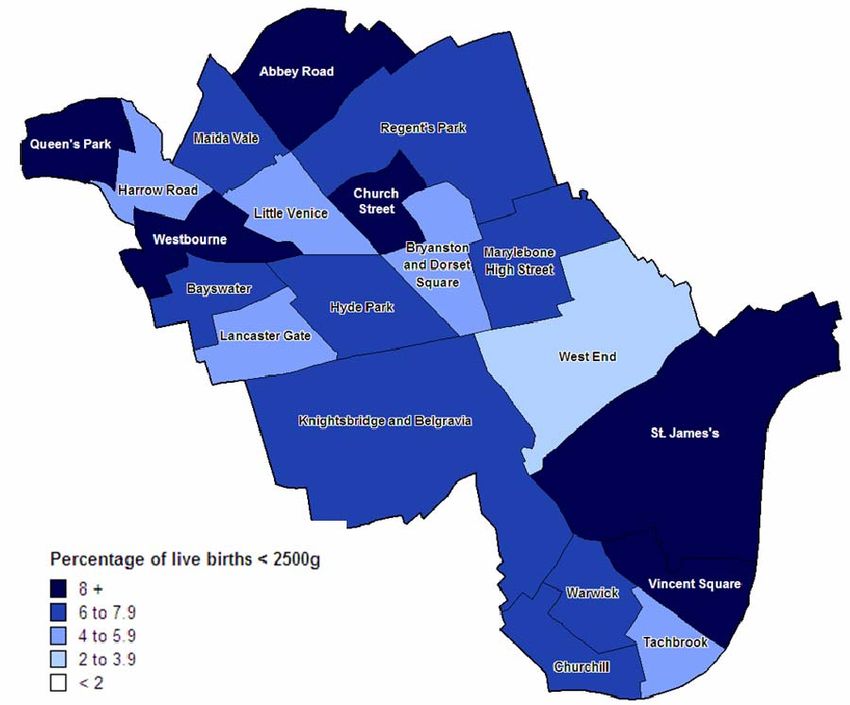
FINAL - Early Years JSNA - Public Health, NHS Westminster, December 2009

                                               Contents

Key Messages and Findings .........................................................................3

Suggestions and Recommendations ...........................................................8

1. Background and Introduction.................................................................10

1.1 The Concept of Need .............................................................................10

1.2 Which Population is this Needs Assessment About? ........................10

1.3 What Is The Issue and Why is it Important for Westminster?............10

2. Demographic Profile of Children Aged 0-4 Years and their Mothers ..12

2.1 Numbers Of Children Aged 0-4 In Westminster ..................................12

2.2 Westminster Births ................................................................................13

2.3 Diversity of Children Aged Less Than 5 Years In Westminster .........19

3. Socioeconomic Profile of the Families ..................................................21

3.1 Income Deprived Families.....................................................................21

3.2 Housing ..................................................................................................26

3.3 Lone Parents ..........................................................................................29

3.4 Children in Need ....................................................................................30

4. Health And Wellbeing of Under 5 Years Olds........................................32

4.1 Preconception and Antenatal Care ......................................................33

4.2 Postnatal Care........................................................................................36

4.3 Early Years .............................................................................................40

5. Childcare Settings and Educational Provision for 0-4 Year Olds in
Westminster .................................................................................................55

5.1 Children’s Centres .................................................................................55

5.2 Childcare Settings .................................................................................57

5.3 Educational Attainment .........................................................................65

References ...................................................................................................69

                                                                                                              2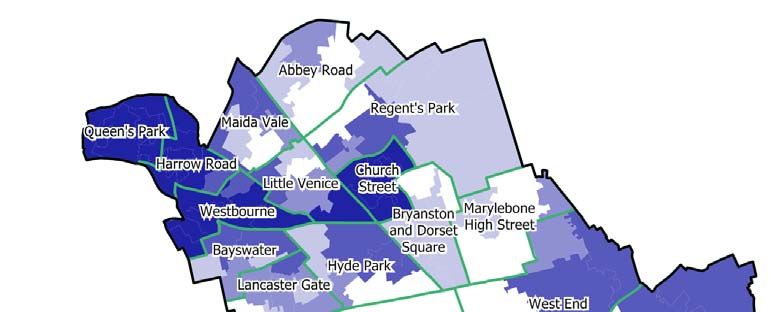
FINAL - Early Years JSNA - Public Health, NHS Westminster, December 2009

                Westminster JSNA Rolling Programme

           Early Years (0-4 age group) Needs Assessment

This needs assessment is part of a wider rolling programme of the Joint
Strategic Needs Assessment (JSNA), undertaken between Westminster City
Council and NHS Westminster. The JSNA process seeks to paint a picture of
unmet needs within the population and as such forms a vital part of the
commissioning cycle.

This needs assessment focuses on children up to their fifth birthday. The
bodies that provide, commission or monitor children’s services (i.e. NHS, local
authority or government) record this age group differently. Local, regional and
national data use the terms up to 5 years, under 5 years, 0-4 years and 0-5
years for this population. This document therefore uses these terms
interchangeably for this population.

                     Key Messages and Findings
Demography and deprivation
   •   Patterns of deprivation and income deprivation in Westminster map
       closely to areas with the highest proportion of children aged up to 5
       years. Nearly one in three children lives in one of the four most
       deprived wards in the Borough.

   •   The number of births per year in Westminster is not predicted to
       increase significantly (2%/year) in the next decade.

   •   Just over a half of the under 5’s are from BME groups. As a result, the
       ethnic profile of children aged 0-4 in the Borough is currently more
       diverse than in the population as a whole. It is likely that the biggest
       increase in terms of births will happen among the BME groups.

   •   Currently some 34.6% children live in households dependent on
       workless benefits in Westminster, compared with 19.7% in England
       (DWP, April 2007). The lowest proportion of lone parent households
       was found in the Bayswater ward (41%), whilst the highest was in the
       Harrow Road ward (64%). (ONS, 2001 Census)

   •   35% of children and young people attending primary and secondary
       schools in Westminster are eligible for free school meals. This
       proportion is much higher than that of London, or England, as a whole.

   •   45% of houses occupied with dependent children are overcrowded in
       Westminster. The lowest quality housing as measured by the Child
       wellbeing index is in Marylebone High Street Ward.

                                                                             3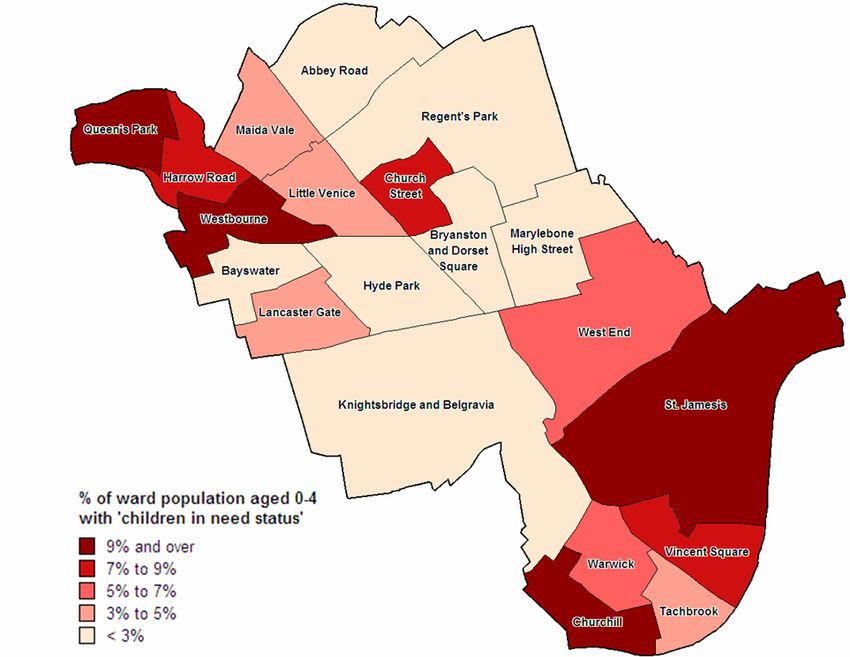
FINAL - Early Years JSNA - Public Health, NHS Westminster, December 2009

    •   As at 31 March 2009 there were 34 children aged below 5 years
        temporarily placed in Bed and Breakfast accommodation in
        Westminster, while waiting for allocation of a suitable self-contained
        property.

Maternal health
    •   72% of live births in Westminster in 2007 were to mothers born outside
        the UK. This is much higher than in London (54%) and England (24%).
        Child’s ethnic status is currently not recorded at birth registration.

    •   The wards with the lowest birth weights are characterised by ethnic
        groups whose babies may be smaller naturally but adverse factors
        associated with lower socioeconomic status characteristic for these
        wards, play a significant role in further lowering birth weight.

    •   In 2008/9 only 77% of the women who had a health and social care
        assessment in Westminster had it by 12 weeks and six days of
        pregnancy.

    •   Between April 2008 and March 2009, of all pregnant women booked at
        St Mary’s with Body Mass Index (BMI) recorded, 30.4% were
        overweight and 13.5% were obese.1

    •   Although the numbers of actual teenage pregnancies is not very high
        the proportion of Westminster’s teenage conceptions resulting in a
        termination is high and increasing (60% in 2006 and 74% in 2007).

    •   The gap in teenage pregnancy rates between the most and least
        deprived areas of Westminster is of a particular concern. A new target
        introduced in the recent Westminster’s inequality strategy reflects this
        issue.

    •   On the whole the age of mothers giving birth in Westminster is higher
        than the age of mothers in London and England.

    •   Local audit of postnatal depression carried out in Church Street in 2004
        found that 33% of first time mothers assessed were found to have
        postnatal depression. This is more than double of the highest national
        estimate.

    •   The prevalence of breastfeeding at 6-8 weeks was 79% in the first
        quarter of 2009/10. This exceeds the nationally set local target for
        Westminster.

1
 Overweight includes women with BMI greater or equal to 25kg/m3 and less than 30kg/m3;
obese patients classed as those with BMI of greater or equal to 30 kg/m3.

                                                                                         4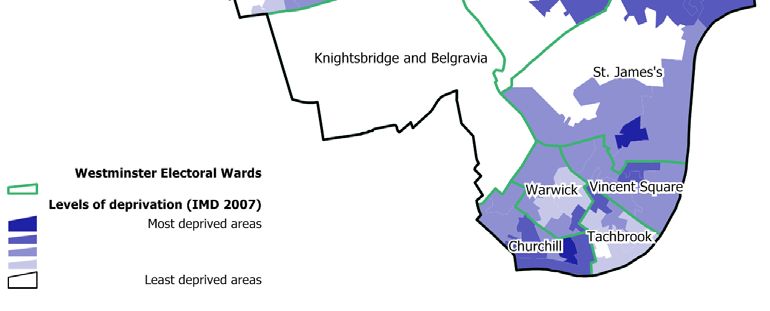
FINAL - Early Years JSNA - Public Health, NHS Westminster, December 2009

Children’s health
   •   99% of children aged less than 5 years in Westminster appear to be
       registered with a GP

   •   The percentage of NHS hearing screens complete by both 4 weeks
       and 3 months after birth was lower in Westminster than London and
       England in 2008/9. However a higher than average proportion of
       babies (15%) in Westminster are born in private hospitals and are
       tested privately.

   •   Where immunisation uptake is still low, this is due in part to access;
       problems with data recording, staffing and ensuring parents are
       appropriately reminded.

   •   There is little data locally and nationally to show the burden of illness
       when it comes to mental health in the 0-5 year old population.

   •   In 2007/08 a greater proportion of children in reception were obese
       compared to both London and England. Westminster school children
       have a significantly higher rate of dental decay than the average for
       London and England. The majority does not access treatment. This is
       mainly due to cultural tradition and service access difficulty.

   •   All children aged under 16 are entitled to free eye checks on the NHS.
       In the LA maintained schools in Westminster, all children in Reception
       classes undergoing the health check, have their vision screened by a
       trained school nurse.

   •   Respiratory disease was the most common reason for emergency
       admission (26%) in 0-5 year olds in 2005-07 in Westminster.
       Proportionately more children from BME groups are attending hospital
       for elective admissions.

   •   E-Start data from 2008/9 shows that across the 12 Children’s Centres
       6,777 children and 6929 parents/carers accessed the different
       activities/ services offered, calculated by activity (most individuals who
       attend will attend more than one activity).

Childcare and education

   •   Locally, there are currently childcare places for around 39% (full-time)
       or 60% (part time) of the population. (calculation based on ONS mid-
       year estimates 2007)

   •   Of the 113 childcare providers within Westminster for whom there is
       relevant data only 70 (62%) provide for children aged 0-3 as well as 3-
       4 years.

                                                                               5
FINAL - Early Years JSNA - Public Health, NHS Westminster, December 2009
• All childcare settings have a statutory requirement to encourage and
promote healthy lifestyles and diet. This is assessed alongside other
requirements included in the EYFS guidance using a structured
questionnaire at an annual visit by the LA of all childcare settings for 0-
5 year olds. These visits may result in a plan of improvement being
drawn up in partnership with the settings. At present, dietetic and
public health advice is not sought on the healthy lifestyle element of
any plan of improvement. It is also not currently possible to do detailed
analysis of the data obtained from the questionnaire.
• Results of the Westminster 2007-8 Childcare Sufficiency Assessment
shows that more than half of the childcare settings are unable to meet
demand for children aged 0-2 years and over 1/3 were not able to meet
the demand for 2-3 year olds. The ratio of Ofsted Registered 0-4
childcare places to population aged 0-4 varies from 1:1.3 in Tachbrook
to 1:8.8 in Marylebone High Street. There is possible under-
representation of Asian children using registered group settings.
• In 2009, 65.7% of children at the end of Reception year at
Westminster’s state primary schools had achieved the expected
minimum level of the EYFSP (a score of 78 points or more across all
areas of learning); an increase of eight percentage points from the
previous year. A noticeable pattern exists reflecting that of deprivation.
Children in more deprived areas achieve lower scores in particular in
relation to reading, writing and calculation.
• Childcare in Westminster can be prohibitively expensive for parents in
low to intermediate paid jobs. More affordable voluntary sector
childcare is available in Westminster but these settings often do not
provide care for the full working day. This lack of suitable and
affordable childcare can represent a barrier to employment and
successful outcomes for children.
Significant gaps in information/services provision
• Information and services for women during pre-conception and in the
early stages in pregnancy are underutilised. This is partly due to lack of
signposting and access delays but culture, population diversity and
other factors are also likely to play a significant role.
• More deprived wards have a greater proportion of children growing up
in families dependent on workless benefits, children in need and
children on the child protection register. Deprivation is also linked to
higher levels of tooth decay, lower birth weight, higher levels of
maternal smoking, greater levels of post-natal depression and obesity,
although this had not been investigated in detail locally as yet.
• The size of the gap between the most deprived and the least deprived
wards in the Borough in terms of e.g. life expectancy at birth and
6FINAL - Early Years JSNA - Public Health, NHS Westminster, December 2009
conception rates is large. Not all the gaps are known and knowledge of
gaps does not always mean services are targeted to these areas.
• Current data collection by e.g. Children Centres does not show if the
population targeted is the one which actually utilises the service/s.
Children’s Centre’s have identified this problem and are currently
developing systems which when rolled out will fill this gap.
• There is a lack of knowledge and data on the private schools
population. The health and well being status of children attending
private schools and their need for health and/or social services
interventions is unknown.
• Information on the quality of nutrition and physical activity in early
childcare settings is lacking as is the information on service provision in
these areas. This does not allow for identification of the unmet
nutritional and physical activity needs of this population.
• Information on accidents and harm to children is not easily available
due mainly to lack of systematic monitoring caused by lack of targeted
outcomes.
7FINAL - Early Years JSNA - Public Health, NHS Westminster, December 2009
Suggestions and Recommendations
This section identifies gaps in information particularly in areas where there
may be outcome deficiencies.
1. It is necessary to ensure that current local preconception and antenatal
service provision is adequately signposted by all health and social care
professionals working with mothers and young children. Also, that
parents/carers are aware of the important stages and aspects of antenatal,
postnatal and early years care, such as:
• Antenatal screening
• Smoking during pregnancy and after
• Breastfeeding and weaning
• Postnatal depression service
• Oral hygiene of both mother and child
• Vision checks
• Hearing checks
• Speech and language development
• Diet and nutrition
• Immunisations
• Safety in the home
2. Some of this provision might need to be revised, tailored to different age or
cultural groups, offered in different languages, to mothers having
first/subsequent child, different stages of gestation and different
geographical areas etc.
3. It is also important that workers in childcare settings are aware of possible
signs of neglect, trauma, abuse and mental health problems among the
children they see and that they know where to report, sign-post or refer
such children as per documented pathways.
4. It is important to further explore how the barriers preventing parents
getting back to work can be reduced e.g. around childcare provision; and
how working parents can be supported to access services for their children
e.g. immunisation clinics at GP practices outside working hours.
5. More detailed data and analysis is needed to support effective service
provision. Data collection and measurements fulfilling the target monitoring
requirements do not always provide the detail needed to target services.
For instance it is not known how many mothers continue smoking or start
smoking again after birth. It is known what percentage of mothers start
breastfeeding and are still breastfeeding at 6-8 weeks but it is not known
what socioeconomic background these mothers come from.
6. Monitoring uptake in terms of detailed population profiling is paramount to
understanding how services work and if targeting was effective. For
example free school meal eligibility and uptake numbers exist but not
detailed information on who is actually utilising the service. A similar
8FINAL - Early Years JSNA - Public Health, NHS Westminster, December 2009
situation applies to physical activity uptake and provision where little
information exists on profiling the population of attendees and non
attendees.
7. Gaining more detailed insight into the quality of food provided in early
years care settings and/or what food is eaten at home is necessary prior to
developing an educational programme promoting healthy eating and
physical activity in early years childcare settings.
8. Local stakeholders should discuss, consider and agree how to address the
inequality of provision for health and social care between the state and
privately run early educational settings in the Borough.
9. Further consideration should be given to the issue and importance of harm
in children and mothers in terms of both accidental and deliberate harm.
Targeted work is currently taking place within the Borough around Hidden
Harm. This includes improving data recording around parental status of
individuals in treatment for drug and alcohol misuse, monitoring local
services and the work they are doing with parents and referrals made to
Children’s Services. The outcomes of this work should be reviewed and
any recommendations considered.
10. Follow up and utilise the results of initiated projects and programmes and
their evaluation e.g.
• A pilot project on oral health in Lisson Grove,
• Monitoring of access, uptake and awareness raising of childhood
immunisations, and joined-up working in this area
• Ensuring a robust referral process is in place for following up babies
whose hearing is not screened before they leave the maternity ward
to eliminate future disadvantage in learning
• Revision of screening provision for ocular anomalies in 4-5 year olds
• The family recovery project
• The Child Poverty programme projects
• Healthy schools/Extended schools programme
9FINAL - Early Years JSNA - Public Health, NHS Westminster, December 2009
1. Background and Introduction
1.1 The concept of need
Need as defined here implies “capacity to benefit” from an intervention. Such
interventions might include the provision of information, education, assistance
and protection, symptom control, treatment or cure, resulting in
empowerment, independence, self management of conditions and improved
health and wellbeing. Complex needs require complex solutions which are
best identified and remedied through constructive multiagency working.
1.2 Which population is this needs assessment about?
This particular needs assessment relates to children aged 0-4 years (up to the
child’s fifth birthday). Birth to five are considered key developmental years
during which family and early childcare settings determine many of a child’s
health and wellbeing habits and foundations. Parental and in particular
maternal characteristics and behaviour during preconception, the antenatal
period and post birth play key roles in the child’s development alongside the
general wider determinants of health such as family income (or the lack of it),
access to health care interventions such as immunisations and access to
early education.
This needs assessment aims to bring together the following information to
paint a picture of Westminster’s children in their early years with a focus on
those who live in the most deprived areas and impoverished households.
This includes:
• Demographic profile of the children and their mothers;
• Socioeconomic profile of the families;
• The health and social services to which they have access;
• Who accesses the services and to what effect
1.3 What is the issue and why is it important for Westminster?
Exposure to certain factors such as poverty, unbalanced diet, illness and un-
stimulating or threatening home environments are all likely to have a
detrimental effect on children’s cognitive, motor and socio-emotional
development as well as on their health. These can prevent children from
reaching their full developmental potential. In particular, children growing up
under these circumstances are likely to have poorer health, lower school
achievement and lower earning potential. As adults, they are less likely to
provide adequate stimulation and resources for their own children, thus
contributing to the intergenerational transmission of poverty and economic
inequality.
Westminster has some of the most deprived as well as the least deprived
wards in the country. Patterns of deprivation and income deprivation in
Westminster map closely to areas with the highest proportion of children aged
up to 5 years. Nearly one in three children lives in one of the four most
10FINAL - Early Years JSNA - Public Health, NHS Westminster, December 2009
deprived wards in the Borough (Church Street, Westbourne, Harrow Road
and Queen’s Park). Anecdotal evidence suggests that obesity and
overweight follows the same pattern, although this has not been investigated
locally yet.
Figure 1: Patterns of deprivation across Westminster Wards – Index of
Multiple Deprivation, 2007
© NHS Westminster Public Health Intelligence
Local Area Renewal Partnerships (LARPs) have been set up in five of the
most deprived parts of Westminster.
• Church Street ward
• Queen’s Park ward
• Harrow Road ward
• Westbourne ward
• South Westminster (serving Churchill, Tachbrook, Warwick, Vincent
Square and St James wards).
The LARPs bring together partner agencies such as NHS Westminster, the
Council, the Police and the community and voluntary sector, as well as local
businesses, in order to form regeneration partnerships in areas with a high
concentration of social housing, higher rates of crime and a greater number of
vulnerable people. Some of their key objectives are to tackle deprivation and
inequalities in these areas, for example through improving housing, reducing
crime and providing targeted support to children and families.
11FINAL - Early Years JSNA - Public Health, NHS Westminster, December 2009
The Westminster City Plan includes a number of Local Area Agreements
(LAA) for Westminster (2008-11) to help improve some of the issues which in
particular impact on the health status of those living in the more deprived
communities in the Borough. These include LAA 4 to tackle anti-social
behaviour, LAA 8 to meet the housing need and LAA 9 to encourage children
and families to have a healthy lifestyle.
2. Demographic profile of children aged 0-4 years and their
mothers
2.1 Numbers of children aged 0-4 in Westminster
Estimates based on the 2001 Census data suggest that in 2007 there were
some 11,800 children aged 0-4 years in Westminster. This represents a
relatively small proportion of Westminster’s population as a whole (5%)
(similar to London (7%) and England (6%)).
Figure 2: Westminster population aged 0-4 years (2007)
% Westminster population
Age 0-1 Age 1-4 Age 0-4 total
age 0-4
Males 1,400 4,500 5,900 5.0%
Females 1,400 4,500 5,900 5.0%
Persons 2,800 9,000 11,800 5.0%
Source – Mid-year population estimate for 2007 – Office for National Statistics
Children aged under 5 years make up different proportions of the overall
population in different parts of Westminster with a larger proportion of children
concentrated in the North of the Borough and in areas of highest deprivation
such as Queen’s Park (10%), Church Street (8%), Westbourne (8%) and
Harrow Road (8%).
12FINAL - Early Years JSNA - Public Health, NHS Westminster, December 2009
Figure 3: The percentage of total ward populations aged under 5 years
(2009)
10%
Percentage of ward population
9%
8%
7%
6%
5%
4%
3%
2%
1%
0%
a
ad
k
t S ill
Be rk
t
rk
ad
le
e
W te
e
d Tac ck
et
te rk
r
rro ne
e
's
d
W r ee
Ba avi
eb r se r oo
te
Hy ua r
Hi uar
e n ch
ic
S t t En
ge Va
es
a
ur Pa
a
a
W Stre
Ab Ro
Ro
i
Ha our
wa
rw
a n 's P
n
rG
nc e P
r
St
nc h ur
hb
am
Ve
lg
q
q
Ch n's
Re da
a
w
es
ys
on t S
tb
y
d
gh
ch
nt
C
be
.J
ai
es
e
e
as
ttl
ue
M
d
Li
o
e
Q
D
La
Vi
ge
an
rid
Ward
yl
sb
n
ar
to
ht
M
ns
ig
Kn
ya
Br
Source: Greater London Authority RND 2008 Ward Population Projections PLP Low2 - for
2009
The Greater London Authority (GLA) projects that the population of under 5
year olds in Westminster will stabilise over the next twenty years (at around
12,200). The GLA 0-4 2008 projections for 2010 and 2011 are 12,096 and
12,192 respectively. By contrast the Office for National Statistics (ONS)
predicts that the 0-4 population will increase to around 17,200 by 2030.
Although both data sets take into account births, deaths and migration, the
GLA predictions also take into account available housing stock and are
generally thought to be more realistic in terms of predictions. Westminster’s
under five population is not projected to increase at the rate of most other
inner London Boroughs.
2.2 Westminster births
In 2007 there were 2929 live births to women living in Westminster. The
numbers of children born each year have increased over the last five years
(from 2554 live births in 2002). There are significantly fewer births per
resident as well as per woman of childbearing age (15-44 years) in
Westminster compared with London and England. The number of births per
year in Westminster is not predicted to increase significantly, and the rate of
increase is predicted to be lower than that for Inner London as a whole (2%
2
GLA population predictions are generally believed to be more accurate since as well as
taking into account births, deaths, international and internal migration they taken into account
the available housing stock. The Post London Plan (PLP) Low is driven by the increase in
homes as seen annually since mid-2001 from data collected at Borough level up to 2007 and
the 2004 London Housing Capacity Study.
13FINAL - Early Years JSNA - Public Health, NHS Westminster, December 2009
increase compared to 4% for Inner London between 2008/9 to 2020/1) (GLA
predictions of births by age and ethnicity of mother, London Health
Observatory).
Figure 4: Number of live births to women living in Westminster by year
3000
2500
Number of live births
2000
1500
1000
500
0
2002 2003 2004 2005 2006 2007
Year
Source: Annual Birth Data Extracts, Office for National Statistics (ONS) Vital Statistics
General Fertility Rates3 vary across Westminster and over time. In recent
years, Queen’s Park ward has had the highest general fertility rates; whereas
the lowest rates have been in Tachbrook ward.
Figure 5: Birth rates by ward in Westminster, 2005-2007
2005 2006 2007
Births per 1000 female population aged 15-44
90
80
70
60
50
40
30
20
10
0
W le
t
er
d
e
rk
et
e
rk
ll
a
ch s
rk
be ad
k
re
yd te
k
Be nd
Ba rne
en ree
hi
'
oo
ic
oa
ar
hu enic
vi
es
Va
re
Pa
Pa
Pa
a
at
ua
o
E
rc
w
ra
rG
qu
ou
br
R
R
St
w
St
am
ar
Sq
hu
st
lg
da
e
's
's
V
ys
tS
tb
y
w
te
ge We
h
h
en
nt
.J
C
e
ai
ro
es
ig
rc
t
Ta
as
se
ge
ttl
H
ue
M
St
H
Ab
ar
d
W
Li
nc
or
nc
e
an
H
Q
e
C
R
La
D
on
Vi
d
eb
an
rid
yl
sb
n
ar
to
M
ht
ns
Electoral Ward
ig
ya
Kn
Br
Source: ONS, Public Health Birth Files
3
General Fertility Rate = the number of live births per 1,000 women of childbearing age (15-
44 years old).
14FINAL - Early Years JSNA - Public Health, NHS Westminster, December 2009
The age profile of mothers giving birth in Westminster in 2007 was older
than the age profile of mothers in London and England. In 2007 only 2% (61
births) of mothers giving birth were less than 20 years of age compared to 4%
in London and 6% in England as a whole. 33% of mothers were aged 35 or
over, compared to 24% in London and 20% in England (ONS, Vital Statistics,
2007).
Figure 6: Ages of mothers in Westminster giving birth in 2007
Westminster London England
35%
30%
Percentage of maternities
25%
20%
15%
10%
5%
0%
Under 20 20-24 25-29 30-34 35-39 40-44 45+
Age group
Source: ONS Vital Statistics 2007
Socio-economic status, job opportunities, access to further education and
training in employment all have an influence on the age at which women have
children. Westminster has the third highest proportion of people with a degree
or higher level of education of all local authorities in England and Wales
(ONS, 2001 Census). These figures illustrate Westminster as an area of
extremes of wealth and poverty.
Teenage motherhood is associated with worse social and health outcomes
for both mother and child. Children born to teenage mothers (measured in
girls aged 15-17) have 60% higher rates of infant mortality and are at
increased risk of having babies with low birth weight. Teenage motherhood
impacts on maternal prospects of continuing education, which in turn reduces
the social and economic opportunities for both the mother and her child.
Children of teenage parents are more likely to become teenage parents
themselves perpetuating the cycle of social, material and health disadvantage
in the family.
Reducing the rate of teenage conceptions in England remains a high
government priority. Locally, the conception rates in girls aged 15-17 have
shown a decline since 2000. However the 2006 data indicated a reverse
trend, although Westminster still had lower rates than in London and England
as a whole. The proportion of Westminster’s teenage conceptions resulting in
15FINAL - Early Years JSNA - Public Health, NHS Westminster, December 2009
a termination is persistently high and increasing (74% in 2007 compared with
63% in London and 51% in England and 60% in 2006 locally).
Figure 7: Trends in teenage conception rates (15-17 year olds) 1998 –
2007
Westminster London England
60
50
Rate per 1,000 Females aged 15-17
40
30
20
10
0
1998 1999 2000 2001 2002 2003 2004 2005 2006 2007
Year
Source: Teenage Pregnancy Unit
16FINAL - Early Years JSNA - Public Health, NHS Westminster, December 2009
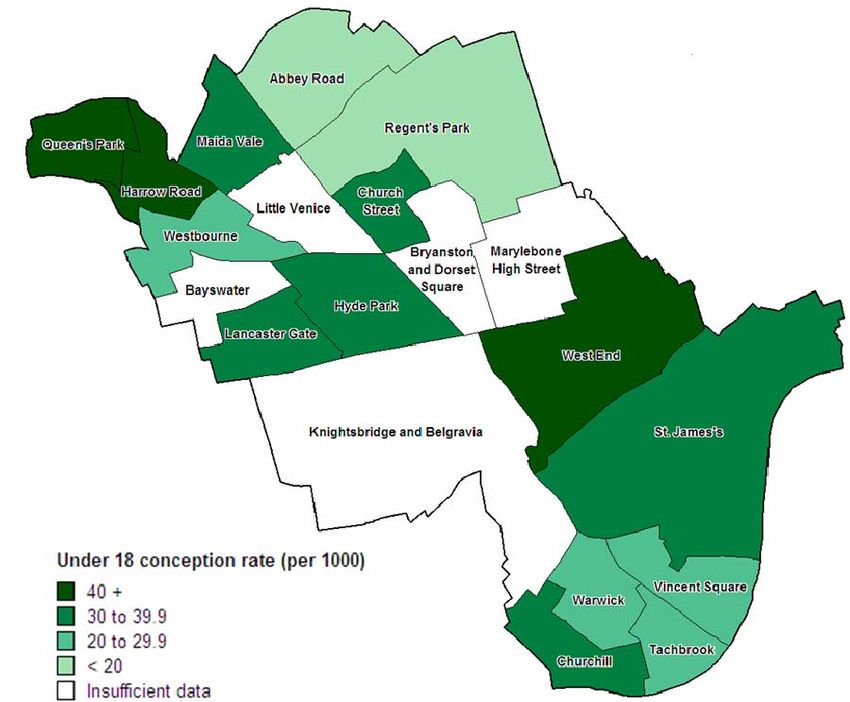
Figure 8: Teenage conception rates per 1,000 by ward, Westminster –
2004-064
© NHS Westminster Public Health Intelligence
Source: Teenage Pregnancy Unit, Office for National Statistics
The most recent data on conceptions in girls aged 15-17 has shown that there
were 70 conceptions in 2007. These are relatively small numbers subject to
considerable fluctuation between years as is apparent from the sudden surge
in 2006 followed by a fall in 2007.
Although overall the conception rate in Westminster is lower than the national
average, some wards have higher than national rates. The three wards with
the highest rates of teenage pregnancy over the years 2004-6 were Queen’s
Park (57.3), Harrow Road (53.3) and West End (45.5), which all had higher
rates that the national figure of 41.2 per 1000 15-17 year old girls. Queen’s
Park and Harrow Road are two of the most deprived wards in Westminster.
The gap in teenage pregnancy rates between the most and least deprived
areas of Westminster is of a particular concern. The current gap (2004/06) is
39.86 per 1000 between the most deprived and the least deprived quintiles. A
new target to reduce the gap in the teenage conception rate between the
most deprived and the least deprived quintiles by 30% was introduced in the
4
Due to small numbers the ward level data has been aggregated over a three year period.
To prevent disclosure and protect confidentiality ONS suppresses data for wards with fewer
than five conceptions. These are the wards coded on the map in figure 8 as having
‘insufficient data.’
17FINAL - Early Years JSNA - Public Health, NHS Westminster, December 2009 Westminster Inequalities Strategy (2009). If the target is achieved, by 2013- 15, the teenage conception rate in the least deprived quintile would be 6 per 1000 and the most deprived quintile would be 33.9 per 1000. Birth weight is an important indicator of foetal age and normal growth. Low birth weight (
FINAL - Early Years JSNA - Public Health, NHS Westminster, December 2009

Over the time period 2004-2006, a significantly higher percentage of babies
born to mothers living in the Church Street ward (9.6%) had a low birth
weight. Other wards with high percentages include Westbourne (8.9%)
Abbey Road (8.7%), Vincent Square (8.6%), St James’s (8.5%) and Queen’s
Park (8.4%).

The wards with the lowest birth weights are characterised by higher
proportions of Asian residents whose babies may be smaller naturally.
However, it is the addition of adverse factors associated with lower
socioeconomic status characteristic for these wards, such as maternal
nutrition and smoking, which play a role in further lowering birth weight in
these babies putting them more at risk of adverse outcomes.

In 2007 84% of Westminster babies were born in NHS hospitals and 15% in
non-NHS hospitals. The remaining 1% of mothers gave birth at home. The
percentage of mothers giving birth in NHS hospitals is lower than in London
(96%) and England (97%) mainly due to the proportion of mothers giving birth
in non-NHS hospitals. This reflects the pockets of affluence in the Borough.
Only 1% of mothers gave birth at home compared to London (2.2%) and
England (2.8%) in 2007.

Utilisation of private hospitals for birth increases with age and affluence, rising
from 8% in Westminster in the under 30 year olds to 18% in the 30-39 year
olds and 19% in the over 40 year olds. NHS Westminster has less control
over the delivery of health promotion interventions and monitoring of early
years screening coverage in private hospitals.

2.3 Diversity of children aged less than 5 years in Westminster

Child’s ethnic status is currently not recorded at birth registration.
According to the Greater London Authority (GLA) estimates just over a half of
the under 5’s are from BME groups. This suggests more diversity within this
population subgroup than within Westminster as a whole, where 71% are
estimated to be White and 29% from BME groups. The high percentage of
children of an ‘Other’ ethnic group indicates children whose ethnicity is
unknown and is likely to encompass individuals with a range of spoken
languages and cultures that need to be considered in service provision.

The 2001 Census returns for Westminster showed that within the broad
category of ‘Other ethnic group’, over half (54%) of individuals of all ages
were self-reported to be of a North African or Middle Eastern ethnicity (also
including categories of Arab, Israeli, Iranian, Kurdish and Moroccan) (Ethnic
write-in (80 categories) by religion (9 categories), 2001 Census). This level of
breakdown has not been provided to this level for more recent population
estimates.

Enhanced recording of individual’s ethnicity remains one of the priorities for
the NHS, education and social services.

                                                                                19
FINAL - Early Years JSNA - Public Health, NHS Westminster, December 2009
Figure 10: The ethnic profile of the population aged under 5 years in
Westminster
Other -
16%
Chinese -
3%
Asian Other -
7%
White -
49%
Bangladeshi -
6%
Pakistani -
2%
Indian -
5%
Black Other -
5%
Black African - Black Caribbean -
5% 2%
Source - GLA 2007 Round Ethnic Group Projections - PLP Low – for 2008
According to the GLA predictions, the greatest increase in numbers of
children aged under 5 years over the next 10 years among BME groups is
expected to come in the ‘Other’ ethnic group. Based on the 2001 Census
data it indicates that over half of this group may consist of individuals who
self-reported to be of a North African or Middle Eastern ethnicity.
Services must take into account not only the number of children born but also
the make up of the ethnic groups to reflect the need for services now and in
the future. This is not only relevant for Children’s Services but also services
which provide parental education and care.
Maternal country of birth is collected at birth registration and, although not a
measure of ethnicity, provides an indication of a child’s ethnicity. According to
the Office for National Statistics 72% of live births in Westminster in 2007
were to mothers born outside the UK. This is much higher than in London
(54%) and England (24%). This proportion has been increasing since 2001.
Of those mothers born outside the UK 34 % were born in Asia, 18 % in Africa
and 3% in the new European Union Countries (joining the EU since 2004)
(ONS, 2007).
Information on maternal country of birth is important for commissioning and
the provision of maternal and child services, given the cultural, language and
service provision differences between countries worldwide.
In 2007 69% of Westminster primary school children spoke English as a
second language. Unsurprisingly this is a similar proportion to the
percentage of live births to mothers born outside the UK in 2007. It is
20FINAL - Early Years JSNA - Public Health, NHS Westminster, December 2009
plausible that most mothers whose children will go on to attend state primary
schools remain in Westminster after giving birth.
English as a second language can present additional barriers in a child’s
education and their family’s access to, and acceptance of, services. Apart
from English, Arabic, Bengali/Sylheti, Albanian and Portuguese are the most
frequent first languages spoken in Westminster schools. (WCC, 2007 School
Census)
3. Socioeconomic profile of the families
3.1 Income deprived families
Living in an income deprived family as a child is associated with worse health
outcomes, both during childhood and in future life. Deprivation is linked to
other wider determinants of health such as educational attainment. It can also
influence behavioural choices known to impact on the health of adults and
their children such as breastfeeding, eating habits and participation in sports
and exercise.
Westminster has some of the poorest children in the country. As part of the
Indices of Deprivation (IMD) 2007, a sub-indicator was specifically designed
to capture income deprivation affecting children. This is defined as the
proportion of children under 16 living in families that are income deprived (in
receipt of Income Support, Income based Job Seeker’s Allowance, Working
Families’ Tax Credit or Disabled Person’s Tax Credit below a given
threshold).
Westminster is divided into Super Output Areas (SOA)5 which enable a closer
inspection of amongst other things the socioeconomic profile of specific parts
of the Borough. Westminster is made up of 120 SOAs. 42 (35%) of
Westminster SOAs are in the 20% most deprived SOAs in the country. This
includes all of the SOAs in the electoral wards of Church Street, Harrow
Road, Queens Park and Westbourne. In 29 (24%) of the Westminster SOAs
more than 50% of children live in income deprived families. In 4 of
Westminster’s SOAs 90% of children live in income deprived families while
one SOA in the Queens Park ward has the highest proportion of children
living in income-deprived families in the country at 100% (out of 32,482 SOAs)
and in one SOA in Church Street, 99% of children live in income deprived
families.
5
Super Output Areas (SOAs) are units designed for the collection and publication of small
area statistics. SOAs are the building blocks for large groups of SOAs called Lower SOA,
Middle SOA and Upper SOA. The SOAs are based on even population numbers (mean total
population of an MSOA being 7,200) rather than geographic area.
21FINAL - Early Years JSNA - Public Health, NHS Westminster, December 2009
Figure 11: Income Deprivation Affecting Children, Indices of Deprivation
2007 – national quintiles of Super Output Areas
Income Deprivation Affecting Children
National quintiles of super output areas
1 - Most deprived
2
3
4
5 - Least deprived
Source: Department of Communities and Local Government (CLG)
The adverse impact of unemployment on physical and mental health and
wellbeing of the family and its individual members in terms of, for example,
higher risk of depression and increased morbidity is well documented. Such
impact on parental health combined with financial hardship impacts inevitably
on the wellbeing of children.
Her Majesty’s Revenue and Customs (HMRC) data from 2006 indicates that
the proportion of children in low income families in receipt of workless benefits
in Westminster (38%) is higher than the average for central London (30%)
and nationally (20%). Workless Benefits include Income Support, Job
Seekers Allowance, Incapacity Benefit, Severe Disability Allowance and
Pension Credit. A further 14% of children in Westminster live in families
where a parent works, but they are also in receipt of working tax credit and
child tax credit.
The Department for Work and Pensions (DWP) figures for April 2007, suggest
that around 9940 (34.6%) children live in households dependent on workless
benefits in Westminster, compared with 19.7% in England. Westminster City
Council estimates from 2007 suggest that there are just under 10,000
individual parents out of work resident in the Borough.
DWP data suggests that the numbers of children living in workless families fell
in Westminster between 2003 and 2007; the fall was smaller than that seen
across central London and nationally. Due to the current economic climate,
however, it is likely that these figures will increase again over the next few
years.
22FINAL - Early Years JSNA - Public Health, NHS Westminster, December 2009
To help counteract this trend, Westminster City Council is piloting two projects
aimed at unemployed parents under the Westminster Works Programme.
The Child Poverty Innovation project as a part of a neighbourhood based
employment support service works in partnership with the Voluntary and
Community Sector, local schools and Children Centres, Job Plus services
including the Paddington Development Trust and Vital Regeneration
innitiatives. It aims to target long term unemployed and economically inactive
residents who are parents focussing on areas with the highest concentration
of unemployment including Queen's Park, Harrow Road, Westbourne and
Church Street.
The aims of the pilot are threefold:
To increase parental employment.
To raise family income, including through the improved take up of tax
credits and benefit, including local authority administered benefits.
To promote economic regeneration focused on families and tackling
deprivation at a community wide level.
Through addressing the employment of parents, it is envisaged that the
number of children living in poverty will be reduced in Westminster.
Figure 12: Indications of child poverty in Westminster LARPs
Proportion of % children aged 0-
Estimated
LSOAs within No. of housing 4 living in
no. of
top 5% most benefit claimants households
LARP area parents out
deprived with children dependent on
of work (Nov c
nationally b (Nov 2008) workless benefits
a 2008)
(2007) (2006) d
Queen’s
5 out of 6 1465 862 47.3%
Park
Harrow
4 out of 6 1012 611 45.6%
Road
Westbourne 6 out of 7 1461 899 49.7%
Church
3 out of 4 1326 857 48.8%
Street
South Area* none 2217 1124 23.0%
(These indicators apply to 0-15 year olds, except those dependent on workless
benefits, which relate to children aged 0-4)
a
– Index of Multiple Deprivation affecting children, 2007 – children all ages
b
– Strategy, Planning and Performance, Westminster City Council, November 2008 – parents
of children of all ages
c
– Westminster Housing Benefits Database, November 2008 – children of all ages
d
– Department for Work and Pensions, April 2006 – children aged 0-4
* - The South Area covers Churchill, Tachbrook, Warwick, Vincent Square and St James’s
Wards – the data for these wards varies, for instance the proportion of children aged 0-4
dependent on workless benefits in Churchill ward was 49.3%, much higher than the other
wards in this LARP.
Source: Children Poverty Local Authority Innovation Pilot Bid, November 2008; data from the
Early Years Census 2009, Westminster City Council.
23FINAL - Early Years JSNA - Public Health, NHS Westminster, December 2009
The wards with a higher proportion of children who live in families dependent
on workless benefits correspond to the areas of highest deprivation. As figure
12 above shows, nearly half of the population aged under 5 years in the four
Local Area Renewal Partnership (LARP) areas in the north of the Borough are
dependent on workless benefits. This is also the case for Churchill Ward
within the South LARP area.
At a local level eligibility for free school meals, especially in primary
schools, where the majority of the school roll live in Westminster, can be used
as an indicator of poverty.
Parents do not have to pay for school lunches if they receive any of the
following:
• Income support
• Income-based jobseeker's allowance
• Support under Part VI of the Immigration and Asylum Act 1999
• Child Tax Credit, provided they are not entitled to Working Tax Credit
and have an annual income (as assessed by HM Revenue & Customs)
that does not exceed £14,495
• The guaranteed element of State Pension Credit
35% of children and young people attending primary and secondary schools
in Westminster are eligible for free school meals. This proportion is much
higher than that of London, or England, as a whole.
Figure 13: Eligibility for free school meals, 2007/8
% Children eligible for free school meals in 2007/8
Maintained Nurseries and Primary Schools
Westminster 35%
London 24%
England 16%
Source: Westminster City Council 2007; Department for Children Schools and Families
(DCSF): Pupil characteristics and class sizes in maintained schools in England: January 2008
Provisional data (for London and England)
Data collected as part of the School Census shows that in January 2009 17%
of pupils at maintained nurseries and 37% of primary school pupils were
eligible for free school meals in Westminster. In primary schools this ranged
from 2% to 56% of pupils being eligible. In 10 primary schools more than
50% of children were eligible for free school meals. A higher percentage of
pupils overall were eligible in the north compared to the south of the Borough.
At June 2009 86.3% of eligible pupils in primary schools in Westminster took
up the offer of free school meals. In addition 46.8% of pupils had paid school
meals. In Local Authority maintained nurseries the uptake of free meals by
eligible children was 75.3%. An additional 28.5% had paid meals
(Westminster City Council).
24FINAL - Early Years JSNA - Public Health, NHS Westminster, December 2009
Free school meals are used as an indication of child poverty, although their
intention is to provide children with one nutritionally balanced meal a day
during the school week. Food standards introduced in September 2008 aim
to ensure that all school meals and other school food sources are healthy.
Healthy Start is a national scheme which promotes healthy eating in mothers
and young children from deprived backgrounds. It is open to pregnant women
and families with children under the age of four who are on:
• Income Support
• Income-based Jobseeker's Allowance or
• Child Tax Credit (but not Working Tax Credit unless their family is
receiving Working Tax Credit run-on only6) with an income of £16,040 a
year or less (2008/9)
All pregnant women under the age of 18 also qualify, whether or not they are
on benefits.
Once accepted on the scheme, pregnant women and families will receive a
set of vouchers through the post every four weeks. Each voucher is worth
£3.10 and can be exchanged for any combination of milk, fresh fruit, fresh
vegetables and infant formula milk in registered shops. Women who are
eligible receive these vouchers for each child they have under the age of four.
Healthy Start also provides free vitamin supplements to qualifying pregnant
women, mothers and children. Women are entitled to free vitamins during
pregnancy and until their baby is one year old. Children are entitled to free
vitamin supplements from 6 months of age until their fourth birthday. Letters
offering entitlement to vitamin supplements can be exchanged for vitamins
from the relevant distribution points such as children’s clinics or GP surgeries.
As well as their vouchers, beneficiaries also get health advice about healthy
eating, breastfeeding, infant feeding and using the vouchers.
Figure 14: Individuals qualifying for Healthy Start food vouchers in
Westminster. 2009
Snapshot figures (taken on one particular day, at one
particular time during the 4 week cycle)
4 Week Cycle - 2009
Percentage of those
Numbers of
Numbers eligible7 eligible using the
beneficiaries
scheme
75 19 Jan – 15 Feb 2363 2013 85.2%
6
Working Tax Credit run-on is the Working Tax Credit received in the 4 weeks immediately
after stopping working for 16 hours or more per week.
7
The eligibility data is new and should be interpreted with caution. Eligibility could never be
100% because someone would not have their application processed the same day they
became eligible.
25FINAL - Early Years JSNA - Public Health, NHS Westminster, December 2009
76 16 Feb – 13 Mar 2386 2021 84.7%
Source: Department of Health, 2009
Local data-collecting around individuals eligible for Healthy Start is relatively
new and the figures reported above are a snapshot view and should be
interpreted with caution. There are indications, however, that within
Westminster around 85% of individuals qualifying for Healthy Start take up the
scheme, which is higher than the national average (of around 80%).
Although we have indicative data for eligibility and uptake of the Health Start
Scheme in Westminster, we do not currently have any data on how many
vouchers were actually used and where (type and locality of shops) and
whether the individuals in receipt of the vouchers were provided with ANY
advice/suggestions for preparing and cooking the fresh fruit and vegetables
provided.
Local and national intelligence also suggest that the vitamin supplement part
of the scheme is under-utilised mainly due to lack of publicity and difficulty in
accessing the product which has suffered periods of product discontinuation
and withdrawal from pharmacies in lieu of children’s clinics and GP surgeries.
Early indications are that such changes have further reduced the uptake of
vitamins by the eligible mothers and children and that an alternative local
solution and re-launch of the campaign will be necessary to increase the
uptake of this scheme aimed at reducing inequalities in health among the
most disadvantaged and at risk groups of the population.
3.2 Housing
The Index of Child Wellbeing (CWI) 2009 represents the first attempt to
create a small area index exclusively for children in England. The index is
one of wellbeing rather than deprivation. The CWI is made up of seven
domains, one of which is on housing.8 Data for the housing domain was built
up from various indicators from the 2001 Census around access to housing
and quality of housing.9 The Lower Super Output Area (LSOA) with the
lowest wellbeing was in Marylebone High Street Ward (Department for
Communities and Local Government: Local Index of Child Well-Being 2009).
http://www.communities.gov.uk/publications/communities/childwellbeing2009
8
The others 6 domains are material wellbeing, health, education, crime, environment and
Children in Need.
9
The indicators included overcrowding, 0-15 year olds living in shared dwellings,
homelessness and lack of central heating.
26FINAL - Early Years JSNA - Public Health, NHS Westminster, December 2009
Figure 15: Child Wellbeing Index quintiles for Housing by Westminster
Lower Super Output Area
Overcrowded living conditions have traditionally been associated with an
increased prevalence of mental health problems and infectious diseases.
30% of housing in Westminster is classified as overcrowded. This places
Westminster as the third highest in the country in terms of overcrowded
housing conditions; significantly higher than London (17%) and England (7%).
For houses that are occupied with dependent children, the overcrowding
figure is 45%.
Figure 16: Proportion of housing occupied by dependent children
classified as overcrowded by housing tenure, 2001 Census
Owned Rented from Council Other Social Rented Privately Rented
29% 67% 51% 35%
Source: National Census 2001, Office for National Statistics, 2003.
The proportion of properties that are overcrowded varies between wards, from
16% in Knightsbridge and Belgravia to 64% in Church Street. Those areas
with the highest proportions of overcrowded housing are those that are the
most deprived in Westminster.
27FINAL - Early Years JSNA - Public Health, NHS Westminster, December 2009
Figure 17: Proportion of housing occupied by dependent children (all
ages) classified as overcrowded by ward, 2001
70%
60%
50%
Proportion overcrowded
40%
30%
20%
10%
0%
et
d
er
a
e
re
le
ce
ll
rk
d
e
et
rk
k
rk
's
nd
e
k
hi
oa
vi
oo
ar
oa
at
ic
rn
es
Va
re
Pa
re
at
Pa
Pa
ua
ni
tE
rc
ra
w
rG
qu
ou
R
br
R
St
w
St
m
Ve
q
ar
hu
lg
da
e
's
t's
es
ys
tS
ch
tS
tb
y
Ja
w
te
yd
h
Be
W
h
en
be
C
en
e
ai
ro
Ba
es
W
ig
rc
Ta
as
se
en
ttl
H
St
M
ue
H
Ab
ar
hu
d
eg
W
Li
nc
or
nc
an
H
e
Q
C
R
D
La
on
Vi
ge
d
eb
an
rid
yl
sb
n
ar
to
M
ht
ns
ig
ya
Kn
Ward
Br
Source: National Census 2001, ONS 2003
Living in temporary accommodation is linked to worse mental and physical
health outcomes. This is thought to relate to the quality of the housing and
the level of access to social and health services and support networks by
those who may have only recently arrived to the UK often following traumatic
events in heir homeland. Alongside poor living conditions, uncertain living
conditions affect educational development and attainment which is of vital
importance during these formative years.
A snapshot figure taken on 31 March 2009 showed there were 34 children
aged below 5 years temporarily placed in emergency Bed and Breakfast
accommodation by Westminster, while waiting for allocation of a suitable self-
contained temporary accommodation property (6 week target). (Data provided
by Westminster City Council Housing Department)
Westminster makes every effort to move families out of emergency Bed &
Breakfast accommodation within the 6 week target and this is monitored by
Housing Options on a weekly basis. There are seldom more than 2-3 families
per month having to wait a few days beyond this target. Most often the delays
to being placed into a suitable self contained temporary accommodation
property are due to either the involvement of social services which can restrict
the location in which the family can be placed, or the medical conditions
affecting the family limiting the types of properties which would be suitable.
As at April 2008 Westminster City Council reported a total of 1,080 primary
school age children in self-contained temporary accommodation situated in
Westminster and other Boroughs (APHR, 2006/7, NHS Westminster).
28FINAL - Early Years JSNA - Public Health, NHS Westminster, December 2009
3.3 Lone parents
Single parent households have become increasingly common in recent years.
Many children in such households maintain a good relationship with the
absent parent. However, where children have a poor relationship or no
relationship with one parent, or where there is family conflict, children are at
increased risk of social exclusion.
In 2007 25% of babies in Westminster were born outside of marriage and
5% were born outside of marriage and only one parent signed the birth
register. According to national statistics, infant mortality rates are higher for
infants born outside marriage, although this could be a reflection of
differences in social class distribution. (ONS Vital Statistics, 2007)
The diagram below presents the number of lone parent households with
dependent children (aged 0-15 years) as a percentage of all households with
dependent children. The lowest proportion of lone parent households was
found in the Bayswater ward (41%), whilst the highest was in the Harrow
Road ward (64%). (ONS, 2001 Census)
Lone parents may also face increased barriers to working resulting in them
becoming dependent on the benefit system. Such barriers include a lack of
affordable child care, limited flexibility in parental leave and leave to care for
sick children, and excessive and unsociable working hours.
Figure 18: Lone Parent Households by Electoral Ward, 2001, as a
percentage of all households with dependent children
St John's Wood
Abbey Road
& Marylebone
Maida Vale Regent's Park
Queen's Park
Harrow
Road
Church
Little Street
Queen's Park Venice Soho & West End
& Paddington Westbourne
Bryanston
& Dorset Marylebone
Bayswater Square High Street
Hyde Park
Lancaster Gate
West End
Knightsbridge
& Belgravia St. James's
Lone Parent Households
Percentage
60 + Victoria & Pimlico
55 to 59 Vincent
Square
Warwick
50 to 54
Lone Parent Households
Percentage 45 to 50 Tachbrook
Churchill
60 + 40 to 44
55 to 59
50 to 54
45 to 50
Source: National Census 2001, Office for National Statistics, 2003
29You can also read