Deliverable 7.6 Final project conference proceedings to disclose the consortium conclusions and recommendations - FutureFlow
←
→
Page content transcription
If your browser does not render page correctly, please read the page content below

Ref. Ares(2020)546452 - 29/01/2020

                                                Deliverable 7.6
   Final project conference proceedings to disclose the
      consortium conclusions and recommendations
                                                              —

                                                   2 0 1 9

This project has received funding from the European Union’s Horizon 2020 research and innovation programme
                                                                            under grant agreement n° 691777

              FutureFlow, D 7.6 Final project conference proceedings to disclose the consortium conclusions and recommendations   page 1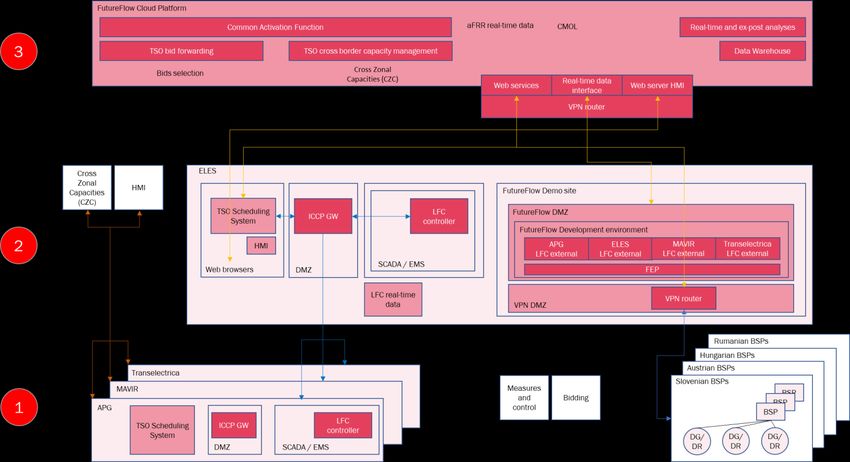
Document Information
 Programme                     Horizon 2020 – Cooperation / Electricity

 Project acronym               FutureFlow

 Grant agreement n°            691777

 N° of the Deliverable         D7.6

 WP/Task related               WP7 / T7.5

 Type                          Report

 Confidential                  Public

 Date of delivery              20.12.2019

 Status and Version            Final, version 1.0

 Number of pages               50

 Document responsible ELES

 Author                        Carlo Degli Esposti

 Reviewer(s)                   Andreja Ivartnik Kanduč (EIMV), Darko Kramar (ELES), David Gerbec (ELES)

                FutureFlow, D 7.6 Final project conference proceedings to disclose the consortium conclusions and recommendations   page 2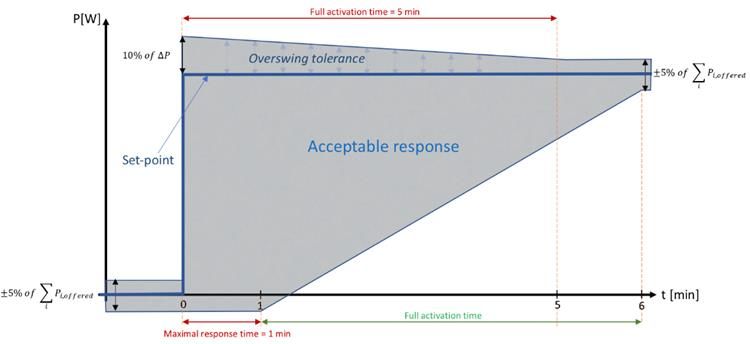
Versioning:

 Version         Date             Author(s)                                       Notes                                    Status

0.1           16/12/2019     Carlo Degli Esposti Exec summary and pictures missing                                       Draft
              17/12/2019     Andreja I. Kanduč                                                                           Review
0.2
                             D. Kramar
0.3           18/12/2019     Carlo Degli Esposti                                                                         Draft
              30.12.2019     Andreja I Kanduč                                                                            Review
0.4
                             D. Kramar
0.5           6.1.2020       Version ready for approval by GA

           FutureFlow, D 7.6 Final project conference proceedings to disclose the consortium conclusions and recommendations        page 3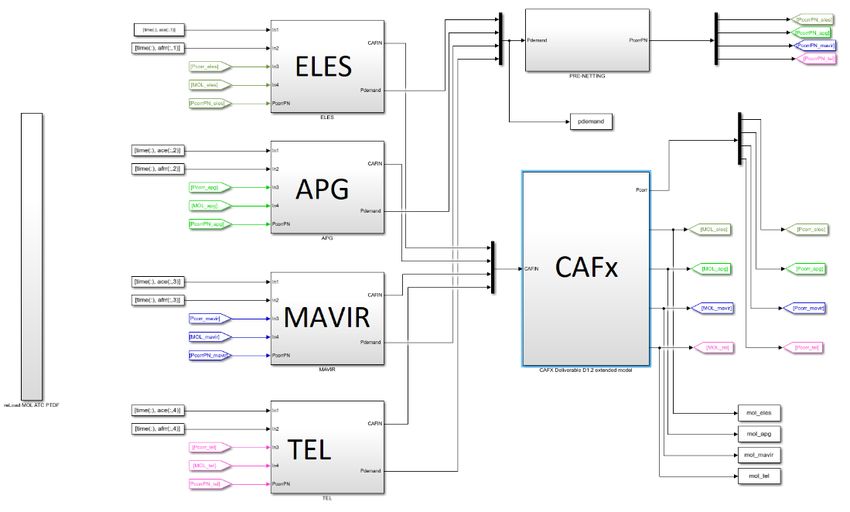
TABLE OF CONTENTS
Document Information ................................................................................................................................. 2

INDEX OF FIGURES AND TABLES ..................................................................................................................... 5

GLOSSARY ................................................................................................................................................... 6

ABBREVATIONS ............................................................................................................................................ 9

EXECUTIVE SUMMARY ................................................................................................................................. 10

1 The aim of the FutureFlow Project ............................................................................................................ 13
        Project Partners ...............................................................................................................................................................................14

2 Introduction: the FutureFlow project ........................................................................................................ 14

3 Scope of the project and of its exploitable results ...................................................................................... 17
       TSO and NRAs ..................................................................................................................................................................................17
       Industrial target groups ...................................................................................................................................................................18
       Prosumers ........................................................................................................................................................................................19
       IT industries ......................................................................................................................................................................................19

4 Contribution of project parties ................................................................................................................. 20
       EIMV ................................................................................................................................................................................................20
       EKC ................................................................................................................................................................................................26
       SAP ................................................................................................................................................................................................29
       cyberGRID .........................................................................................................................................................................................31
       GEN-I 33

5 Key features of project results .................................................................................................................. 35

6 Value addition to the energy sector ........................................................................................................... 36

7 Conclusions: the strength and the potential of the FutureFlow scenario ...................................................... 36

Appendix 1 – List of Exploitable results ........................................................................................................ 39

                      FutureFlow, D 7.6 Final project conference proceedings to disclose the consortium conclusions and recommendations                                                          page 4
INDEX OF FIGURES AND TABLES
Figure 1: The high-level architecture of FutureFlow ........................................................................... 16
Figure 2: the tolerance band described in terms of power as function of the activation time ......... 22
Figure 3: Envelope determination for fast-changing set-points (steps)............................................. 22
Figure 4: Envelope determination for smooth changes in set points (without step changes) .......... 23
Figure 5: The location of CAFx module within the DEMOx module program ..................................... 24
Figure 6: The methodology of the power flow colouring .................................................................... 28
Figure 7: the high-level concept of FutureFlow ................................................................................... 36
Table 1: The list of FutureFlow project partners ................................................................................. 14
FutureFlow, D 7.6 Final project conference proceedings to disclose the consortium conclusions and recommendations page 5GLOSSARY
Area Control Error The ACE is the sum of the power control error (‘ΔP’), that is the real-time
difference between the measured actual real time power interchange
value (‘P’) and the control program (‘P0’) of a specific LFC area or LFC
block and the frequency control error (‘K*Δf’), that is the product of the
K-factor and the frequency deviation of that specific LFC area or LFC
block, where the area control error equals ΔP+K*Δf (see EU Reg.
2017/1485, Part I, art. 3, point 2(19)).
Balancing Service Provider A market participant with reserve-providing units or reserve-providing
groups able to provide balancing services to TSOs (see EU Reg.
2017/2195, Title I, art. 2(19)).
Common Activation Function The function of operating the algorithm applied to optimise the
activation of balancing energy bids (synonym of 'activation
optimisation function' as per EU Reg. 2017/2195, Title I, art. 2(39)).
Commercial and Industrial Synonym adopted in the project for Significant grid users (see).
consumers
Common Merit Order List Common merit order list (CMOL) in the European Union Internal
Electricity Balancing Market is a list of balancing energy bids sorted in
order of their bid prices, used for the activation of those bids
(Commission Regulation (EU) 2017/2195 of 23 November 2017
establishing a guideline on electricity balancing, Article 2(37)).
Cross Zonal Capacities Cross-zonal capacity in the EU energy market is defined as the
capability of the interconnected system to accommodate energy
transfer between bidding zones (see Article 2(10) of the Regulation
543/2013 of 14 June 2013 on submission and publication of data in
electricity markets, or Article 2(70) of the Regulation (EU) 2019/943 of
the European Parliament and of the Council of 5 June 2019 on the
internal market for electricity (recast), as well as Article 2(5) Regulation
(EU) 2019/941 of the European Parliament and of the Council of 5 June
2019 on risk-preparedness in the electricity sector).
FutureFlow, D 7.6 Final project conference proceedings to disclose the consortium conclusions and recommendations page 6Distributed Generation Generic term referring to a variety of technologies that generate
electricity at or near where it will be used, such as solar panels and
combined heat and power. Distributed generation may serve a single
structure, such as a home or business, or it may be part of a micro grid
(a smaller grid that is also tied into the larger electricity delivery
system), such as at a major industrial facility, a military base, or a large
college campus. When connected to the electric utility’s lower voltage
distribution lines, distributed generation can help support delivery of
clean, reliable power to additional customers and reduce electricity
losses along transmission and distribution lines.
Demand Response Changes in electric usage by end-use customers from their normal
consumption patterns in response to changes in the price of electricity
over time, or to incentive payments designed to induce lower electricity
use at times of high wholesale market prices or when system reliability
is jeopardized (see Balijepalli, Murthy; Pradhan, Khaparde (2011).
"Review of Demand Response under Smart Grid Paradigm". IEEE PES
Innovative Smart Grid Technologies – this is the definition formally
adopted by Department of Energy Regulation in the US, in Europe there
is no formal definition in the presently approved Grid codes).
Full Activation time It is the period between the activation request by the connecting TSO
in case of TSO-TSO model or by the contracting TSO in case of TSO-BSP
model and the corresponding full delivery of the concerned product
(see Commission Regulation (EU) 2017/2195 of 23 November 2017
establishing a guideline on electricity balancing, Article 2(30)).
Load-Frequency Control Methodologies adopted by TSOs to maintain frequency reasonably
stable around the 50 Hz value and power interchanges with
neighbouring control areas at the scheduled values.
Power Flow Colouring Methodology developed by EKC to allocate sources and sinks of power
flows on transmission lines, so to identify responsibilities for
imbalances and system security breaches.
Renewable Energy Sources Energy sources that do not rely on fuels of which there are only finite
stocks. The most widely used renewable source is hydroelectric power;
other renewable sources are biomass energy, solar energy, tidal
energy, wave energy, and wind energy (see European Environment
FutureFlow, D 7.6 Final project conference proceedings to disclose the consortium conclusions and recommendations page 7Agency, Glossary - https://www.eea.europa.eu/help/glossary/eea-
glossary/renewable-energy-source).
Regional Security Centre The entity or entities, owned or controlled by TSOs, in one or more
capacity calculation regions performing tasks related to TSO regional
coordination (see EU Reg. 2017/1485, Part I, art. 3, point 2(89)).
Significant grid user The existing and new power generating facility and demand facility
deemed by the TSO as significant because of their impact on the
transmission system in terms of the security of supply, including
provision of ancillary services. Could be used as a synonym for main
VPPs directly connected to the Transmission Network. There is no
formal definition of SGU in the network code, but a precise indication
of their role and responsibilities is available in: ENTSO-E Supporting
Document for the Network Code on Operational Security of 24
September 2013 2nd Edition Final, p. 61, 62.
Transmission system An organisation which is responsible for the transport of electrical
operators energy at national or regional level using fixed infrastructure.
Virtual Power Plant A virtual power plant is a system that integrates several types of power
sources to give a reliable overall power supply. The sources often form
a cluster of different types of dispatchable and non-dispatchable,
controllable or flexible load, distributed generation (DG) systems that
are controlled by a central authority and can include micro CHPs,
natural gas-fired reciprocating engines, small-scale wind power plants
(WPPs), photovoltaics (PVs), run-of-river hydro power plants, small
hydro, biomass, backup generators and energy storage systems (ESS).
FutureFlow, D 7.6 Final project conference proceedings to disclose the consortium conclusions and recommendations page 8ABBREVATIONS ACE Area Control Error BSP Balancing Service Provider CAFx Common Activation Function C&I Commercial and Industrial consumers CMOL Common Merit Order List CZC Cross Zonal Capacities DG Distributed Generation DR Demand Response DG&DRs Distributed Generation and Demand Response resources FAT Full Activation time LF Load-Frequency PFC Power Flow Colouring RES Renewable Energy Sources SGU Significant Grid User TSO Transmission system operators VPP Virtual Power Plant FutureFlow, D 7.6 Final project conference proceedings to disclose the consortium conclusions and recommendations page 9
EXECUTIVE SUMMARY
The FutureFlow project has shown the true potential of flexible resources that are available within the power
system. The results and products of this project will help TSOs to get access to all this resources and affirm
their central role as the most reliable “system frequency manager”.

The energy market has evolved from a power system, reliant on a bulk, concentrated generation towards
geographically sparse wind and solar sources often connected to voltage levels out of the direct control of
the TSO. This requires technical, operational and market solutions featured in the FutureFlow project to
process ever increasing amounts of data from which the frequency signal is dependant and will be even
more dependent in the future. Besides this, the flexibility price is on the way to become a fundamental price
signal of wholesale electricity for the European market.

The Energy Regulation 2019/943 indicates full marginal pricing for balancing as the recommended pricing
practice. However, to avoid price distortions, the overarching and detailed views of the actual volume of
generation and demand to modulate the frequency signal is the only acceptable precondition to deliver
transparent and cost-reflective market prices. Nowadays, the coordination between balancing and
redispatching resources, cross-border exchanges and different voltage levels is constrained. These
constraints are also due to the lack of targeted business solutions that favour the cross-border market
access and the contribution of new flexibility sources to the stability of system frequency. Other dimensions
of power system stability and control, including the cross-voltage coordination, voltage control, influence
on system inertia are have not been in scope for FutureFlow due to limited time and personal resources, but
the project has demonstrated that crating the link between the distribution voltage level and the high-
voltage level, between the smallest control units and TSOs control centres, the aggregated DR&DG resources
can be very beneficial for system operation with the proper coordination among involved stakeholders.
Particularly in the future, when more and more energy will be provided by renewable resources and the need
for power reserve will be huge, the new flexibility sources will represent real and healthy competition to the
conventional units taking part in the aFRR yesterday and today.

With FutureFlow, the energy market coupling for the day-ahead and intraday markets are compressed into
a response timeframe of a few minutes, bringing transparency to the available flexibility in the system in the
timeframe where flexibility reveals its real value to system balancing and congestion management.

How does FutureFow works? FutureFlow relies on the exchange of balancing energy between the TSOs,
implying that the exchange of any kind of balancing services is possible exclusively by involved Transmission
System Operators and that activation of aFRR energy in a specific control zone, both from conventional and
DR/DG providers, is realized through the local TSO. The usual sequence of steps is then followed for process
of exchange of aFRR balancing energy: prequalification, bidding, activation and exchange and settlement.
For each of these steps the project has introduced important steps in procedural alignment and technical
innovation. The full activation time of reserve and the product resolution have been aligned in the four
involved countries, and the stochastic rate of change of load or generation (particularly renewables) within
each of the involved country has been linked to the steeper ramps to be produced by activated reserve in

 FutureFlow, D 7.6 Final project conference proceedings to disclose the consortium conclusions and recommendations   page 10
the environment registering a generalised system inertia decrease.

These features have been integrated with the latest achievements reached by TSOs for optimizing the
calculation and sharing resources for operational reserve and re-dispatching across control zones. The
sharing of resources is not limited to those available at the transmission level but can reach distributed
generation and demand side resources connected to the lower voltage levels.

Testing this solution would have not been possible if Virtual Power Plant (VPP) technology would have not
been modelled and tested in real-life pilots with various flexibility portfolio structures for this project. This
fundamental project result has created a composite library of business cases and solutions that can be used
for industrial applications in areas where the flex potential of, e.g. small hydro, has been largely untapped,
thus allowing the fast and quick inclusion of the VPP flexibility into the market.

All VPP building blocks have been integrated into “cyberNOC”, an ICT platform developed by cyberGRID that
enables seamless integration of renewables, distributed generation, C&I customers, EV charging stations,
batteries and prosumers to European energy markets. Its functionalities comprise real-time metering data
collection, advanced analytics for flexibility forecasting, baselines and evaluations, optimization of
aggregation portfolio, flex product placement and market arbitrage, automatic bid generation, monitoring
and controlling of activations, market integration protocols, etc.

In this respect, FutureFlow works both as a power system “telescope” and “microscope”, gathering a
broader geographical scope for collecting flexibility resources and, at the same time, with more detailed
views of available generation and demand-side resources niched at lower voltages, thus contributing to
determine system security perimeter every 15 minutes for the coming day.

The unprecedented results of this project pave the way to resolving other issues TSOs are facing. Providing,
for example, increasing support to Regional Security Coordinators in their day-to-day security assessment
processes. The data collected by FutureFlow tools could provide increased precision for cross-zonal
capacity calculations and system security when used for forecasting purposes, allowing more precise
provisions on how to tackle congestion at the borders is handled with a higher level of flexibility. Based on
15-minute market intervals or longer term scenarios, when developing new infrastructures, the combined
use of FutureFlow databases with robust market price forecasting tools can offer a basis to develop new
tools to enhance the precision of cross-border cost allocations (CBCA) for Projects of Common Interest (PCI).
Leveraging on the more accurate assessment of balancing resources and the positive economic effect of
their cross-border sharing the CBCA assessment process is another benefit of this project.

ACER has recently expressed expectations and perception of the future balancing markets. Their
representative at the FutureFlow’s final conference in Vienna summarized these goals:

              •     To allow and enable new, environmentally friendly sources to enter balancing markets
                    and became important players offering TSOs their flexibility.

              •     To decrease the need for system reserves. This is expected to be achieved by regional
                    dimensioning of system reserves.

  FutureFlow, D 7.6 Final project conference proceedings to disclose the consortium conclusions and recommendations   page 11
• To integrate local markets into the regional cross-border balancing/flexibility markets. With its exploitable results and findings, FutureFlow strongly contributes directly to the achievement of these goals. The ambitious target to engage 35-45 MW of flexibility coming from DR&DG supports the first bullet above. The initial goal has even been exceeded by about 50%. Together with the objective to decrease the need for system reserves by enhanced TSOs regional coordination, new flexibility providers will make a strong pressure on conventional resources, notably on thermal units, currently detaining the largest share in the aFRR and mFRR markets. The real-time tests with DR&DGs showed that the quality of aFRR and mFRR services from new flexibility providers is comparable with the performance of the conventional power plants. Finally, besides local activations, the DR&DGs have also been tested in numerous cross-border proving the benefits of an integrated balancing market. In average 23% less aFRR energy needs to be activated in case of integrated markets compared to the local mode operation of four power systems. This is an additional strong driver for TSOs and regulators to integrate balancing markets at the shortest possible notice. FutureFlow, D 7.6 Final project conference proceedings to disclose the consortium conclusions and recommendations page 12
1 The aim of the FutureFlow Project

   Four European TSOs of Central-Eastern Europe (Austria, Hungary, Romania, Slovenia), associated with
   power system experts, electricity retailers, IT providers and aggregators, propose to design a unique
   regional cooperation scheme: it aims at opening Balancing and Redispatching markets to new sources of
   flexibility and supporting such sources to act on such markets competitively. By means of a prototype
   aggregation solution and renewable generation forecasting techniques, flexibility providers – distributed
   generation (DG) and commercial and industrial consumers (C&I) providing demand response (DR) – are
   enabled, to participate on the aFRR market with participation in the portfolio for Frequency Restoration
   Reserve (including secondary control activated with a response time between 30 seconds and 15 minutes).
   Retailers act as flexibility aggregators and pool the resource in order to provide the products required by the
   TSO. A comprehensive techno-economic model for the cross-border integration of such services involves a
   common activation function (CAFx) tailored to deal with congested borders and optimized to overcome
   critical intra-regional barriers. The resulting CAFx is implemented into a prototype Regional Balancing and
   Redispatching Platform, securely integrated within the four TSOs’ IT systems: this makes research activities
   about cross-border integration flexible while linking with the aggregation solution. Use cases of growing
   complexity are pilot-tested, going from the involvement of DR and DG into national balancing markets to
   cross-border competition between flexibility providers. Based on experiences with mFRR, participating C&I
   consumers and DG are expected to provide between 30MW and 45MWof aFRR. Impact analyses of the pilot
   tests together with dissemination activities towards all the stakeholders of the electricity value chain will
   recommend business models and deployment roadmaps for the most promising use cases, which, in turn,
   contribute to the practical implementation of the European Balancing Target Model by 2020.

     FutureFlow, D 7.6 Final project conference proceedings to disclose the consortium conclusions and recommendations   page 13
Project Partners
No Name Short name Country
ELES DOO SISTEMSKI OPERATER PRENOSNEGA ELEKTROENERGETSKEGA
1 ELES, d.o.o. Slovenia
OMREZJA
2 AUSTRIAN POWER GRID AG APG Austria
MAVIR MAGYAR VILLAMOSENERGIA-IPARI ATVITELI RENDSZERIRANYITO
3 MAVIR ZRT Hungary
ZARTKORUEN MUKODO RESZVENYTARSASAG
COMPANIA NATIONALA DE TRANSPORT ALENERGIEI ELECTRICE TRANSELECTRICA
4 TRANS Romania
SA
5 ELEKTROINSTITUT MILAN VIDMAR EIMV Slovenia
6 ELEKTROENERGETSKI KOORDINACIONI CENTAR DOO EKC Serbia
ELEKTRO ENERGIJA, PODJETJE ZA PRODAJO ELEKTRIKE IN DRUGIH EE
7 Slovenia
ENERGENTOV, SVETOVANJE IN STORITVE, D.O.O.
8 GEN-I, TRGOVANJE IN PRODAJA ELEKTRICNE ENERGIJE, D.O.O. GEN-I, d.o.o. Slovenia
9 SAP SE SAP SE Germany
10 CYBERGRID GMBH CYBERGRID Austria
11 GEMALTO SA GTO France
12 3E NV 3E Belgium
Table 1: The list of FutureFlow project partners
2 Introduction: the FutureFlow project
The sheer increase of electricity generation from renewable sources in many European regions has
determined on one side an accelerating movement towards the decarbonisation of electricity generation
but has also created increasing issues to the system operators and to market actors with classical, large
thermal power plants. Both grid and conventional generation have been facing increasing hurdles to
manage volatile energy flows without being in condition to determine duly in advance their operational
security limits and the generation capacity to be reserved for balancing and redispatching purposes. As a
direct consequence, the cost of redispatching actions has become dramatically high in several Central
European countries.
Despite the attempt of creating markets for these grid related services, costs are still largely translated to
final consumers, instead of being allocated to those causing them. The widening gap between expectations
(cheaper energy produced via renewable energy resources) and reality (higher bills due to the increasing
operational costs, or “system service charges”, for transmission and distribution system operators) is
pushing many grid users to evaluate “grid-independent” forms of supply, often without appreciating the
fundamental role that system operators have when it comes to system frequency control and maintenance
FutureFlow, D 7.6 Final project conference proceedings to disclose the consortium conclusions and recommendations page 14of the dedicated assets. The role of TSOs remains therefore central but in order to secure this role
throughout the long process of the electricity transition towards a largely decarbonized system, research
and innovation activities are needed to ensure that consumers and distributed generators can be placed in
condition to provide balancing and redispatching services, within an attractive business environment.
It is in this complex framework that FutureFlow targets the design and the pilot test of comprehensive
techno-economic models for open and non-discriminatory access of advanced consumers and distributed
generators to a regional platform for ancillary/balancing and redispatching services. FutureFlow lays down
the case for several success stories:
• industrial consumers and distributed generators can learn how to leverage on their production
assets to reduce energy costs and increase their capital turnover,
• Aggregators can expand their potential customers’ base, disposing of a concrete case to justify their
business and opening new business opportunities into unexploited value pools;
• TSOs can extract the maximum system flexibility they need on a cross border, gathering much
deeper insight into their system capabilities and learn further how to plan with advanced techniques
the operational security of the future electricity system. FutureFlow will create more competition in
reserve markets, a potential decrease in the total volume of contracted operational reserves and
more efficient (technical and economic) congestion management.
The FutureFlow project is expanding its scope of operation of so-called secondary frequency control from
generation to consumption and will provide for the international performance of such activities. With this
goal in mind, the partners of the FutureFlow project are exploring new solutions for balancing the electricity
system and managing flows in the European electricity network. The progressive consumers addressed by
the FutureFlow project will be capable of increasing or reducing their consumption in a few seconds and will
in this way be performing functions that are predominantly carried out by traditional, hydro or thermal
power plants.
As a development project, FutureFlow will not remain solely on the level of scientific contributions. The
results of its work will include prototype solutions which industry can also apply in the real economy after
the project’s conclusion.
The Figure 1 below illustrates the functional interactions between the prototype flexibility aggregation
platforms and the prototype regional balancing and re-dispatching platform as the central point for the
cross-border and other transmission system operators (TSO) oriented businesses. The field tests with real
energy customers and distributed generation owners aim show the synergetic benefits from the
collaboration of such commercial and industrial (C&I) consumers, prosumers and distributed generators in
frequency restoration reserve markets combined with the cross-border integration of such markets.
FutureFlow also intends to analyse the scalability and replicability potential at European level of the most
promising tested use cases as designed for the four involved countries.
FutureFlow, D 7.6 Final project conference proceedings to disclose the consortium conclusions and recommendations page 15Figure 1: The high-level architecture of FutureFlow
The different levels of system integration are described by the red dotted numbers on the right of the picture:
1. The lower level, indicated by number one, reports the local schemes and a high-level representation of a
generic BSP, aggregating distributed generation and/or demand response in specific TSO control areas
(the example is provided for Slovenia but, generalizing, can correspond to any of the four control zones
participating to the project).
2. The middle level, indicated by number two, is the demo site, a fully functioning solution implemented by
EIMV to allow a full-sized simulation about how to prepare the DR&DG bids to be activated, how the system
will behave once DR&DG will be activated, so that actual activations are possible, without the hurdles
posed by prequalification barriers. The optimization itself is located into the optimization platform at level
1 above.
3. The higher level, indicated with number three the production platform, represents the cloud-based
platform integrated by SAP. This platform pulls together the information calculated by from the TSOs
about Cross-Zonal Capacities (CZC), the Common Merit Order List (CMOL) so to allow TSOs selecting the
most economically efficient bids for aFRR activation a redispatching actions via the Common Activation
Function (CAFx) developed by EKC and tested in the demo site by EIMV.
FutureFlow, D 7.6 Final project conference proceedings to disclose the consortium conclusions and recommendations page 163 Scope of the project and of its exploitable results
The project has been targeting several classes of market stakeholders.
TSO and NRAs
FutureFlow is addressing several hot topics for which TSOs have not yet been able to define solid outcomes.
Integration of renewables into balancing markets
The test runs in the framework of FutureFlow have been proving that Demand Response (DR) and
Distributed Generation (DG) units can provide balancing services, such as automatic Frequency Restoration
Reserve (aFRR), not only in regular operating conditions but even (and in particular) when the system is
under stress. In these cases, the available DG&DR volumes are capable of driving down prices, far from
balancing market price caps. This has proven the ability of industrial technologies to be as well as the
conventional generation for the participation in aFRR markets.
Establishment of regional/EU wide markets for cross-border exchange of balancing and redispatching
services
FutureFlow has been aggregating the electric power systems under the control of four TSOs. Each of these
systems is different from others in terms of their size, market maturity, amount of flexibility resources for
balancing services and redispatch. These four TSOs have been implementing a Regional Balancing Platform
with Common Activation Function for cross-border exchange of aFRR and redispatch services, relying on a
dedicated solution for combining and coordinating their area control signals (ACEs). Adding to the flexibility
volume traditionally delivered conventional power plants, the participation of demand-side response and
distributed generation to the future joint procurement process and to the regional activation platform has
paved the way for new flexibility providers on a wider scale. The four TSOs have been demonstrating benefits
for its own electric power systems, prosumers, as well as for broader TSO community with field pilot tests of
increasing complexity.
Grid Security
In the environment with significant influence of Renewable Energy Sources (RES), the concern of grid
security has been growing. Despite the support of Regional Security Centres (RSC), the day-to-day
assessment of the security margin requires additional information for a more reliable assessment of how
the system will behave the day after. FutureFlow has been establishing a very strong link between Grid
FutureFlow, D 7.6 Final project conference proceedings to disclose the consortium conclusions and recommendations page 17Security, Consumers and RES, thus letting the TSO access the information related to distributed generation and demand side response, until now brought into the calculation only as estimates. Consumers, instead of being passive observers become, as any mature balance service provider, the guardians of the Power System. Implementation of regulatory policies FutureFlow has been creating the sound preconditions for a more extensive debate about the role and the responsibility of distributed generation and demand side response in the electricity market and in the assessment of the grid security conditions by TSOs. FutureFlow has been leaving the usual track of the classical balancing products for fast reaction to disturbances and system frequency restoration to explore new solutions for new, suitable products to face the challenge of integrating increasing volatile volumes of renewable power. These new products have been defined and tested with the aim of searching and testing which product and its characteristics fit most for distributed generation and demand side response. Industrial target groups Opening a direct communication channel between distributed generation and the fundamental signal that the TSOs are using to manage the system frequency (the ACE) brings the cyber security issues at the centre of the scene. It is of paramount importance that the extreme security standards that TSOs are applying to their communication with power plants to activate and steer centrally the procured operational reserve is still delivered under the maximum-security standards. If this would be breached – and the risk increases as the number of points involved in the balancing service provision grows, the damage might be catastrophic for the system security, increasing exponentially the risks of wide scale blackouts. The whole aFRR information value chain, from field units up to the market, needs to be sufficiently secured against attacks and fraud. An innovative approach is being led by Gemalto, setting new standards in this domain. Besides cybersecurity, the integration of balancing markets is recognized to be one of the most important facilitators of the successful renewables’ integration and to the achievement of a fully coupled European electricity market. SAP has been leading the development of a HANA Cloud based aFRR regional platform, allowing seamless exchange of biding information between TSOs, conventional players and new market players like aggregators, renewables, storage operators and any other flexibility provider. It has been then necessary to interface this cloud-based aFRR regional platform with the TSO SCADA system, which have been extended to cope with the capability of finding balancing and redispatch resources on a much wider and system-deep scale than before. As it appears from Figure 1, the connection was established only between the platform and the SCADA of ELES; the other TSOs SCADAs were connected in cascade to the Slovenian TSO’s. This has been producing the same results as for a parallel connection though being still a suboptimal solution. New modules are being developed and have been tested against different use cases by the four partnering TSOs. These innovative modules will in the future become a standard feature of FutureFlow, D 7.6 Final project conference proceedings to disclose the consortium conclusions and recommendations page 18
advanced SCADA systems for the TSOs, integrating additional feeding signals to improve the quality of their
system control signal.

But extending the TSOs systems has not been enough to grant the targeted increase of service level from all
available resources. The other side of the medal, i.e. the flexibility platforms used by retailers or independent
aggregators to pool flexible loads, renewables, distributed generation, storage and other flexibility
providers to deliver tertiary (cold) reserve, needed to be adapted to become capable of delivering the
regulating power to the TSO systems. New DR&DG aFRR aggregation platform modules have been
developed by cyberGRID and 3E, with a clear objective to enable alternative distributed resources to become
a secure and reliable asset for aFRR provision.

Prosumers

Real consumers and producers (prosumers) of electrical energy have been invited to collaborate in
FutureFlow as flexibility power test providers.

The actual prosumers have had the possibility to learn and to prepare for the future market developments,
not only on the national but also on the regional level. By including their staff in FutureFlow project, parties
interested in the delivery of demand side response and owners of distributed generation have been not only
raising their theoretical knowledge or gathering informative awareness on balancing services, but have also
won practical skills of operating flexible technical units under balancing market rules. The industrial
prosumers have been benefitting from the interaction with the aggregator member of the project pool,
identifying clearly their technical and technological constraints and assessing their overall readiness for
participating in the FutureFlow envisaged balancing market environment. After only a few months, the very
tight collaboration between energy agents and prosumers has been already delivering promising results.

The prosumers interested in joining the results of FutureFlow will be able to learn from the experiences of
pilot participants, which will be published on the project website.

IT industries

IT is a game changer in business nowadays and can make the difference between staying on the brink of
innovation and being a follower. The FutureFlow project has been offering a great opportunity for the energy
industry to disrupt the electricity market structure with value-adding opportunities that reflect in overall
social welfare, sustainability for energy producers, stability of the energy grids and improved service for the
customers.

With its extensive experience in Big Data management and cloud projects, SAP has been bringing to
FutureFlow a new infrastructure for data and analytics – HANA Cloud Platform (HCP) – that is reliable,
powerful and highly scalable. HCP in an open platform-as-a-service that provides unique in-memory
database and application services that enables the rapid deployment of new applications or the extension

  FutureFlow, D 7.6 Final project conference proceedings to disclose the consortium conclusions and recommendations   page 19
of SAP applications in the cloud.

   HCP is already used by thousands of clients, mostly operating in the automotive, retail, healthcare,
   chemicals, high tech, utilities and oil and gas industries.

4 Contribution of project parties

    EIMV

   EIMV has been dealing with three key topics:

   1. How to prequalify distributed generation and demand side response for the provision of aFRR services.

   2. The “Envelope”: Design of new criteria for the performance analyses of demand response and
      distributed generation response to CAFx orders for the delivery of aFRR services.

   3. DEMOx side: This is a demo architecture, designed to minimize impact on TSO real-time functions and
      tools due to the needs of the project. EIMV designed digital twins of each TSO and a digital model of each
      power plant in the four countries region. This led to the core simulation system that was then connected
      in the final stage to the production platform. This latter sends information to the cloud system and the
      VPPs. The ACE control is then integrated with their response to account all power delivered by
      distributed resources. The platform provides support for the practical simulations and can be used as a
      simulation platform for new TSO, that want to join the region, or new type of flexibility to include, new
      market models to test.

     Prequalification of distributed generation and demand side

   Prequalification has been recognized as a complicated issue, as it has been in several other circumstances
   in the past, especially in relation to the baselining on the demand side.

   EIMV has been developing the simulation tool called DEMOx, which has at its heart the model for the
   optimization procedure for the use of the available resources. This platform allows a full-sized simulation
   about how to prepare the DR&DG bids to be activated, how the system will behave once DR&DG will be
   activated, so that actual activations are possible, without the hurdles posed by prequalification barriers. The
   optimization itself is located into the optimization platform, which is an out frame (developed by SAP). The
   choice was done after many simulations done to select the target model.

   The testing of the VPP models has been done with real units – which then worked as full BSPs: the unit went
   through the usual prequalification procedure, looking particularly to the unit FAT and gradient.
   Furthermore, a dry-run test was run just to see how the unit responded.

   Once the units were virtually prequalified in FutureFlow, they went to more complex tests in the pilot

     FutureFlow, D 7.6 Final project conference proceedings to disclose the consortium conclusions and recommendations   page 20
project, which were run by GEN-I in cooperation with the flexibility providers.
Design and development of the Envelope concept
The present approach to evaluate the delivery performance of aFRR balancing energy from BSP is based on
two methodologies:
1. Searching for special events in which set point was constant for a prolonged time (usually several
minutes), then changed to another constant value which is kept for long time period again (another
several minutes usually). Namely, it is well known what BSP response is acceptable in such cases. As
shown in Figure 2, acceptable response is depicted with grey area, with full activation time of 5 minutes
and maximal response time up to 1 minute. Overswing tolerance (allowed exceed of delivered product
over set point) varies in 5 minutes interval from 10% of change of power to 5% of offered power.
This first approach is applicable to the cases where set-point changes rarely (e.g. several minutes).
However, when set point changes frequently (e.g. every 2 seconds), this method doesn’t provide insight
into quality balancing product delivery by BSP and can’t be utilized for such use cases.
2. Computing amount of produced energy if BSP would operate exactly on set point time series and
comparing it to the measured amount of energy over longer periods of time (e.g. 15 minutes). If the
difference between these two values is under an acceptable range, the delivered energy is paid as bid or
as marginal price.
This second approach is simple for implementation but doesn’t provide satisfying accuracy. This method
lacks any acceptable tolerance on one side (amount of energy is computed exactly from set points) and
everything is averaged over very long time periods with no details, so all shorter time violations (even very
severe ones) of operation could get annulated if half of them is positive and another half negative. With such
low accuracy, numerous violations of product delivery can’t be detected.
EIMV has developed a novel approach with an envelope (interval of variations during time) of acceptable
power (lower and upper bound) around set points, which is computed at all points in time where set points
are sent to BSP — at every optimization cycle, usually every 2 seconds. In practice, this solution creates on
one side a “tolerance” band around the set-points and makes sure that the counting of activated energy
does not necessarily starts from the very initial instant after the activation order (which is unrealistic due to
the physics of the system) and on the other side prevents that frequent activations up and down are not
causing set-point deviations which, due to their opposite sign, are netting out with each other and therefore
are not detected as scheduling violations. The algorithm is considering general tolerance, maximal response
time, full activation time and overswing tolerance at every change of a set point which may be completely
arbitrary at every optimization cycle. All considering quantities are parametric. In a specific user case, EIMV
has recorded a used 5% general tolerance, 1 minute of maximal response time, 5 minutes of full activation
time and 10% of change of overswing tolerance. With this envelope, it is possible to validate if a BSP is inside
FutureFlow, D 7.6 Final project conference proceedings to disclose the consortium conclusions and recommendations page 21of an envelope or to precisely evaluate violation1 of product delivery (when measured P arrives outside the
area bounded by the envelope.
Figure 2: the tolerance band described in terms of power as function of the activation time
EIMV has successfully implemented an evaluation of four actual BSPs using real demand response and
distributed generation in four different control zones, operating in an actual environment in real-time. Two
examples of envelope determination for different set point signals are given in the figures below.
Figure 3: Envelope determination for fast-changing set-points (steps)
Figure 3 represents the use case when set point changes suddenly in steps. It can be observed that the
1
“Violation” is defined as a difference between measured active power and calculated envelope.
FutureFlow, D 7.6 Final project conference proceedings to disclose the consortium conclusions and recommendations page 22proposed method accurately follows such intensive set-point changes.
Figure 4: Envelope determination for smooth changes in set points (without step changes)
In Figure 4, the proposed method easily follows the dynamics of smoothly set-point changes. The two
showed use cases are boundary cases that are seen in the practice of balancing product activation.
The envelope has been determined based on several recorded inputs, and it allows a precise tracking how
the provision was performed. Model build by EKC and EIMV put in real time loop produced bids, and the
signal was sent to the VPPs. EIMV has been simulating the responses to the FRR set point values, looking at
the operation parameters, chosen from one time series (for the test performed when platform fully
upgraded). Looking at TSOs, open loop ACE has been recorded on one month of data and based on this time
series the controller produced control demand, a mirror signal for open loop ACE. After that, the controller
was in the condition to also calculate the correction due to imbalance netting and cross border flows. The
assessment has been done for each technology, the respective response has been analysed and it was
determined when the response was not following set point correctly.
The DEMOx platform model
The structure of the model for the ACE optimization process is described in the picture below:
FutureFlow, D 7.6 Final project conference proceedings to disclose the consortium conclusions and recommendations page 23Figure 5: The location of CAFx module within the DEMOx module program The simulation model has been developed in Simulink: on the left side, there are the four boxes representing the four TSOs, and on the right the Common Activation Function. Time series were transmitted onto these lines. Time series of ACES are processed for month or weeks in 2s granularity. The signal comes from the left to the right. TSOs are in an operating point, and they have a certain response going into the marketplace, i.e. the Common Activation Function: bids are selected and passed onto to TSOs for their activation, while new bids are received to create an updated CMOL into the marketplace. As for input of models, Open loop ACE as if there is no regulation, for day week or months and with the granularity of 4 sec max. Bids can be positive to regulate upwards or negative for regulating downward. Standard execution is requested with a FAT of 5 minutes: if a generating unit can do that only on a longer time-lapse (e.g. 15 minutes), this belongs to another, in terms of flexibility less valuable category of balancing resources. A TSO can declare to be ready to accept only standard bids or it can accept also specific bids, i.e. bids that are not configured according to the standard TSO specifications for balancing products. If standard bids are the only bids accepted, the market is supported by a lower market liquidity and, even if the maximum possible amount of resources delivering aFRR participates to the market, the resulting regulating signal might not be as good as all bids were accepted. Each TSO is then characterized by two subsystems: a first part is a PI controller of each TSO, producing a setup point for the units of this TSO domestically, delivering information for a first order response by receiving a response of real units to a real set point order. The power correction signal is introduced by the Common Activation Function market unit and indicates how the open loop control should change due to the orders processed by the Common Activation Function. The second part accounts for the Imbalance netting signal in the signal processing, so to consider the correction on the control signal introduced by already existing mechanisms at EU level. It is important to notice that the model can keep under control the FutureFlow, D 7.6 Final project conference proceedings to disclose the consortium conclusions and recommendations page 24
level of imbalance netting and ensures that the minimum cost is really achieved. Additionally, some variants
for pricing have been introduced as marginal prices for zones and total, while special bids have been tested
in not all cases.

EIMV has been paying time and attention for the selection of the target model and the specific bids, because
it was clear from the very beginning that the achievement of these features would have been a key to support
testing of the possible broadest set of cases being confident of the model reliability in the background.

The CMOL which serves as database for the CAFx presents offers to the TSOs which are – as input - always
priced positively. After the activation, the FutureFlow platform regulates the cash flow associated to the
balancing energy provision by the providers: in this case output prices can be positive or negative. If the
price is negative, the balancing energy provider has been producing less and therefore pays to the
FutureFlow platform what he saves. The CMOL has been created for offers in both senses of regulation, i.e.
for upward and for downward offers and bids are jointly dealt in the same list.

The CAFx is also the place where the activation of BSP offers takes place, the systems balancing requirement
to correct the ACE is calculated every 2 s and it takes just 20 ms to find a solution for the selection of the
most appropriated offer at every refresh of the ACE correction requirement. On one side this allows to
maximize social welfare, while respecting technical limits – as the power plants technical boundaries or the
cross-zonal capacities. Accounting also for the imbalance netting when two countries are in opposite
balancing positions helps to minimize the effort to operate into the technical system boundaries. The
mathematical description has not been included in detail into the EMVI report, but it is available in the
project material dedicated to the design of the control signal modelling. Finally, it must be noted that the
underlying grid model can handle indifferently ATC or Flow-based capacity allocation methodologies.

As mentioned, another CAFx platform feature consists in its ability to handle specific and standard offers:
this can be handled via a two-layer organization, on one only standard bid are accounted, and on the other
special bids are retained. In order to make the most opportune selection between the two sets of bids at
every iteration (2 ms) it was necessary to increase the complexity of the mathematical model in the
background so to let Simulink model proceed with the optimal choice.

The issues met during the testing phase have highlighted the need for aggregators to know the business
process of their customers to be in the condition to predict unexpected fluctuations. Beyond these, other
issues were scrutinized: for instance, the settings of LF controller have also been analysed so to improve the
quality of the modelled system control signal, when power fluctuations are occurring. The set point changes
continuously but the prequalification has a much more stable signal, changes every 15 min. Measurements
from VPPs have been used to model how the average VPP will respond from the variation of set point, and
they were fed into a model that elaborated the respective response. Unfortunately, this has been dealt with
only as a test, having a response from actual DR/DGs would have been the ideal form of modelling, but data
are BSP owned so not extensively usable.

Weather forecasts are presently managed by VPP operators to build the portfolio for the bids and predict
response of their units, but they could also be integrated as input to increase the model predicting capability

  FutureFlow, D 7.6 Final project conference proceedings to disclose the consortium conclusions and recommendations   page 25
for TSOs. Having wind/solar/hydro plants and their location, it is possible to use weather data or river
hydrology to run a mixed-linear algorithm and to “pre-select” bids for the activation periods beyond the
closest upcoming one. The solution allows to solve also the energy disaggregation problem and assess what
are the consumers operate behind the meter.

EKC

EKC has been responsible for the delivery of four exploitable results.

 Testing the Model for the Common Activation Function

In this task, EKC has been supporting EIMV to ensure that the CAFx mathematic was designed so to be in the
condition to cover the general purpose aFRR target model. In particular, EKC has been delivering support
for the development of the methodological approach and the know-how base to assist the programming
teams to develop the CAFx software solution so to let it be used as a knowledge and experience database to
support similar processes across Europe and in other regions. The value of the knowledge base is justified
by the fact that every region has specific features characterizing the local balancing portfolio, which evolves
over time embedding new technologies for generation or, more in general, to respond to market price
evolutions. In case of larger time gaps between the balancing projects, applied approach and solutions
might become outdated; therefore, constant upgrades and improvements needs to be considered.

 Areas of improvement and possible alternative applications

Possible other application are difficult to find out of the transmission system business, but despite this,
interesting material can be gathered in other initiatives where TSOs are working already on the basis of
another algorithm based on the nodal network representation, supporting the fast activation of reserve not
triggered by LF controller but by the operational reserve price difference. The cross-border capacity granting
the cross-border exchange of balancing energy transits on the total reliability margin/residual available
margin and not on ATC/part of the critical lines allocated to market flows. This solution is of course for the
use of cross-border capacity to exchange flexibility at the last moment.

Before this, however, a more immediate application of the solution could consist in delivering concrete
support to the Cross-Zonal Calculation refresh. In order to make the entire FutureFlow solution adherent to
the physical reaction of the grid once the reserve is activated, the CZC should be recalculated accordingly,
so to increase the visibility of how border capacity modifies to accommodate cross-zonal flows resulting
from the balancing activation. In this respect, the CAFx can be used as a forecasting tool for CZC values, if
the CAFx is embedded into the regional security analysis so to assess the effect of all possible balancing
offers which might access the grid on the basis of an economic merit order. With the support of some
artificial intelligence, relying on an increasing historical database of bids and offers and of the correlation

  FutureFlow, D 7.6 Final project conference proceedings to disclose the consortium conclusions and recommendations   page 26
You can also read