Introducing Chorus New Zealand's largest fixed line communications infrastructure business
←
→
Page content transcription
If your browser does not render page correctly, please read the page content below

Introducing Chorus
                 New Zealand’s largest fixed line communications infrastructure business

INVESTOR ROADSHOW
9 October 2019
An overview of Chorus > New Zealand’s largest fixed line communications infrastructure business established in Dec 2011 following demerger from Telecom NZ listed on NZX and ASX:CNU ADR ticker:CHRYY ~NZ$2.2 billion market capitalisation (at 4 October 2019) S&P “BBB” stable; Moody’s “Baa2” stable > A nationwide copper and growing fibre (FTTH) network ~1.45m connections, including ~1.2m broadband 82% of way through 11-year fibre to the premises rollout 55% fibre uptake, well ahead of initial rollout target of 20% by 2020 streaming video services driving significant data consumption ~900 employees, supported by service company contractors/subcontractors 2 9 October 2019 INVESTOR ROADSHOW
3 9 October 2019 INVESTOR ROADSHOW
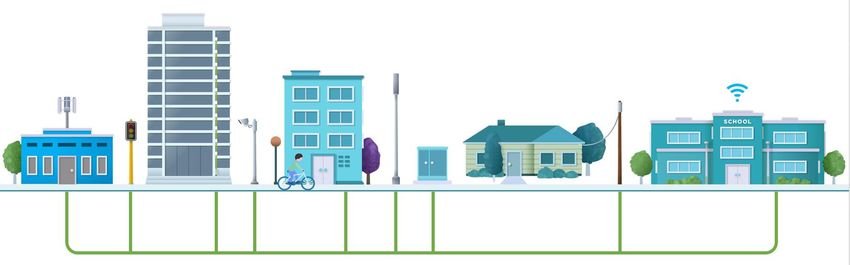
Our network infrastructure
         Copper VDSL to ~80% of lines; Fibre to pass ~1.36m end customers by end 2022
                         Offices: fibre
                         access and ‘fibre
                         to the desktop’                                                        IoT: pole and cabinet
                                                                                                assets provide coverage
Exchange co-                                 Fibre to smart     Fibre                           and power
location:                                                       backhaul: to                    infrastructure          School wi-fi trials:
                                             locations:
wireless co-                                                    mobile towers,                                          extend school network to
                                             CCTV, traffic
location and                                                    small cells                                             local students via Chorus
                                             lights
network edge                                                                                                            network
                                                                               FTTP: enabling unlimited
computing
                                                                               data, enhanced wi-fi and
                                                                               TV broadcast capability

        ~600                                                               ~12,000 cabinets                  ~290,000 poles
        exchanges

       ~52,000km fibre; ~130,000km copper cable                     ~37,000km duct network

   4    9 October 2019                                        INVESTOR ROADSHOW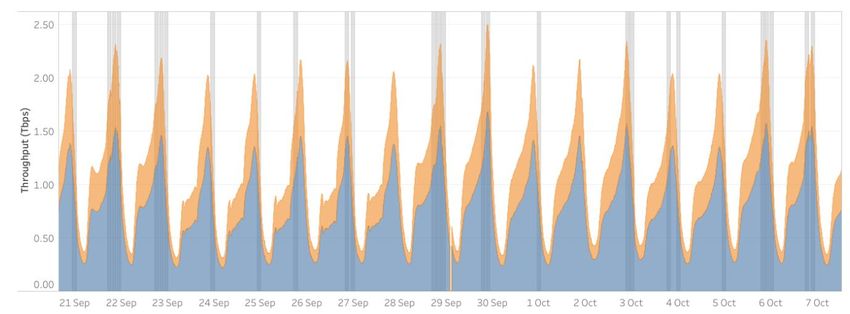
An open access wholesale network

5   9 October 2019        INVESTOR ROADSHOW
New Zealand is taking fibre further

> Ultra-fast broadband (UFB): a Government objective
  ▪ original objective (UFB1): fibre to premises covering 75% of
        population by 2020

     ▪ subsequent agreements (UFB2 and UFB2+) extended
        coverage goal to 87% of population by the end of 2022

> Chorus was awarded ~75% of the fibre rollout

     ▪ requirement that Chorus split from Telecom NZ to
        participate: demerger in December 2011

     ▪ Crown partnerships with four fibre companies: Chorus,
        Enable, Northpower, Ultrafast Fibre (WEL Networks)

6    9 October 2019                              INVESTOR ROADSHOW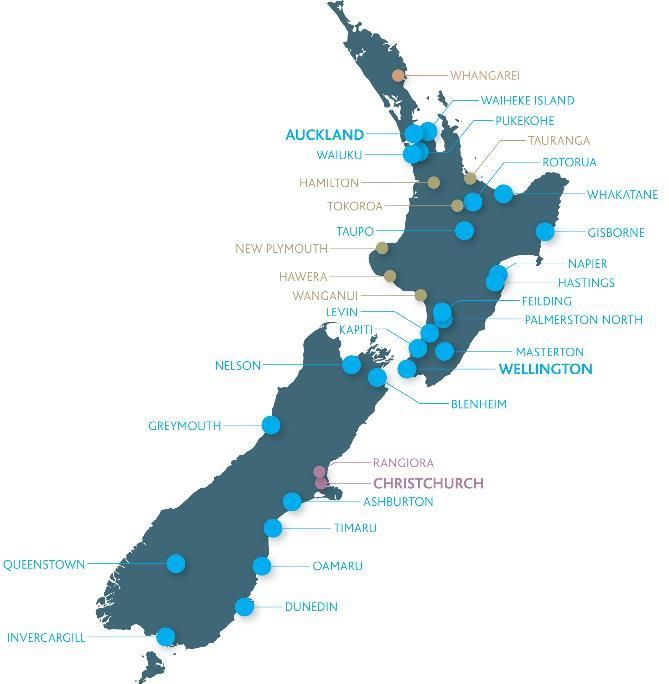
Crown funding up to $1.33 billion of rollout
                                                   Uptake

7    9 October 2019      INVESTOR ROADSHOW
UFB programme guidance and Crown securities

 Programme guidance                         Notes
 UFB1 communal       $1.75 - $1.8 billion   Tracking towards the top end of guidance
                                                                                            ▪ CIP equity securities
                                            and excludes growth (e.g. additional splitter     •   unique class of security with no right to vote at
                                            investment)                                           shareholder meetings, but entitle the holder to a
                                                                                                  right to repayment preference on liquidation
 UFB1 cost to        $1,050 - $1,250        For a standard residential connection,
 connect (CPPC)                             including layer 2 and service desk costs,         •   an increasing portion of the securities will attract
                                            and in 2011 dollars. Tracking towards the             dividend payments from 30 June 2025 onwards
                                            top half of the range.                            •   the dividend rate is based on 180 day NZ bank bill
 UFB2* communal      $505 - $565 million    Combined guidance range for UFB2 and 2+               rate, plus 6% p.a. margin
                                                                                              •   may be redeemed at any time by cash payment of
 UFB2* cost to       $1,650 - $1,850        In 2017 dollars and including layer 2,                total issue price or the issue of Chorus shares (at a
 connect                                    backbone costs for MDUs and rights of way             5% discount to the 20-day VWAP for Chorus
                                            with 10 or fewer premises and service desk            shares)
                                            costs

* combined UFB2 and 2+ rollout plans                                                        ▪ CIP debt securities
                                                                                              •   unsecured, non-interest bearing and carry no voting
                                                                                                  rights at shareholder meetings
                                                                                              •   Chorus is required to redeem the securities in
                                                                                                  tranches from 30 June 2025 to 2036 by repaying
                                                                                                  the issue price to the holder

   8    9 October 2019                                         INVESTOR ROADSHOW
UFB rollout 82% complete
Uptake
> 53,000 fibre installations completed in Q1 (Q4 FY19: 50k) Fibre installations (NZ wide)
▪ weighted average lead times reduced from 8 to 6 days 20,000
▪ work in progress stable at 23k FY18 FY19 FY20
▪ customer satisfaction increased from 7.7 to 7.8 (August) 18,000
▪ field crews stable at ~670
16,000
> UFB uptake increased from 53% to 55%
▪ 624,000 connections (30 June: 584,000) 14,000
1,133,000 customers able to connect (30 June: 1,108,000)
uptake in UFB2 areas already 29% 12,000
863,000 premises passed (30 June: 842,000) out of
1,054,000 target = 82% complete
10,000
8,000
July Aug Sept Oct Nov Dec Jan Feb Mar April May June
9 9 October 2019 INVESTOR ROADSHOW
UFB1 uptake
                                                                                                                                  ROLLOUT ONGOING

                  70.00%
                                                                Sep-18    Dec-18    Mar-19   Jun-19    Sep-19

                  60.00%
                                                                                                                                                                     55%
                                                                                                                                                                   AVERAGE
                  50.00%                                                                                                                                            UPTAKE

% uptake
                  40.00%
relative to
capable
addresses
                  30.00%

                  20.00%

                  10.00%

                   0.00%

                               Note: % uptake can reduce in areas as the fibre rollout passes more addresses in a period and greenfield subdivisions are claimed

     10       9 October 2019                                         INVESTOR ROADSHOW
Broadband: the 4th utility INVESTOR ROADSHOW 9 October 2019
Fibre now 53% of broadband connections
                                                                                       1600000
                           30 Sept       31 Dec    31 March     30 June     30 Sept
                             2018         2018         2019       2019        2019
                                                                                       1400000
Unbundled copper             45,000      39,000       31,000      24,000      21,000                Baseband copper
(no broadband)

                                                                                       1200000      Unbundled copper
Baseband copper             255,000     244,000      233,000     214,000    201,000
(no broadband)

Copper ADSL                 402,000     374,000      352,000     327,000    304,000    1000000      Copper ADSL
(includes naked)

VDSL                        309,000     295,000      283,000     270,000    257,000     800000
(includes naked)
                                                                                                     VDSL
Fibre broadband             479,000     517,000      556,000     599,000    645,000
(GPON)                                                                                  600000

Data services                 5,000        5,000       5,000       5,000       4,000
(copper)                                                                                400000

Fibre premium                12,000      12,000       12,000      11,000      12,000                 Fibre (GPON)
(P2P)                                                                                   200000
Total connections         1,507,000   1,486,000    1,472,000   1,450,000   1,444,000
                                                                                             0       Fibre premium
                                                                                           30-Sep-18       31-Dec-18   31-Mar-19   30-Jun-19   30-Sep-19
        > 1,206,000 broadband connections comprises:
          ▪ 645,000 fibre (GPON) connections
          ▪ 561,000 VDSL/ADSL (copper) connections

           12      9 October 2019                                   INVESTOR ROADSHOW
Connection changes by Zone (indicative)
Connections
(’000s) Chorus UFB Rural (non- Local Fibre
20 zone* UFB) zone Company
UFB zone
15 Total connections at 1,097,000 198,000 133,000
30 Sept**
10 Broadband connections 962,000 154,000 90,000
5 Copper (no broadband) 135,000 44,000 43,000
connections
* Includes planned UFB1, 2 and 2+ coverage
0 **Excludes 16k fibre premium and data services (copper) connections
-5
▪ premises growth, increasing broadband penetration
-10 and winback of offnet customers to fibre is fuelling
broadband demand in Chorus UFB areas
-15
▪ VDSL vectoring upgrade and premises growth helping
-20 offset wireless competition in rural areas
Q1 FY19 Q2 FY19 Q3 FY19 Q4 FY19 Q1 FY20 ▪ mobile network operators are targeting their copper
voice customers with wireless voice services across all
UFB: copper lines (no broadband) UFB: broadband lines
Zones
LFC: copper lines (no broadband) LFC: broadband lines
Rural: copper lines (no broadband) Rural: broadband lines
13 9 October 2019 INVESTOR ROADSHOWNZ market: population and premises growth
Broadband uptake by retailer (all technology) NZ broadband market – by technology
2,000,000 2,000,000
1,800,000 1,800,000
1,600,000 1,600,000
1,400,000 1,400,000
1,200,000 1,200,000
1,000,000 1,000,000
800,000 800,000
600,000 600,000
400,000 400,000
200,000 200,000
- -
Chorus xDSL Chorus mass market fibre Chorus premium fibre
Spark Vodafone Vocus 2degrees Trustpower ROM
Local fibre companies (UFB) Other fibre networks Other xDSL
Vodafone cable Fixed (mobile) wireless Legacy fixed wireless, satellite
Source: IDC Source: IDC
14 9 October 2019 INVESTOR ROADSHOWPremises growth supporting broadband uptake
96,000 dwellings forecast to be consented in Auckland (2019-2024)
▪ Auckland: new peak of ~13k dwelling unit
consents in 2018, forecast to keep growing
▪ New Zealand: average of 37,000 new dwellings
forecast per annum for the next six years
▪ New Zealand: multi-unit dwellings expected to
grow from 36% to 41% of new residential
dwellings by 2024
15 9 October 2019 INVESTOR ROADSHOWChorus UFB and rural zones
17k fibre connections in rural zone Fibre 61% of broadband in UFB zone
Rural zone broadband mix Chorus UFB zone broadband mix
160,000 1,000,000
900,000
140,000
800,000
120,000
700,000
100,000 600,000
80,000 500,000
400,000
60,000
300,000
40,000
200,000
20,000 100,000
- -
FTTP Copper broadband FTTP Copper broadband
16 9 October 2019 INVESTOR ROADSHOWActive wholesaler campaigns driving ARPU growth
Total mass market fibre uptake by plan type
100 Business/Education plans
> 46,000 mass market fibre connections added in Q1
1Gbps $60 p.m.
(vs 43k in Q4 FY19)
90
▪ 1Gbps connections grew to 69k (Q4 FY19: 58k)
200Mbps
$55 p.m.
80 and are now ~11% of mass market fibre
connections
70
▪ second tier retailers continue to grow market
60 100Mbps $46 p.m. share with some promoting 1Gbps at ~$85p.m.
% of ▪ 100Mbps connections stable at 71%
50
plans
40
30 Copper pricing
Regulated copper Line only With broadband
20 pricing (monthly) (monthly)
Current pricing $31.19 $42.02
10
50Mbps $42.50 p.m.
From mid Dec 2019 $31.68 $42.35
0
Jun-18 Sep-18 Dec-18 Mar-19 Jun-19 Sep-19
17 9 October 2019 INVESTOR ROADSHOWUnlimited data and streaming are the norm
> Growing catalogue and quality of streaming content is
Monthly average data usage driving broadband uptake and usage higher
per connection on our network
▪ 2degrees bundle with Amazon Prime
▪ Stuff launched news and content portal: play stuff
▪ Sky TV focused on streaming services: Sky Sport Now
▪ new standalone Vodafone TV device to enable online content
▪ Spark Sport showing English Premier League, Rugby World
Cup
• Rugby World Cup expected to promote uptake of smart
TV’s and introduce traditional TV viewers to streaming
• Chorus network capacity increased ~50% in FY19
18 9 October 2019 INVESTOR ROADSHOW77% increase in network traffic at peak time since June 2017
Fixed line network delivering consistent performance at peak time
Average peak time throughput on Download speed:
Chorus network Copper line vs fixed wireless
2.000 45 41.8 40.9
26% drop in
40 performance at
Tbps Mbps 35 peak time
30
24.3
25
1.000 20 18
15
9.3 9.1
10
5
0
0.000 VDSL ADSL Fixed Wireless
24-7 Peak time
Source: Commerce Commission, June 2019
Peak time = busiest daily 15 minute period
19 9 October 2019 INVESTOR ROADSHOWRugby streaming driving higher data usage
Record 2.5 Tbps peak at 9:25pm on 29 Sept coincided with Australia vs Wales
NZ vs Sth Africa NZ vs Canada NZ vs Namibia
Chorus
network
throughput
Scheduled RWC match Copper data usage Fibre data usage
20 9 October 2019 INVESTOR ROADSHOW1,000 Gigabytes per month by 2023…
Video content and 4K, 8K to drive usage growth
Application requirements in Mbps
Chorus forecast: average monthly
broadband usage (GB)
GB
1400 Copper Fibre
1200
1000
800
600
400
200
0
Source: Cisco VNI, Forecast and Trends, 2017-2022 June 2019 June 2020 June 2021 June 2022 June 2023 June 2024
21 9 October 2019 INVESTOR ROADSHOWTransition to a regulated utility INVESTOR ROADSHOW 9 October 2019
Legislation passed in November 2018

23   9 October 2019    INVESTOR ROADSHOW
Overview of current RAB implementation

     The Commerce Commission is implementing the new framework

       In May 2019, the Commerce Commission released
       an Emerging Views paper outlining its views on
       certain aspects of the input methodologies to
       apply under the new framework. Chorus and
       investors have made extensive submissions on
       issues raised by the Emerging Views paper.

       The Input Methodologies are expected to be
       finalised by mid 2020, followed by Price-Quality
       decisions in mid 2021.

24   9 October 2019                          INVESTOR ROADSHOW
Regulated Asset Base implementation
> Commerce Commission will determine the starting value of the RAB, regulatory WACC, cost allocations, expenditure
allowances and maximum allowable revenue
Building block
cost stack
25 9 October 2019 INVESTOR ROADSHOWKey RAB implementation parameters
Parameters Chorus view
Asset valuation RAB to include all assets supporting fibre access services – but likely to exclude fibre in
LFC areas. Valuation method defined by Act as actual cost incurred for post 2011 assets;
book value for pre-existing. The Commission has acknowledged real financial capital
maintenance as key principle underpinning the building block model.
Depreciation Act requires straight line depreciation for initial RAB valuation.
Allocation of shared No method prescribed in Act. The Commission will need to determine principles for cost
costs between fibre allocation for initial RAB valuation and for future periods. Precedent is accounting based
access and other cost allocation, but more complexity for telco networks given high degree of asset
services sharing and rapidly growing fibre uptake.
Unrecovered losses Act prescribes adding an asset to RAB to enable recovery of financial losses on
investment prior to implementation. The Commission has proposed using a building block
methodology.
Crown financing Act requires actual cost of Crown financing to be considered in valuing the financial
losses asset, but no method prescribed. Commission should recognise CIP financing was
not costless given contractual terms and financing structure.
WACC WACC to be set for loss calculation period and for post implementation period. Nature of
Chorus/fibre business and international comparators support WACC uplift.
26 9 October 2019 INVESTOR ROADSHOWCapital and financial
management
INVESTOR ROADSHOW
9 October 2019Capital management
> FY20 dividend guidance of 24 cps, subject to no Chorus dividend
material adverse changes in circumstances or outlook. 25
20
The Board expects to update the dividend policy once cents 15
the Commerce Commission finalises the value of our per
regulated asset base and regulated revenue for fibre, share 10
currently due in June 2021, as part of the Final Price
Quality determination. 5
Until then, the Board expects to continue to be able 0
to provide shareholders with modest dividend FY16 FY17 FY18 FY19
growth, subject to no material adverse changes in
circumstance or outlook. > The Chorus Board considers that a ‘BBB’ credit rating or
equivalent credit rating is appropriate for a company
such as Chorus. It intends to maintain capital
management and financial policies consistent with these
> A Dividend Reinvestment Plan has been available to credit ratings.
NZ and Australian resident shareholders with a 3%
discount to prevailing market price
28 9 October 2019 INVESTOR ROADSHOWDebt: ratings agencies
S&P threshold 4x ND/EBITDA Moody’s to review current 4.2x
on a sustained basis ND/EBITDA threshold in 2021
As at
30 June 2019
$m > Moody’s announced they expect to revise Chorus’
current financial leverage tolerance threshold in
Borrowings 2,361 2021, following the Commission’s final determination
+ PV of CFH debt 155 on the fibre price path for Chorus.
securities (senior) > Moody’s expect declining UFB capital spending,
+ Net leases payable 247 reducing cash outflows and execution risks, to place
Chorus’ risk profile more in line with other regulated
Sub total 2,763 utilities.
- Cash (273) > Moody’s consider Vector the most comparable rated
Total net debt 2,490 peer for Chorus, but note that Chorus’ greater
competition and technology risk suggest a tighter
Net debt/EBITDA 3.92 times leverage tolerance threshold.
Financial covenants require senior debt ratio to be
no greater than 4.75 times
29 9 October 2019 INVESTOR ROADSHOWCrown financing and debt profile
> At 30 June, debt of $2,361m comprised:
> up to $1.33 billion CIP financing ▪ Long term bank facilities of $550m undrawn;
available by 2023 (57:43 equity/debt) ▪ NZ bond: $400m and $500m
> $912m drawn at 30 June 2019 ▪ Euro Medium Term Notes $1,461m (NZ$ equivalent at hedged rates)
CIP debt securities available
AS AT 30 JUNE
800 Face value of CIP debt securities issued
drawn undrawn
700 EUR EMTN
600 NZ Bond
38.5 38.5
500 GBP EMTN
NZ
NZ 400 785
$M
$M 677
300
500 58
426 426 200 400 49
242
7 26
100
118 151
79 79
0
105
60
UFB1 UFB1 DEBT UFB2/2+ UFB2/2+
EQUITY EQUITY DEBT
30 9 October 2019 INVESTOR ROADSHOWWe’ve passed our capex peak
$810m $804m
$689m* $660 - $700m
183 231 245
> FY19: $804m gross capex
▪ below $820m - $860m range due to 550-580
reduced copper spend and fibre
connections mix 258 294 308
> FY20 guidance: $660m - $700m gross
66 95 111
capex
125 132 81 50-70
57 58 59 50-65
*FY17 capex adjusted for NZ IFRS **
FY17 FY18 FY19 FY20 GUIDANCE
**FY20 subtotals are not additive Common Copper Fibre - other Fibre - connect Fibre - communal
31 9 October 2019 INVESTOR ROADSHOWFY20 gross capex guidance
> $660m - $700m gross capex reflects: UFB rollout (premises)
160,000
Fibre $550m-$580m
140,000
$260-$280m fibre connections & layer 2
120,000
$140-$160m spend for UFB2/2+ communal
~$30m remaining for UFB1 communal (end Dec) 100,000
greenfields demand to grow; pole and transport 80,000
(UFB2) spend continues
60,000
Copper $50m-$70m 40,000
pole programme slows outside UFB areas 20,000
-
Common: $50m-$65m FY19 FY20 FY21 FY22 FY23
UFB1 Brownfields UFB2 UFB1 Greenfields
ongoing investment in IT platforms/technology
32 9 October 2019 INVESTOR ROADSHOWHow we think about capex investment
1. TYPES OF SPEND 2. NETWORK HORIZON 3. CAPITAL PRIORITISATION
CONTRACTUAL
(e.g. UFB)
SUSTAIN LFC RURAL CHORUS
(e.g. TSO, network UFB
performance)
FREE CASH FLOW
DISCRETIONARY STRATEGY
(e.g. footprint growth and
resilience, technology upgrades) PAYBACK
(REGULATORY vs
CHORUS WACC)
33 9 October 2019 INVESTOR ROADSHOWFY20 EBITDA guidance: $625m to $645m
Focus on return to modest EBITDA growth, subject to no material
changes in expected regulatory environment or competitive outlook
Costs: We expect our initiatives to result in a Revenue
continued reduction in FY20 total expenses ARPU growth as copper connections transition
to fibre and customers migrate to higher spec
transformation as we move from build to plans (e.g. 1Gbps, enhanced business plans)
operate (e.g. combining Customer Care and Network
expectation of continued broadband growth
Field Management functions) underpinned by increasing broadband
greater use of digital functionality to simplify penetration and premises growth
processes and remove legacy systems (e.g. new commercialising new revenue opportunities
billing and assure platforms)
optimising maintenance spend as customers
migrate from copper to fibre
maintaining tight control of general costs to
offset incremental spend on innovation activity,
regulatory processes, and other transformation-
related one-off costs
34 9 October 2019 INVESTOR ROADSHOWIncome statement
FY19 FY18
$m $m
Operating revenue 970 990 > Reducing copper connections, mostly offset by
fibre broadband growth
Operating expenses (334) (337) > Tight cost control
Earnings before interest, tax, 636 653
depreciation and amortisation (EBITDA)
Depreciation and amortisation (393) (387) > Growing fibre asset & copper cable depreciation
accelerated in our UFB fibre areas
Earnings before interest and income tax 243 266
Net interest expense (165) (144) > NZ$500m bond issued in Dec 2018; average
interest rate on debt now 5.75%
Net earnings before income tax 78 122
Income tax expense (25) (37)
Net earnings for the year 53 85
35 9 October 2019 INVESTOR ROADSHOWRevenue
FY19 FY18
$m $m
Fibre broadband (GPON) 294 198 > Revenue growing as fibre uptake and ARPU increases
Fibre premium (P2P) 74 78 > Customers moving from legacy services to lower priced UFB services
Copper based voice 106 133
Copper revenues declining as customers migrate to Chorus fibre or
Copper based broadband 344 421
competing fibre/wireless networks
Data services copper 18 27
Field Services 74 70 > Increased subdivision demand
Value added network 30 33
services
Infrastructure 24 23 > Commercial co-lo growth offsetting reduced copper unbundling demand
Other 6 7
Total 970 990
36 9 October 2019 INVESTOR ROADSHOWExpenses
FY19 FY18
$m $m
Labour 74 73 > CPI impact & lower capitalisation levels, partially offset by lower staff
numbers & reduced one-off restructuring costs
Provisioning 6 6
Network maintenance 75 87 > Reduction reflects technology reducing unnecessary technician visits, fibre
network performance, favourable weather, and fewer copper connections
Other network costs 33 34
IT 50 54 > New platforms enabling lower IT maintenance and support costs
Rent, rates and property 30 24 > Rateable values for network assets increasing with rollout
maintenance
Regulatory levies 16 13 > Increased funding provided for new regulatory framework
Electricity 17 15 > Higher electricity prices
Consultants 7 5 > Increase in external advice related to new regulatory framework
Insurance 3 3
Other 23 23
Total 334 337
37 9 October 2019 INVESTOR ROADSHOWReactive maintenance
Key drivers for $66m spend (FY18:$75m)
Reactive spend by type
40
▪ copper (fixed and variable) fault volumes reduced due to FY18 FY19
favourable weather in FY19 vs FY18, particularly in Auckland 30
region, and reduction in total copper connections. $m
20
▪ copper (variable) fault volumes also reduced due to fewer
copper connections and a decline in unnecessary technician 10
visits.
0
▪ long run annual saving from full copper to fibre migration in
Fibre Copper - fixed Copper -
Chorus UFB areas estimated at ~$10m p.a.
variable
▪ fibre maintenance increasing as share of connections grows,
but fault rate is lower on fibre (although costlier to fix). Copper - reactive spend by area
40
Note: 30
$m
reactive maintenance excludes spend on proactive maintenance and 20
customer networks (i.e. premises wiring, no fault found, cancellations)
‘fixed’ faults: occur in parts of the network that affect multiple customers 10
(e.g. cable between exchange and cabinet)
‘variable’ faults: only affect one customer (e.g. cable on customer property) 0
Chorus UFB Rural (Non UFB) LFC UFB
38 9 October 2019 INVESTOR ROADSHOWCapex: Fibre
FY19: 124,000 brownfields premises passed; 186,000 installations
Fibre capex FY19 FY18
$m $m
UFB communal 245 231 > includes $105m UFB2 rollout (FY18: $61m); $75m WIP (FY18: $77m)
Fibre connections & layer 2 308 294 > 186,000 installations (FY18: 156,000), including 14,000 UFB2
Fibre products & systems 17 17
Other fibre connections & growth 65 65 > included $8m UFB2 backhaul (FY18: $3m) and $10m pole replacement
Customer retention costs 29 13 > reflects incentive offers linked to fibre connection volumes
Subtotal 664 620
Cost per UFB1 premises passed (CPPP): ~$1,573 vs $1,500 - $1,600 guidance (FY18: $1,568)
Crown funding now claimed for ~33k UFB1 greenfields premises (18k in FY19) representing capex to date of
~$37m recognised in prior years ‘Other fibre connections & growth’
39 9 October 2019 INVESTOR ROADSHOWCapex: Copper and Common
Copper capex FY19 FY18 Common capex FY19 FY18
$m $m $m $m
Network sustain 44 45 Information technology 34 35
Copper connections 2 2 Building & engineering services 22 20
Copper layer 2 12 34 Other 3 3
Product 1 4 Subtotal 59 58
Customer retention costs 22 47
Subtotal 81 132 continued to invest in own IT platforms/technology
including a new standalone billing platform
network sustain reflects replacement of legacy
rural network, poles, proactive maintenance and
roadworks projects
copper layer 2: vectoring rollout completed FY18
customer retention costs reducing as demand
and retailer focus shifts to fibre
40 9 October 2019 INVESTOR ROADSHOWCapex: Fibre connections & layer 2
Connections capex of $308m vs FY19 guidance of $310-$340m
Cost per UFB1 premises connected (CPPC): $1,025* vs $1,000 - $1,150 guidance (FY18: $1,037)
* excludes layer 2 and includes standard installations, some non-standard single dwellings and service desk costs
record year for fibre installations and backbones completed
Fibre connections & layer 2 capex FY19 spend FY18 spend
Layer 2 (long run programme average of $100 per connection) $25m $32m
Premium business fibre connections $8m: 1,200 connections $11m: 1,400 connections
Single dwelling units and apartments connections $198m: 186,000 connections $163m: 156,000 connections
(FY19 estimate: 175k -195k)
Backbone build: multi-dwelling units and rights of way $77m: 16,000 completed $88m: 13,100 completed
(FY19 estimate: 19,000)
TOTAL SPEND $308m $294m
Note: we estimate ~60-65% of MDUs and RoWs requiring backbone build have been completed
41 9 October 2019 INVESTOR ROADSHOWFY20 guidance summary
FY20 guidance FY19 result
UFB1 Cost Per Premises $1,500 - $1,600 $1,573
Passed (CPPP)
UFB2* communal capex $140m - $160m $105m
(based on estimated starting premises of 65,000 to 70,000 and premises 52k premises started;
handed over of 52,000 to 70,000) 45k premises handed over
UFB1 Cost Per Premises $1,000 - $1,150 $1,025
Connected (excluding layer 2 and including standard installations and some non-
standard single dwellings and service desk costs)
(CPPC)
Fibre connections & layer 2 $260m – $280m (based on mass market 160,000 – 180,000 fibre $308m
capex connections, and 11,000 backbone builds and including service desk costs)
FY20 Gross capex $660 – $700m $804m
FY20 EBITDA $625 – 645m $636m
* combined UFB2 and 2+ rollout plans
42 9 October 2019 INVESTOR ROADSHOWChanging gear:
from build to operate
INVESTOR ROADSHOW
9 October 2019FY20: Our priorities
NEW IMAGE
regulatory outcomes that support a solid fibre utility
focus on end-to-end streamlining and simplification
invest in future capability
optimise our non-fibre business
create supplier partnerships fit for the future
commercialise new revenue opportunities
tap into broader connectivity opportunities
44 9 October 2019 INVESTOR ROADSHOWActive wholesaler
71% of Kiwis agree fibre is best
> Honing our incentives and marketing
▪ improved data and analytics
▪ promoting higher speed plans
▪ testing copper-to-fibre messaging
▪ prezzy card trial
> Chorus led installations = better
customer experience
▪ 40% connect within 6 months of installation;
60% connect after 12 months
▪ strong UFB2 response (e.g. Ohau 70%
uptake)
45 9 October 2019 INVESTOR ROADSHOWStreamlining and simplification
Accelerating our transformation programme
> Assure: new channel launched; identifying opportunities to
solve faults proactively and remotely
> Intact connections: make it easier and faster for
customers to get service switched on
> Fibre connect: keep refining our process; emphasis on
reducing reschedules and cancellations
> Property developers: manage growing premises volumes
and lift developer experience
> Complex orders: new channels for non-premises
connections
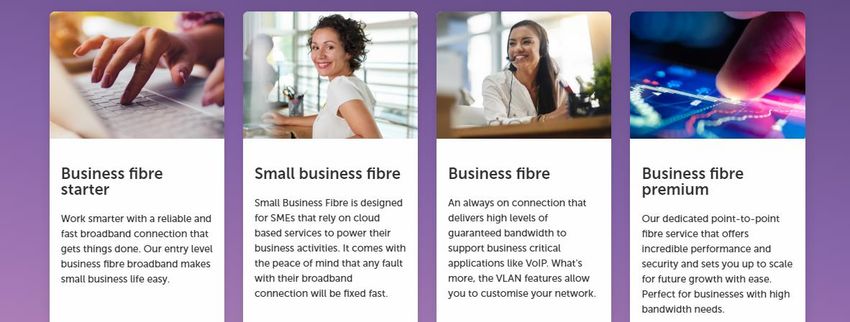
46 9 October 2019 INVESTOR ROADSHOWNew focus on business broadband segments 47 9 October 2019 INVESTOR ROADSHOW
Growing our portfolio
Moving from innovation to product phase
Edge Centre Colocation: 3 sites open for data centre
space; ~30% of space filled
Smart locations: growing demand for non-building
connections (e.g. CCTV)
10GPON: trial with retailers to identify use cases
Fibre to desktop: market identified; exploring channels
to market
Wi-Fi ONT: device being deployed as part of standard
installation; considering Wi-Fi service options
48 9 October 2019 INVESTOR ROADSHOWMaking New Zealand better
Broadband enables social and economic betterment
▪ By December 2022, our fibre network will connect more than 300 cities, towns
and communities, some with as few as 50 premises.
▪ Enhanced broadband connectivity is expected to provide substantial socio-
economic benefits, including enabling low carbon communications options and
reducing digital divides (e.g. telemedicine, fibre to schools).
▪ We expect our investment in fibre to help us achieve an 80% reduction in our
scope 1 and 2 greenhouse gas emissions, from our FY12 base year, by 2030.
▪ Our investment in FTTH is also enhancing our network resiliency for climate-
related events. We consider the potential near to medium term financial impact
of climate change effects on our business to be low.
49 9 October 2019 INVESTOR ROADSHOWTechnology evolution: fibre and 5G
Fibre 5G
Deployment Available across all major urban centres and Initially from suitable ‘macro’ towers. Requires infill sites then
connects many existing cellsites. small cell deployment (~200m radius) for optimal service.
Technology Light transmits data via fibre cable (10-100km) Fibre to cell tower/site, then radio waves to end user.
1Gbps consumer and 10Gbps business plans Speed and performance vary on each cell subject to: number
available; 2-10Gbps consumer plans in trial. of users, data usage, distance and propagation path.
Capacity Dedicated connection delivers consistent Capacity shared amongst users on each cell.
speed, unlimited data capacity, uncongested Upload speeds lower than download due to power and high
performance and very low latency. frequency challenges transmitting from mobile devices.
Spectrum Light waves provide substantial potential 3.5 GHz spectrum for 5G usage currently very limited.
bandwidth. Auction of new 3.5 GHz spectrum expected in 2020 for
Wi-Fi connects devices to fibre via free public commercial allocation in 2022.
spectrum. New Wi-Fi6 devices use 5G Auction of mmWave spectrum (26 GHz) to follow and will
technology over short distances. require new cellsites.
Cost Fibre already deployed. Existing sites likely to require strengthening. Many more sites
Low opex: no powered roadside equipment to required, with fibre backhaul.
maintain. Much higher opex than fibre: site leases and power to
roadside equipment.
50 9 October 2019 INVESTOR ROADSHOWDisclaimer This presentation: • Is provided for general information purposes and does not constitute investment advice or an offer of or invitation to purchase Chorus securities. • Includes forward-looking statements. These statements are not guarantees or predictions of future performance. They involve known and unknown risks, uncertainties and other factors, many of which are beyond Chorus’ control, and which may cause actual results to differ materially from those contained in this presentation. • Includes statements relating to past performance which should not be regarded as reliable indicators of future performance. • Is current at the date of this presentation, unless otherwise stated. Except as required by law or the NZX Main Board and ASX listing rules, Chorus is not under any obligation to update this presentation, whether as a result of new information, future events or otherwise. • Should be read in conjunction with Chorus’ audited consolidated financial statements for the year to 30 June 2019 and NZX and ASX market releases. • Includes non-GAAP financial measures such as "EBITDA”. These measures do not have a standardised meaning prescribed by GAAP and therefore may not be comparable to similar financial information presented by other entities. They should not be used in substitution for, or isolation of, Chorus' audited consolidated financial statements. We monitor EBITDA as a key performance indicator and we believe it assists investors in assessing the performance of the core operations of our business. • Has been prepared with due care and attention. However, Chorus and its directors and employees accept no liability for any errors or omissions. • Contains information from third parties Chorus believes reliable. However, no representations or warranties (express or implied) are made as to the accuracy or completeness of such information. 51 9 October 2019 INVESTOR ROADSHOW
You can also read