Succession and the Relationship between Vegetation and Soil in the Marl Quarries of the Yucatan Peninsula, Mexico - MDPI
←
→
Page content transcription
If your browser does not render page correctly, please read the page content below
Article
Succession and the Relationship between Vegetation
and Soil in the Marl Quarries of the Yucatan
Peninsula, Mexico
Mirna Valdez-Hernández 1 , Rossana Gil-Medina 1 , Jorge O. López-Martínez 1,2, *,
Nuria Torrescano-Valle 1 , Nancy Cabanillas-Terán 1,2 and Gerald A. Islebe 1
 1    El Colegio de la Frontera Sur, Avenida Centenario km 5.5, Quintana Roo, Chetumal 77014, Mexico;
      mavaldez@ecosur.mx (M.V.-H.); rossd8@gmail.com (R.G.-M.); ntorresca@ecosur.mx (N.T.-V.);
      ncabanillas@ecosur.mx (N.C.-T.); gislebe@ecosur.mx (G.A.I.)
 2    Conacyt–El Colegio de la Frontera Sur, Avenida Centenario km 5.5, Quintana Roo, Chetumal 77014, Mexico
 *    Correspondence: jorgelopez@ecosur.mx; Tel.: +52-999-127-54-02

 Received: 5 December 2018; Accepted: 29 January 2019; Published: 1 February 2019

 Abstract: Open-pit mining is a common activity in the Yucatan Peninsula for the extraction of
 limestone. These areas are characterized by the total removal of the natural vegetation cover and soil
 in order to access calcareous material. The present study shows the composition and structure of the
 vegetation in five quarries after approximately ten years of abandonment, and the target vegetation
 near to the quarries in southeastern Mexico. A linear mixed model showed that P availability is one
 of the limiting factors for species establishment in the quarries. Using a canonical correspondence
 analysis (CCA), the distribution of the species was determined in relation to the edaphic variables:
 soil depth, the percentage of organic matter (OM), cationic exchange capacity (CEC), pH and texture.
 Twenty-six families, 46 genera and 50 species were recorded in the quarries, and 25 families, 45 genera
 and 47 species were recorded in the conserved areas. The dominant species in the quarries belong to
 the families Poaceae, Fabaceae, Rubiaceae and Anacardiaceae. The quarries with higher values of
 OM (2%), CEC (24 Cmol/kg), depth (11 cm) and sand percentage (31%) include the following species
 Lysiloma latisiliquum (L.) Benth., Metopium brownei (Jacq.) Urb. and Bursera simaruba (L.) Sarg., which
 are common in secondary forests. Quarries with lower values of OM (0.4%), CEC (17 Cmol/kg)
 and depth (5.02), and with a higher percentage of silt (42%) were dominated by herbs belonging to
 Poaceae and by Borreria verticillate (L.) G. Mey., which are typical in disturbed areas of southeastern
 Mexico. In all cases, the pH was slightly alkaline due to the content of calcium carbonate (CaCO3 ),
 characteristic of the soils of the region.

 Keywords: Post-mining regeneration; limestone quarry; tropical dry forest; quarry recovery

1. Introduction
      Open-pit mining for the extraction of mineral resources is one of the most severe anthropogenic
disturbances affecting forests, involving the removal of the vegetation and modification of soil horizons
and structures, which may have significant effects on ecosystem processes. Globally, mining extraction
has been determined to cover about 1% of the earth’s surface. To restore areas degraded by mining,
it is important to compare mined areas to neighboring areas that have not been excavated [1,2].
There are few studies that evaluate the rate and characteristics of natural regeneration after mining in
southeastern Mexico. However, in other parts of the world, detailed studies on vegetation restoration
are available [3–5]. In the Yucatan Peninsula, open-pit mining is used to extract marl and marlstones.
In the state of Quintana Roo, where infrastructure development has occurred rapidly over the past few
decades, official statistics describe current and abandoned marl and marlstone quarries as occupying

Forests 2019, 10, 116; doi:10.3390/f10020116                                    www.mdpi.com/journal/forests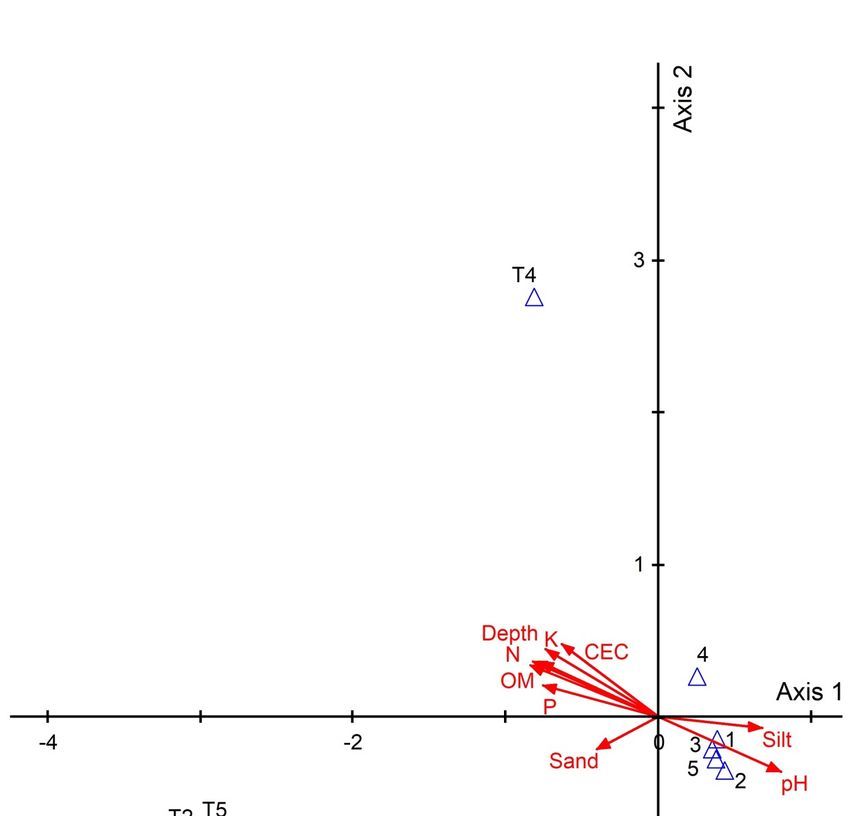
Forests 2019, 10, 116 2 of 13
7.94 km2 of the 44,566 km of the state (0.02%). It seems likely that this is an underestimate. This study
was carried out to determine the floristic composition, diversity and structure of vegetation in
abandoned quarries in Quintana Roo, as compared to neighboring target vegetation, and to understand
how these vary with soil variables, with the objective of providing insights relevant to the restoration
of these degraded areas. Dominant vegetation near the marl quarries consists of seasonally dry tropical
forest with species of Fabaceae as most conspicuous canopy trees. The seasonal dry tropical forests
of the Yucatan Peninsula are adapted to severe natural disturbances like hurricanes and fire [6,7].
Traditional agricultural practices have shaped the landscape for centuries [8].
2. Materials and Methods
2.1. Study Area
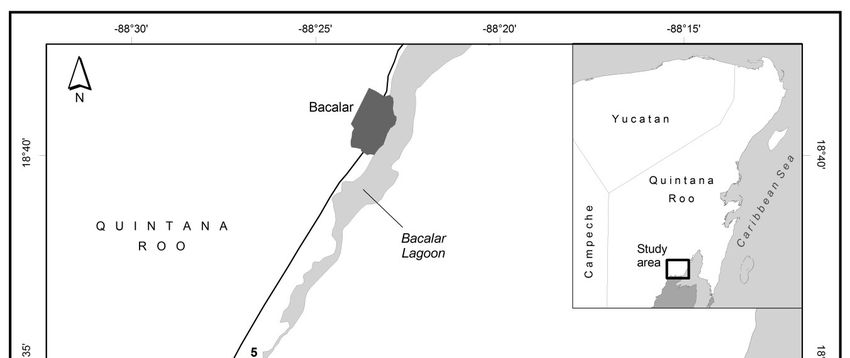
The study was carried out near Xul-Ha, municipality of Othon P. Blanco, in the southeastern part
of the state of Quintana Roo (Figure 1). The predominant vegetation is seasonal dry tropical forest [9].
However, it is common to find areas in different states of secondary succession known as acahuales,
caused by different types of natural and anthropogenic disturbances [10]. According to the Köppen
climatic classification, modified by García [11], the climate is warm subhumid with summer rain and a
dry season between January and April. The average annual precipitation fluctuates between 1100 and
1200 mm [12], and the average annual temperature recorded in the last decade is 26.5 ◦ C [13]. The type
of soil is rich in calcium carbonates (CaCO3 ), and the most common is rendzic Leptosol, followed by
Vertisols,
Forests 2019,Luvisols
10, 116 and Gleysols, which are distributed in patches in the study area [14]. 3 of 14
Figure 1.
Figure The location
1. The location of
of the
the study
study area
area and
and of
of the
the sampled
sampled quarries.
quarries.
2.2. Sampling Design
Five marl quarries were selected for the purpose of our study. Two selection criteria were
established: i) at least ten years of abandonment and ii) that they were embedded in a matrix of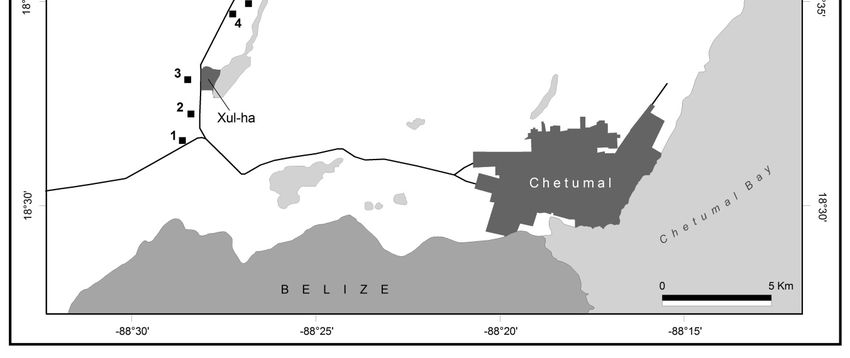
Forests 2019, 10, 116                                                                                   3 of 13

2.2. Sampling Design
      Five marl quarries were selected for the purpose of our study. Two selection criteria were
established: (i) at least ten years of abandonment and (ii) that they were embedded in a matrix of
vegetation or forest remnants, after here considered as target vegetation, and at a distance of no more
than 100 m (Table 1). The time of abandonment of the quarries was determined based on interviews
with the owners and authorities of the region. The distance between the quarries varied between
0.78–1.55 km. The target vegetation [15] was selected based on the structure of the vegetation, with a
relatively closed canopy and a height of 10 m or more.

      Table 1. The stand information of the five studied quarries. The approximate time of abandonment is
      presented in years. L = Leptosol; R = Rendzina.

               Quarry    Age (Years)     Coordinates       Soil      Soil Depth     Quarry Depth
                                       18◦  31’ 30.5” N
                   1         10                             L, R        7 cm            3–6 m
                                       –88◦ 28’ 29.5” W
                                        18◦ 32’ 10.1” N
                   2         10                             L, R        5 cm            3–6 m
                                       –88◦ 28’ 16.3” W
                                        18◦ 33’ 01.1” N
                   3         10                             L, R        8 cm             6m
                                       –88◦ 28’ 21.9” W
                                        18◦ 34’ 39.6” N
                   4         10                             L, R        11 cm           1–3 m
                                       –88◦ 27’ 12.8” W
                                        18◦ 34’ 55.0” N
                   5         10                             L, R        10 cm           1–3 m
                                       –88◦ 26’ 48.1” W

2.3. Vegetation Sampling
     In each quarry, 12 randomly distributed quadrants of 10 × 10 m (100 m2 ) were sampled.
Additionally, three target plots of 10 × 10 (100 m2 ) were established in surrounding conserved areas.
In each plot, tree layer species were identified and of all individuals, the diameter at breast height
(DBH) ≥ 1 cm was recorded. For the herb layer (height < 1 m), four subplots of 1 × 1 m (1 m2 ) were
randomly established within each plot of 100 m2 . In all plots species, the abundance, height and
diameter at breast height (DAP) were recorded. We recorded growth forms in the following categories:
trees, shrubs, herbs, palms, epiphytes, ferns and lianas.

2.4. Soil Sampling
     Four soil samples per quarry and target vegetation were taken with a soil corer at a 10 cm
depth. The four soil samples were mixed, giving one composite sample (500 g) per quarry
and target vegetation. Composite samples were analyzed following the Norma Oficial Mexicana
NOM-021-RECNAT-2000. The following components were determined: Total nitrogen (Nt, Micro
Kjeldahl method), Phosphorus (Olsen method), Potassium (K, AS-12 with ammonium acetate),
pH (water 2: 1), organic matter (MO, Walkley and Black method), cation exchange capacity
(CIC, ammonium acetate pH 7.0), and texture (Boucoucos method).

2.5. Data Analysis
     To compare the taxonomic diversity of the treatments, a rarefaction analysis (interpolation) and
extrapolation (prediction) of the Hill numbers were performed, based on sample size and coverage,
which represents a unified criterion to contrast the diversity of multiple assemblages [16]. The analysis
was carried out based on the order q (richness of species) and richness estimators were determined
with the iNEXT software package R. The relative importance value index was calculated for each
quarry, and for the functional groups IVI = relative density + relative area basal + relative frequency.
Where: relative density = (number of individuals of species/total number of individuals)*100; relative
Forests 2019, 10, 116 4 of 13
basal area = (basal area of a species/basal area of all species)*100; relative frequency = (frequency of a
species/frequency of all species)*100 [17].
An unimodal-based approach (CCA) was used after calculating gradient length with DCA,
which exceeded 3 SD [18]. The abundance was established with a transformation of Hellinger, which
minimizes the weight of rare species. The analysis was carried out with the CANOCO 4.56 package [19].
To evaluate the importance of the site on the relationship between soil variables and vegetation
variables, richness and abundance were used to calculate a mixed linear model (LMM), from the nlme
package for R developed by Laird and Ware [20]. Soil variables were established as fixed factors and
sites as random variables.
3. Results
3.1. Floristic Composition
We recorded 8372 individuals, belonging to 37 families, 71 genera and 77 species. The species can
be distributed in three growth forms: trees, herbs and lianas (Table 2). The family with the highest
species richness was Poaceae with 10 species, followed by Fabaceae with 8 species, Euphorbiaceae with
5 species, and Rubiaceae and Sapotaceae with 4 species. Those families contributed 31% of all botanical
families. The remaining 69% was distributed among 28 families, 7 with two species and 21 with one
species. Within the trees, the most important families were Fabaceae with 8 species, Sapotaceae with
4 and Anacardiaceae with 3, followed by Arecaceae and Euphorbiaceae. The rest of the families (15)
were represented by a single species. In the herb layer, the most important families were Poaceae
with 10 species, Asteraceae and Euphorbiaceae with 3 species, and Cyperaceae and Rubiaceae with
2. The 12 remaining species were represented by a single species. Lianas were represented by five
families, Convolvulaceae with 2 species and Apocynaceae, Bignoniaceae, Passifloraceae, Rubiaceae
with 1 species (Table 2).
Quarry 5 had the most species with 45 species, followed by quarry 3 with 37 species. Quarries 2
and 1 had 36 and 35 species and Quarry 4 had the lowest species richness with 34. Trees represented
52% of the total species sampled with 40 species, followed by herbs and lianas that represented
41 and 8% with 32 and 6 species, respectively (Table 2). The highest abundance was recorded
in the quarry 2 (2505 individuals), followed by 5 (1722 individuals), 4 (1378 individuals) and 3
and 1 (874 and 870 individuals, respectively). Herbs were the most abundant growth form with
7045 individuals, representing 84% of the total abundance. Quarries 2 and 5 had the highest proportion
of herb abundance, representing 58% of the total (2513 and 1540 individuals, respectively). The trees
represented 14% of the total abundance of the community, being more abundant in the quarries 5 and 4
(378 and 359 individuals, respectively). Finally, the lianas were the least abundant with 171 individuals
distributed as follows: 5 (52), 3 (51), 2 (27), 4 (22) and 1 (19). Higher species richness was observed in
the quarries (50) than in the target vegetation (47). The difference is statistically significant because the
intervals do not overlap (Table 3). The species richness of the trees was higher in the target vegetation
(34) than in the quarries (19). Herbs presented a higher richness of species in the quarries than in the
target vegetation. Lianas did not show significant differences (Table 3).Forests 2019, 10, 116 5 of 13
Table 2. The list of species sampled in all quarries and target vegetation, indicating their growth form
(GF, T = tree, H = herb, F = fern, E = epiphyte, S = shrub, P = palm; L = liana). 1–5 = marl quarries;
T = target vegetation.
Family Species GF 1 2 3 4 5 T
Astronium graveolens Jacq. T * *
Anacardiaceae Metopium brownei (Jacq.) Urb. T * * * * * *
Spondias mombin L. T * *
Anemiaceae Anemia adiantifolia (L.) Sw. F * * *
Annonaceae Malmea depressa (Baill.) R.E. Fr. T * * *
Echites tuxtlensis Standl. L * *
Apocynaceae Echites yucatanensis Millsp. ex. Standl. L * *
Thevetia peruviana (Pers.) K. Schum. T * * * * * *
Araliaceae Dendropanax arboreus (L.) Decne. and Planch. S * *
Acoelorraphe wrightii (Griseb. and H. Wendl.) H. Wendl. ex Becc. P * *
Arecaceae
Sabal mexicana Mart. P * * *
Calea jamaicensis (L.) L. S * * *
Asteraceae Melanthera sp. Rohr H *
Viguiera dentata (Cav.). Spreng. H * * * * * *
Arrabidaea sp.DC. L * *
Bignoniaceae
Cydista potosina (K. Schum. and Loes.) Loes. H * * * * *
Bromeliaceae Bromelia sp. L. E *
Burseraceae Bursera simaruba (L.) Sarg. T * *
Cannabaceae Trema micrantha (L.) Blume S *
Celastraceae Hippocratea volubilis L. T *
Ipomoea batatas (Choisy) Griseb. H *
Convolvulaceae
Ipomoea sp. L. H * *
Fimbristylis sp. Vahl H *
Cyperaceae
Scleria sp. P.J. Bergius H *
Ebenaceae Diospyros salicifolia Humb. and Bonpl. ex. Willd. T * * * * *
Cnidoscolus multilobus (Pax) I.M. Johnst. T * * *
Croton sp. L. T * * * *
Euphorbiaceae Euphorbia dioica Kunth H * *
Euphorbia sp. L. H *
Jatropha gaumeri Greenm. T * * * *
Acacia collinsi Saff. T * * * *
Bauhinia divaricata Lam. T * * * * *
Caesalpinia gaumeri Greenm. T * * *
Lonchocarpus xuul Lundell T * * * *
Fabaceae
Lysiloma latisiliquum (L.) Benth. T * * * * *
Mimosa bahamensis Benth. T * *
Piscidia piscipula (L.) Sarg. T * * * *
Senna sp. Mill. T * * * *
Ocimum micranthum Willd. H *
Lamiaceae
Vitex gaumeri Greenm. T * * * * * *
Lygodiaceae Lygodium venustum Sw. F * *
Malpighiaceae Byrsonima crassifolia (L.) Kunth T * * * * * *
Malvaceae Waltheria indica L. H * * * *
Brosimum alicastum Sw. T * *
Moraceae
Ficus pertusa L. f. T *
Muntingiaceae Muntingia calabura L. T *
Myrtaceae Eugenia capuli (Schltdl. and Cham.) Hook. and Arn. S * *
Orchidiaceae Bletia purpurea (Lam.) DC. H *
Passifloraceae Passiflora sp. L. L * * * *
Piper auritum Kunth T * *
Piperaceae
Piper neesianum C. DC. T * *
Bothriochloa pertusa (L.) A. Camus H *
Chloris inflata Link H * * * * *
Cynodon dactylon (L.) Pers H *
Dichanthium aristatum (Pior.) C.E. Hubb. H * *
Digitaria ciliaris (Retz.) Koeler H * *
Poaceae
Eragrostis ciliaris (L.) R. Br. H *
Eragrostis secundiflora J. Presl H *
Ichnanthus lanceolatus Scribn. and J.G. Sm. H * * * * * *
Paspalum blodgettii Champ. H * * * * *
Paspalum sp. L. H * * * *
Coccoloba cozumelensis Hemsl. T, S * * * * * *
Polygonaceae
Gymnopodium floribundum Rolfe T * * * *
Alseis yucatanensis Standl. T * *
Borreria verticillata (L.) G. Mey. H * * * * *
Rubiaceae
Bouvardia ternifolia (Cav.) Schltdlt. H * * *
Morinda yucatanensis Greenm. H * * * *
Cupania dentata DC. T * * * *
Sapindaceae
Talisia floresii Standl. T * *Forests 2019, 10, 116 6 of 13
Table 2. Cont.
Family Species GF 1 2 3 4 5 T
Chrysophyllum mexicanum Brandegee ex Standl. T * * * * *
Manilkara zapota (L.) P. Royen T * *
Sapotaceae
Pouteria campechiana (Kunth) Baehni T * * * * * *
Pouteria reticulata (Engl.) Eyma T * * * * *
Simaroubaceae Simarouba glauca DC. T * * * * *
Urticaceae Cecropia peltata L. T * * *
Verbenaceae Stachytarpheta frantzii Pol. H *
Zamiaceae Zamia prasina W. Bull H * * *
Table 3. The growth form diversity estimates of the studied quarries and target vegetation.
Growth form n S. obs m qD qD.LCL qD.UCL SC SC.LCL SC.UCL
Quarry 7349 50 1023 39.34 37.43 41.24 0.99 0.99 1
Target forest 1023 47 1023 47 44.1 49.9 1 0.99 1
Trees 437 19 68 12.69 11.8 13.58 0.94 0.92 0.95
Quarry Herbs 6842 27 68 11.64 11.35 11.92 0.93 0.93 0.94
Lianas 70 5 68 5 3.57 6.43 0.99 0.96 1
Trees 719 34 80 21.82 20.7 22.93 0.91 0.9 0.92
Target forest Herbs 203 9 80 7.65 6.57 8.73 0.98 0.97 0.99
Lianas 101 4 80 3.99 3.69 4.28 1 0.99 1
n = number of individuals, S.obs = number of recorded species, m = sample size for which diversity estimates
of order q was compared, qD = the estimated diversity of order q for a sample of size m, SC = the estimated
sample coverage for a sample of size m, qD.LCL, qD.UCL = the bootstrap lower and upper confidence limits for
the diversity of order q at the specified level in the setting (with a default value of 0.95), SC.LCL, SC.UCL = the
bootstrap lower and upper confidence limits for the expected sample coverage at the specified level in the setting
(with a default value of 0.95).
3.2. Vegetation Structure
The herb layer in the quarries was represented mainly by species of the family Rubiaceae and
Poaceae with the highest IVI values. Borreria verticillata was the dominant species in the quarries 1,
2, 3 and 5, and E. ciliaris at 4 (Table 4). The herb layer of the target vegetation was dominated by the
species Cydista potosina at T1, T2, T3 and T5. Viguiera dentata and Bouvardia ternifolia were the most
dominant species of T4 [17].
The canopy layer of the quarries is dominated by Metopium brownei in quarry 1, A. collinsii in 2,
Caesalpinia gaumeri in 3, Coccoloba cozumelensis with Lysiloma latisiliquum in 5, and L. latisiliquum in 4
(Table 4). The canopy layer of the target vegetation showed a wider distribution in the dominance
of species, among which are L. latisiliquum, Vitex gaumeri, Alseis yucatanensis, Bursera simaruba,
Pouteria campechiana, Diospyros salicifolia, among others (Table 4).
The structure of diametric classes in the quarries and in the target vegetation showed an inverted
j pattern, in which the largest number of individuals was concentrated in the youngest categories
(Figure 2b). Of the 438 individuals measured in the quarries, 75% are in the first diametric class (1–5 cm),
and decreases considerably in the second class (5–10 cm), including only 13% of the individuals; the
other four categories had 13%. Similar to the quarries, in the target vegetation, the individuals are
concentrated in the smaller classes, grouping 84% of the individuals in the first two classes; while 17%
was distributed in the four largest classes.
Species richness is mainly determined by phosphorus (P), and is found in higher concentrations
in soils of target vegetation (Table 5, Linear mixed model). CEC also determined species using LMM,
and both variables were positively related. Species abundance within sites was only significant with P
(LMM, Table 5).Forests 2019, 10, 116 7 of 13
Table 4. The Importance Value Index (IVI) in the quarries and target vegetation.
Quarry Target Vegetation
Herb layer 1 2 3 4 5 T1 T2 T3 T4 T5
Cydista potosina - - - - - 146 180 216 - 110
Borreria verticillata 108 118 117 41 143 - - - - -
Ichnanthus lanceolatus - - - - - 58 75 45 75 79
Eragrostis secundiflora - 47 42 109 - - - - - -
Paspalum blodgettii 35 39 - 44 47 - - - - -
Paspalum sp. 47 17 72 - - - - - - -
Arrabidaea sp. - - - - - 62 - - - 42
Viguiera dentata - - - - - - - - 79 -
Morinda yucatanensis - - 22 - 13 - - - - 43
Bouvardia ternifolia - - - - - - - - 76 -
Chloris inflata - - - 24 50 - - - - -
Digitaria ciliaris 49 - - - - - - - - -
Passiflora sp. - - - - - - 22 - 22 -
Cnidoscolus multilobus - - - - - - - 39 - -
Dendropanax arboreus - - - - - - 22 - - -
Zamia prasina - - - - - 21 - - - -
Tree layer 1 2 3 4 5 T1 T2 T3 T4 T5
Lysiloma latisiliquum - - - 143 122 61 101 - 83 -
Metopium brownei 193 - 64 64 23 - - - 38 -
Acacia collinsi - 300 - - - - - - - -
Caesalpinia gaumeri - - 189 - - - - - - -
Vitex gaumeri - - - 25 - - 44 52 - 58
Coccoloba cozumelensis - - 23 - 59 - - - - 47
Bursera simaruba 34 - - - - 40 17 - 23 -
Byrsonima crassifolia 39 - 24 18 - - - - - -
Pouteria reticulata - - - - - 34 - - 24 -
Alseis yucatanensis - - - - - - - 48 - -
Croton reflexifoluis - - - - - - 19 - - 28
Mimosa bahamensis 34 - - - 11 - - - - -
Pouteria campechiana - - - - - - - 45 - -
Diospyros salicifolia - - - - - 41 - - - -
Jatropha gaumeri - - - - - - - - - 25
Piper neesiariuum - - - - - - - 21 - -
The density was higher (F = 6.0492, p = 0.002) in the quarries (31.7 ind./m2 ± 7.5) than in the target vegetation (5.5
ind./m2 ± 2.5, Figure 2a). Quarry 2 presented the highest value of density (54.16 ind./m2 ± 9.3), while quarries
1 and 3 obtained the lowest values (18.9 and 16.9 ind./m2 respectively). The target vegetation with the highest
density was T4 with (14.2 ind./m2 ± 8.9) and the lowest density was T3 (2.3 ind./m2 ± 0.8).Piper neesiariuum - - - - - - - 21 - -
The density was higher (F = 6.0492, p = 0.002) in the quarries (31.7 ind./m2 ± 7.5) than in the target
vegetation (5.5 ind./m2 ± 2.5, Figure 2a). Quarry 2 presented the highest value of density (54.16 ind./m2
± 9.3), while quarries 1 and 3 obtained the lowest values (18.9 and 16.9 ind./m2 respectively). The target
vegetation with the highest density was T4 with (14.2 ind./m2 ± 8.9) and the lowest density was T3
Forests 2019, 10, 1162 8 of 13
(2.3 ind./m ± 0.8).
60
a
50
40
Density (ind/m2)
30
20
10
0
1 2 3 4 5
450
b
400
350
Frequency (individuals)
300
Quarry Target
250
200
150
100
50
0
1-5 5 - 10 10 - 15 15 - 20 20 - 25 > 25
Figure 2: (a)
Figure 2. (a) The
The average
average density
density of
of individuals
individuals in
in each
each quarry
quarry and
and target
target vegetation.
vegetation. (b)
(b) Distribution
Distribution
in diametric classes of quarries (n = 438) and target vegetation (n = 706).
in diametric classes of quarries (n = 438) and target vegetation (n = 706).
Table 5. The results of the linear mixed model (LMM), relating species richness and abundance with
The structure of diametric classes in the quarries and in the target vegetation showed an inverted
soil variables (* = p < 0.05).
j pattern, in which the largest number of individuals was concentrated in the youngest categories
(Figure 2b). Of theSoil
438Variables
individuals measured
Value in theStd.Error
quarries, 75%DFare in the first diametric
t-value class (1–5
p-value
cm), and decreases considerably
P in the second
2.16146 class (5–10 cm),
0.59018 including
12 only 13%
3.662346 of the individuals;
0.0033 *
MO −1.07686 3.89338 12 −0.276587 0.7868
N −2.75591 79.88714 12 −0.034498 0.973
Richness
K −0.00476 0.00889 12 −0.535487 0.6021
CEC 0.53992 0.14274 12 3.782563 0.0026 *
pH 3.64087 3.36148 12 1.083114 0.3
P 18.326 6.2714 12 2.9221351 0.0128 *
MO 16.6783 41.4912 12 0.4019714 0.6948
N −378.4637 851.7639 12 −0.4443294 0.6647
Abundance
K −0.0465 0.0945 12 −0.4923956 0.6313
CEC 2.5481 1.5194 12 1.6770404 0.1194
pH 59.8267 35.8774 12 1.6675331 0.1213Forests 2019, 10, 116 9 of 13
The canonical correspondence analysis (CCA) explained 60% of the total variance, with an
eigenvalue of 0.89 for the first axis and 0.61 for the second axis, representing 36% and 25% of the total
variance, respectively. The first axis is determined by the increase in the concentration of organic
matter (OM), CEC, and percentage of sand. The second axis is determined by the increase in silt
and pH (Figure 3). In Figure 3, the plots sampled in the quarries and target vegetation are presented.
Most plots of the target vegetation (T1, T2, T3, T5) are grouped in the lower left; except for target
vegetation 4 (T4) located in the upper left, which was characterized by showing the highest content
of MO, nitrogen (N), phosphorus (P) and potassium (K). Regarding the plots of the quarries, most of
the plots (1, 2, 3, 5) are grouped in the central part of the biplot; except 4, which presented better soil
conditions given its distribution on axis 2. In general, it was observed that the quarries presented a soil
Forests 2019, 10, 116 10 of 14
with a slightly alkaline pH, unlike the target vegetation with a neutral pH and a higher percentage
of silt.
Figure 3. Canonical Correspondence Analysis (CCA) biplot of plots and soil variables. T = target
Figure 3: Canonical Correspondence Analysis (CCA) biplot of plots and soil variables. T = target
vegetation, 1–5 quarries. Depth refers to the soil depths of plots, OM = organic material, N = nitrogen,
vegetation, 1–5 quarries. Depth refers to the soil depths of plots, OM = organic material, N = nitrogen,
P = phosphorus, K = potassium,
P = phosphorus, CEC
K = potassium, CEC==cation exchangecapacity.
cation exchange capacity.
4. Discussion
Marl quarries and target vegetation presented a similar number of species (50 and 47,
respectively), but a different composition. In the herb layer of the quarries, the species belonging to
Poaceae, Asteraceae and Rubiaceae, were those that presented higher density. Poaceae, RubiaceaeForests 2019, 10, 116 10 of 13
4. Discussion
Marl quarries and target vegetation presented a similar number of species (50 and 47, respectively),
but a different composition. In the herb layer of the quarries, the species belonging to Poaceae,
Asteraceae and Rubiaceae, were those that presented higher density. Poaceae, Rubiaceae and Fabaceae,
presented the highest values of IVI in the quarries, which are characterized by presenting species
capable of establishing themselves in areas of early regeneration. This has also been observed in other
regions [21]. Those families have been reported in the early stages of succession of the region [22], and
are being common in areas that have suffered some levels of disturbance.
Dominant tree species of the quarries and target vegetation are L. latisiliquum, M. brownei,
Byrsonima crassifolia. Those species are characteristic of the secondary forests of the region [10,22] and
establish mainly by seeds after hurricanes, fires and traditional agricultural activities. Generally, those
species can develop both in shallow soils, typical of quarries, and deep soils with good drainage [23].
In contrast, the conserved areas showed a dominance of species such as L. latisiliquum, V. gaumeri,
C. cozumelensis, M. brownei, P. piscipula, Piper auritum, P. neesianum, Croton reflexifoluis, Spondias mombin,
P. campechiana, which have been identified as species with relatively high dominance values, and
are present in different successional conditions of dry tropical forests [24,25] of southeastern Mexico.
Most of those tree species present re-sprouting in contrast to L. latisiliquum and therefore appear earlier.
Growth forms showed clear differences between the quarries and the target vegetation (Table 3).
Trees showed the greatest species richness in the target vegetation, contrary to herbs that clearly
dominated the quarry areas. This clearly agrees with that reported in previous studies in tropical
forests [26–28]. Finally, lianas did not show significant differences between the target vegetation
and the quarries (4 and 5, respectively, Table 3). However, the abundance was higher in the target
vegetation. This may be related to the availability of larger trees in the target vegetation, which offer
more availability of structural support [26,29] contrary to the vegetation structure of the degraded sites.
The high number of individuals in smaller diameter classes, present in the quarries, indicate the
juveniles individuals in a successional state of less than 15 years [30], as 95% of the total individuals do
not exceed 15 cm of DAP (Figure 2b). The species that presented the highest number of individuals in
the five diametric classes were L. latisiliquum and M. brownei, which are found mainly in quarries 4 and
5, supporting the evidence that these quarries are in an advanced successional state compared to the
other quarries. In addition, the presence of these deciduous species probably helps the accumulation
of MO and hence, to an improvement of edaphic conditions.
Based on the results of the CCA, species groups present in the target vegetation and the species
present in the quarries can be identified (Figure 3). The quarry species are characterized by species of
early successional stages, which decrease as the process of succession progresses and are replaced by
species of late succession [31]. The species present in the target vegetation are grouped on the right side
of the graph, where the depth of the soil is greater than in the quarries, favoring the accumulation of
organic matter. Some of the species present in these areas, such as B. simaruba and Byrsonima crassifolia
are deciduous, which promote the constant accumulation of organic matter. Likewise, the species that
are colonizing part of the marl quarries such as L. latisiliquum, M. brownei and B. simaruba, are located
between the group of species from the quarries and those of the target vegetation, which shows that
these species are capable of developing both in shallow soils and in deeper soils [23].
In the ordination graph (Figure 3), the sample plots of quarry 4 are distributed towards the
right side of the graph, where the values of soil properties approximate those of the conserved areas.
The conditions of the substrate clearly affect the distribution and abundance of the species [24].
The variation of silt and sand in the quarries and target vegetation, indicates that, at higher levels
of silt, the successional process develops slowly. Soils with high percentages of silt have a lower
drainage than sandy soils [32]. This may lead to partially flooding, during the wet season, and favors
formation of superficial crusts that prevent the emergence of tree seedlings [33]. The LMM identified
P as a significant limiting factor in vegetation recovery in the quarries (Table 5). From previous
studies of dry tropical forests of the Yucatan Peninsula, P was known as limiting factor of forestForests 2019, 10, 116 11 of 13
regeneration [34,35]. Establishment of tree seedlings was also driven by P availability [34], hence the
complete removal of the soils regulates tree seedling colonization in the quarries.
This work shows the high tolerance to stress conditions of certain species such as Paspalum
sp., Eragrostis secundiflora, Chloris inflata, Borreria verticillata, Calea jamaicensis, Metopium brownei,
Caesalpinia gaumeri and Lysiloma latisiliquum, being the most dominant in the quarries. It shows
the slow recovery of vegetation, explained by the total loss of soil. The effect of total soil removal,
the consequent edaphic conditions that occur in the quarries, such as a slightly alkaline pH, lower
percentage of OM, lower CIC, higher percentage of silt and lower percentage of sand, are ecologically
significant, as they present a clear correlation with the distribution of the species, and with the
characteristics of the structure of the vegetation.
5. Conclusions
One of the main consequences of marl quarries in the Yucatan Peninsula is the total loss of soil,
modifying edaphic conditions and, therefore creating unfavorable conditions for species to recolonize
areas formerly covered by dry tropical forest. Common species in marl quarries are Borreria verticillata
and Eragrostis secundiflora. These species develop in soils with a high percentage of silt and with a
slightly alkaline pH, unlike the typical species of dry forests, which grow on soils with an acidic pH
and a higher percentage of sand. A linear mixed model showed that P availability is one of the limiting
factors for species establishment in the quarries.
The quarries were dominated by herbs. However, there are some tree species that have a wide
range of tolerance to different edaphic conditions, such as Lysiloma latisiliquum and Metopium brownei,
and both can be found in quarries and surrounding dry tropical forests.
Although the diversity values obtained in the quarries and the target vegetation are not statistically
significant, a higher complexity can be observed in the target vegetation. These differences in the
development and distribution of the species, as well as in the structure of the plant communities of the
quarries and the target vegetation are strongly correlated with the edaphic conditions. Studies from
Central Europe [5] have concluded that spontaneous vegetation succession is adequate for ecosystem
restoration. Our study supports this view, if nearby natural vegetation remnants are available,
spontaneous vegetation recovery is possible.
Under this view, it is important to carry out studies focused on the successional development
in the quarries of the Yucatan Peninsula in order to have a better understanding of the response of
the species to this type of disturbances. With this information, it will be possible to apply adequate
management plans, restoration and conservation of these areas.
Author Contributions: Conceptualization, M.V.-H. and G.A.I.; Formal analysis, M.V.-H., R.G.-M., J.O.L.-M. and
G.A.I.; Methodology, R.G.-M.; Writing—original draft, M.V.-H., R.G.-M., J.O.L.-M. and G.A.I.; Writing—review &
editing, N.T.-V. and N.C.-T.
Funding: Conacyt funded RGM under grant number 573900.
Acknowledgments: Juan Javier Ortiz Díaz is acknowledged for taxonomic identification of Poaceae. Oscar
Verduzco Salazar, Jorge Palomo Kumul and Holger Weissenberger are acknowledged for help during fieldwork.
Holger Weissenberger elaborated Figure 1.
Conflicts of Interest: The authors declare no conflict of interest.
References
1. Baasch, A.; Kirmer, A.; Tischew, S. Nine years of vegetation development in a postmining site: Effects of
spontaneous and assisted site recovery. J. Appl. Ecol. 2011, 49, 251–260. [CrossRef]
2. Kirmer, A.; Tischew, S.; Ozinga, W.A.; von Lampe, M.; Baasch, A.; van Groenendael, J.M. Importance
of regional species pools and functional traits in colonization processes: Predicting re-colonization after
large-scale destruction of ecosystems. J. Appl. Ecol. 2008, 45, 1523–1530. [CrossRef]
3. Boscutti, F.; Vianello, A.; Bozzato, F.; Casolo, V. Vegetation structure, species life span, and exotic status
elucidate plant succession in a limestone quarry reclamation. Restor. Ecol. 2017, 25, 595–604. [CrossRef]Forests 2019, 10, 116 12 of 13
4. Prach, K.; Hobbs, R.J. Spontaneous Succession versus Technical Reclamation in the Restoration of Disturbed
Sites. Restor. Ecol. 2008, 16, 363–366. [CrossRef]
5. Prach, K.; Řehounková, K.; Lencová, K.; Jírová, A.; Konvalinková, P.; Mudrák, O.; Študent, V.; Vaněček, Z.;
Tichý, L.; Petřík, P.; et al. Vegetation succession in restoration of disturbed sites in Central Europe: The
direction of succession and species richness across 19 seres. Appl. Veg. Sci. 2014, 17, 193–200. [CrossRef]
6. Sanchez, O.; Islebe, G. Hurricane Gilbert and structure changes in a tropical forest in south-eastern Mexico.
Glob. Ecol. Biogeogr. 1999, 8, 29–38. [CrossRef]
7. Whigham, D.F.; Olmsted, I.; Cano, E.C.; Harmon, M.E. The Impact of Hurricane Gilbert on Trees, Litterfall,
and Woody Debris in a Dry Tropical Forest in the Northeastern Yucatan Peninsula. Biotropica 1991, 23,
434–441. [CrossRef]
8. Islebe, G.A.; Sánchez-Sánchez, O.; Valdéz-Hernández, M.; Weissenberger, H. Distribution of Vegetation Types.
In Biodiversity and Conservation of the Yucatán Peninsula; Islebe, G.A., Calmé, S., León-Cortés, J.L., Schmook, B.,
Eds.; Springer International Publishing: Cham, Switzerland, 2015; pp. 39–53. ISBN 9783319065298.
9. Miranda, F.; Hernández-X, E. Los tipos de vegetación de México y su clasificación. Sociedad Botánica Méx
1963, 28, 29–179. [CrossRef]
10. Sánchez-Sánchez, O.; Islebe, G.A. Tropical forest communities in southeastern Mexico. Plant Ecol. 2002, 158,
183–200. [CrossRef]
11. García, E. Modificaciones al Sistema de Clasificación Climática de Köppen; Serie Libros; Instituto de Geografía,
Universidad Nacional Autónoma de México: Mexico City, Mexico, 2004; Volume 6, ISBN 9789703210107.
12. Instituto Nacional de Estadística y Geografía (INEGI). Mapa digital de México V6.3.0. Available online:
http://www.beta.inegi.org.mx (accessed on 5 December 2018).
13. Espinoza-Ávalos, J.; Islebe, G.A.; Hernández-Arana, H.A. El sistema ecológico de la Bahía de Chetumal/Corozal:
Costa occidental del Mar Caribe; El Colegio de la Frontera Sur: Chetumal, Mexico, 2009; ISBN 9786077637134.
14. Torrescano-Valle, N.; Folan, W.J. Physical Settings, Environmental History with an Outlook on Global Change.
In Biodiversity and Conservation of the Yucatán Peninsula; Islebe, G.A., Calmé, S., León-Cortés, J.L., Schmook, B.,
Eds.; Springer International Publishing: Cham, Switzerland, 2015; pp. 9–37. ISBN 9783319065298.
15. Society for Ecological Restoration International Science & Policy Working Group the SER International Primer on
Ecological Restoration; Society for Ecological Restoration International: Tucson, AZ, USA, 2004.
16. Hsieh, T.C.; Ma, K.H.; Chao, A. iNEXT: An R package for rarefaction and extrapolation of species diversity
(Hill numbers). Methods Ecol. Evol. 2016, 7, 1451–1456. [CrossRef]
17. Müller-Dombois, D.; Ellenberg, H. Aims and Methods of Vegetation Science; Wiley: New York, NY, USA, 1974.
18. ter Braak, C.J.F.; Smilauer, P. CANOCO Reference Manual and CanoDraw for Windows User’s Guide: Software for
Canonical Community Ordination (Version 4.5); Microcomputer Power: Ithaca, NY, USA, 2002.
19. Lepš, J.; Šmilauer, P. Using the CANOCO for Windows 4.5 package. In Multivariate Analysis of Ecological Data
Using CANOCO; Cambridge University Press: Cambridge, UK, 2003; pp. 43–59.
20. Pinheiro, J.; Bates, D.; DebRoy, S.; Sarkar, D.; R Core Team. nlme: Linear and Nonlinear Mixed Effects. Available
online: https://cran.r-project.org/web/packages/nlme/citation.html (accessed on 5 December 2018).
21. Alday, J.G.; Pallavicini, Y.; Marrs, R.H.; Martínez-Ruiz, C. Functional groups and dispersal strategies as
guides for predicting vegetation dynamics on reclaimed mines. Plant Ecol. 2011, 212, 1759–1775. [CrossRef]
22. Valdez-Hernández, M.; Sánchez, O.; Islebe, G.A.; Snook, L.K.; Negreros-Castillo, P. Recovery and early
succession after experimental disturbance in a seasonally dry tropical forest in Mexico. For. Ecol. Manag.
2014, 334, 331–343. [CrossRef]
23. Pennington, T.D.; Sarukhán, J. Árboles Tropicales de México. Manual Para la Identificación de las Principales
Especies; Universidad Nacional Autónoma de México: Mexico City, Mexico, 2005; ISBN 9789681678555.
24. White, D.A.; Hood, C.S. Vegetation patterns and environmental gradients in tropical dry forests of the
northern Yucatan Peninsula. J. Veg. Sci. 2004, 15, 151–160. [CrossRef]
25. Williams-Linera, G.; Alvarez-Aquino, C.; Hernández-Ascención, E.; Toledo, M. Early successional sites and
the recovery of vegetation structure and tree species of the tropical dry forest in Veracruz, Mexico. New For.
2011, 42, 131–148. [CrossRef]
26. López-Martínez, J.O.; Sanaphre-Villanueva, L.; Dupuy, J.M.; Hernández-Stefanoni, J.L.; Meave, J.A.;
Gallardo-Cruz, J.A. β-Diversity of Functional Groups of Woody Plants in a Tropical Dry Forest in Yucatan.
PLoS ONE 2013, 8, e73660. [CrossRef] [PubMed]Forests 2019, 10, 116 13 of 13
27. Guariguata, M.R.; Ostertag, R. Neotropical secondary forest succession: Changes in structural and functional
characteristics. For. Ecol. Manag. 2001, 148, 185–206. [CrossRef]
28. Chazdon, R.L. Tropical forest recovery: Legacies of human impact and natural disturbances. Perspect. Plant
Ecol. Evol. Syst. 2003, 6, 51–71. [CrossRef]
29. Madeira, B.; Espírito-Santo, M.; Neto, S.; Nunes, Y.; Arturo Sánchez Azofeifa, G.; Wilson Fernandes, G.;
Quesada, M. Changes in tree and liana communities along a successional gradient in a tropical dry forest in
south-eastern Brazil. Plant Ecol. 2009, 201, 291–304. [CrossRef]
30. Cortés-Castelán, J.C.; Islebe, G.A. Influencia de factores ambientales en la distribución de especies arbóreas
en las selvas del sureste de México. Rev. Biol. Trop. 2005, 53, 115–133.
31. Uhl, C. Factors Controlling Succession Following Slash-and-Burn Agriculture in Amazonia. J. Ecol. 1987, 75,
377–407. [CrossRef]
32. Organization for Economic Cooperation and Development; Food and Agriculture Organization of the
United Nations. OECD-FAO Agricultural Outlook 2007; Food & Agriculture Organization: Rome, Italy, 2007;
ISBN 9789264025097.
33. Gisbert, J.; Ibáñez, S.; Moreno, H. La textura de un suelo. Available online: http://hdl.handle.net/10251/7775
(accessed on 5 December 2018).
34. Ceccon, E.; Huante, P.; Campo, J. Effects of nitrogen and phosphorus fertilization on the survival and
recruitment of seedlings of dominant tree species in two abandoned tropical dry forests in Yucatán, Mexico.
For. Ecol. Manag. 2003, 182, 387–402. [CrossRef]
35. Eaton, J.M.; Lawrence, D. Woody debris stocks and fluxes during succession in a dry tropical forest.
For. Ecol. Manag. 2006, 232, 46–55. [CrossRef]
© 2019 by the authors. Licensee MDPI, Basel, Switzerland. This article is an open access
article distributed under the terms and conditions of the Creative Commons Attribution
(CC BY) license (http://creativecommons.org/licenses/by/4.0/).You can also read