Physico-Chemical, Mineralogical, and Chemical Characterisation of Cretaceous-Paleogene/Neogene Kaolins within Eastern Dahomey and Niger Delta ...
←
→
Page content transcription
If your browser does not render page correctly, please read the page content below
minerals
Article
Physico-Chemical, Mineralogical, and Chemical
Characterisation of Cretaceous–Paleogene/Neogene
Kaolins within Eastern Dahomey and Niger Delta
Basins from Nigeria: Possible Industrial Applications
Olaonipekun Oyebanjo 1,2, *, Georges-Ivo Ekosse 2           and John Odiyo 3
 1   Natural History Museum, Obafemi Awolowo University, Ile-Ife 220282, Osun State, Nigeria
 2   Directorate of Research and Innovation, University of Venda, P/Bag X5050, Thohoyandou 0950, South Africa;
     ekosseg@gmail.com
 3   School of Environmental Sciences, University of Venda, P/Bag X5050, Thohoyandou 0950, South Africa;
     john.odiyo@univen.ac.za
 *   Correspondence: oladayo2004@yahoo.com

 Received: 17 June 2020; Accepted: 15 July 2020; Published: 28 July 2020

 Abstract: The demand for kaolinitic clays for various industrial applications is increasing globally.
 The present study evaluated the potential industrial applications of kaolins from the Eastern Dahomey
 and Niger Delta Basins, Nigeria. The colour, pH, electrical conductivity (EC), particle size distribution
 (PSD), plastic limits and liquid limits of the kaolins were determined. Mineralogical properties were
 assessed using X-ray diffractometry (XRD), scanning electron microscopy (SEM), and differential
 thermal analysis (DTA). The chemical compositions of the kaolins were determined using X-ray
 fluorescence spectrometry (XRF). The kaolins were generally acidic, with pH less than 7 with low EC.
 The moderate plasticity indices (PI ≥ 10%) for the kaolins suggested their potential use in the
 manufacturing of structural clay products without extrusion. Kaolinite was the only kaolin mineral
 present with anhedral–subhedral–euhedral crystals. The platy morphology of the kaolinites in the
 Cretaceous kaolins are very important in paper production. Other minerals present in the kaolins
 were quartz, muscovite, anatase and goethite. The major oxide contents of the kaolins were dominated
 by SiO2 , Al2 O3 , Fe2 O3 and TiO2 . Based on chemical specifications, the raw kaolins are not suitable
 for most industrial applications except for the Cretaceous Lakiri kaolins in the paper and ceramic
 industries (except for TiO2 and K2 O content). The study concluded that the kaolin deposits would
 require beneficiation for large-scale industrial applications.

 Keywords: kaolinite; applications; plasticity; morphology; major oxides

1. Introduction
     Large kaolin deposits of primary and secondary origins with enormous reserves have been
identified across Nigeria [1,2]. Known kaolin deposits of Cretaceous and Paleogene/Neogene ages
occur within the sedimentary basins, which are believed to be filled with Cretaceous–Recent sediments
except for some Paleogene/Neogene kaolin occurring within the Jos Plateau in areas underlain by the
younger granites [3]. Several kaolin deposits in the world are mined and processed for industrial uses.
These include the Cretaceous–Paleogene/Neogene Georgia and South Carolina sedimentary kaolins
in United States of America, which have been explored since the 1750s [4], the Cornwall and Devon
kaolins in Southwestern England, which are believed to be the world’s largest and highest grade
primary kaolin deposits, and the Jari and Capim Rivers Paleogene/Neogene sedimentary kaolins in the
Amazon region of Northern Brazil [5].

Minerals 2020, 10, 670; doi:10.3390/min10080670                                 www.mdpi.com/journal/minerals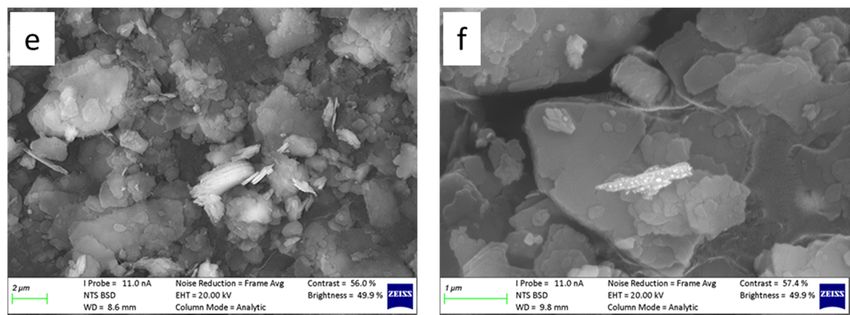
Minerals 2020, 10, 670                                                                                 2 of 16

     The kaolin (Al2 Si2 O5 (OH)4 ) group consisting of minerals such as kaolinite, dickite, nacrite and
halloysite is important and widely used for various industrial applications. Global applications of
kaolins are largely in the manufacturing of paper, ceramics, paints and coatings among others. Kaolins
are in high demand in coating papers due to the rise in the use of paper products as an alternative to
non-biodegradable products. In addition, the traditional use of kaolins in ceramic production has risen
sharply globally in the manufacturing of ceramic tiles because of the increase in construction activities
with growing urbanisation and population. This also increased its usage in the production of cements.
High-purity kaolins are also useful as natural cosmetics and applied in pharmaceutics [5,6]. The global
kaolin market was put at $5.8 billion with China as the leading importer worldwide (with $2.6 billion
import value) in 2018 [7]. The physical and chemical characteristics of kaolin determine its ultimate
application. Some of these characteristics are dependent on the geological origin, environment of
formation and method of processing [8].
     Kaolin is an important industrial mineral which has played a very important role in the economic
and technological development of many industrialised nations [5]. The demand for kaolin which is
also referred to as “white gold” in the world market consistently continues to increase [2]. In 2018,
the annual demand and local production of kaolins in Nigeria were estimated at about 360,000 tonnes
and 125,000 tonnes, respectively. The deficit of about 235,000 tonnes were imported [9]. One of the
factors responsible for this deficit is the non-availability of large kaolin deposits that are relatively pure
and commercially usable [5]. The proper evaluation and characterisation of some of the nation’s kaolin
deposits are inevitable in meeting the growing local and global demands [7]. This will further boost
the nation’s economy in terms of its gross domestic product (GDP) and foreign exchange earnings.
Hence, this study aimed at assessing the potential applications of some Cretaceous–Paleogene/Neogene
kaolins from Eastern Dahomey and Niger Delta Basins in Nigeria based on their physico-chemical,
mineralogical and chemical characteristics.

2. Materials and Methods

2.1. Study Areas
     The Cretaceous (Lakiri and Eruku) and Paleogene/Neogene (Ubulu-Uku and Awo-Omama) kaolin
deposits are exposed within the Abeokuta Group and Ogwashi-Asaba Formation of the Eastern
Dahomey and Niger Delta Basins, respectively (Figure 1 and Table 1). The Lakiri kaolin deposit
outcrops within the Lakiri village in Obafemi-Owode local government area (LGA) of Ogun State.
The kaolin is dominantly purple to creamy-white with thicknesses up to 5 m with no distinct horizon
and overburden up to 2 m (Figure 2). The deposit is quite extensive beyond the study site with
estimated thickness based on geoelectrical vertical sounding (VES) varying from 0.4 m to 17 m [10].
The Eruku kaolin deposit outcrops within the Eruku village in Ado-Odo LGA of Ogun State. The
deposit is generally reddish yellow with a height of about 5 m and more than 35 m wide with
overburden top sandy soil of 1.5 m (Figure 2). The Ubulu-Uku kaolin outcrops along Agokun River
near Anioma village, east of Agbor, Delta State. It extends for more than 2.5 km and thickness varies
from 10 m to 40 m with an estimated reserve of more than 15.5 × 10⁶ metric tonnes [11]. It is overlain
by a brown-reddish ferricretic layer from which iron is leached by percolating water, giving rise to a
purplish colour at the contact zone between the base of the ferricretic layer and the upper horizon
of the kaolin deposit (Figure 2). The Awo-Omama kaolin deposit outcrops along the western wall of
the Njiagba river valley near Awo-Omama village in the Orlu LGA of Imo State. Exposures of this
deposit are also known to occur along the Onitsha–Owerri road (about 5 km south of the main outcrop
and quarry site). The deposit grades downwards from creamy-white to purplish-yellow at the base
(Figure 2). The deposit is embedded within a friable cross-bedded sandstone deposit with herringbone
structures at some spots. Large sub-angular to rounded pebbles were also found within the sandstone.
Based on VES, the estimated thickness of the deposit varied from 30 m to 90 m with an estimated
reserve of 3.92 × 10⁶ metric tonnes [11].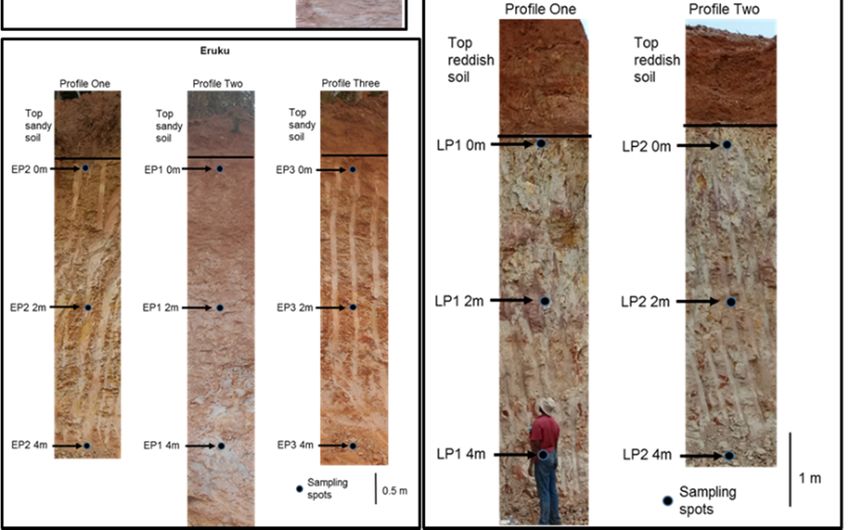
Minerals 2020, 10, 670                                                                                                                   3 of 16

Minerals 2020, 10, x FOR PEER REVIEW                                                                                                     3 of 16

        Figure 1.
       Figure  1. Geologic
                  Geologic Maps
                            Maps ofof (a)
                                      (a) Eastern
                                          Eastern Dahomey
                                                  Dahomey and
                                                          and (b)
                                                              (b) Niger
                                                                  Niger Delta
                                                                        Delta Basins
                                                                              Basins showing
                                                                                     showing the
                                                                                              the study
                                                                                                  study areas
                                                                                                        areas
        (modifiedafter
       (modified   after[12,13]).
                         [12,13]).

                                Table1.1. Summary
                                Table     Summary details
                                                  details of
                                                          of the
                                                              the studied
                                                                   studiedkaolin
                                                                          kaolindeposits.
                                                                                 deposits.
    S/N        Basin           Formation                   1                    Deposit
  S/N        Basin          Formation                 Age 1
                                                      Age                         Deposit Coordinates
                                                                                              Coordinates Number of Samples
                                                                                                            Number   of Samples
                                                                                            7◦ 100 20” N   9 samples9 from
                                                                                                                       samples    fromat3
                                                                                                                             3 profiles
               Eastern         Abeokuta             Cretaceous                 Eruku (EP)    3◦ 157°10′20″
                                                                                                    0 0” E
                                                                                                           N     2 mprofiles
                                                                                                                        intervalsat 2 m
       1
              Dahomey           Group         (Valanginian–Barremian)          Lakiri (LP)   7◦ 50 21” N   6 samples from 2 profiles at
            Eastern         Abeokuta         Cretaceous (Valanginian–             Eruku (EP) ◦ 0 3°15′0″ E                intervals
   1                                                                                        3 27 26” E           2 m intervals
           Dahomey           Group                  Barremian)                    Lakiri (LP)        7°5′21″ N           6 samples from 2
                                                                           Awo-Omama            5◦ 390 23” N    6 samples from 2 profiles at
                                                                                                       3°27′26″ E         profiles at 2 m
                                                 Paleogene/Neogene            (AL)               6◦ 560 4” E          1 m intervals
       2      Niger Delta    Ogwashi-Asaba                                                                                   intervals
                                                (Oligocene–Miocene)        Ubulu-Uku             6◦ 240 0” N    7 samples from  2 profiles at
                                                                              (UL)              6◦ 250 18” E          1m6 samples
                                                                                                                           intervals from 2
                                                                                   Awo-
                                                           1 —[13,14].                               5°39′23″ N           profiles at 1 m
                                                                                  Omama
                            Ogwashi-            Paleogene/Neogene                                     6°56′4″ E              intervals
   2       Niger Delta                                                             (AL)
                             Asaba             (Oligocene–Miocene)                                    6°24′0″ N          7 samples from 2
                                                                                 Ubulu-Uku
                                                                                                     6°25′18″ E           profiles at 1 m
                                                                                   (UL)
                                                                                                                             intervals
                                                               1   —[13,14].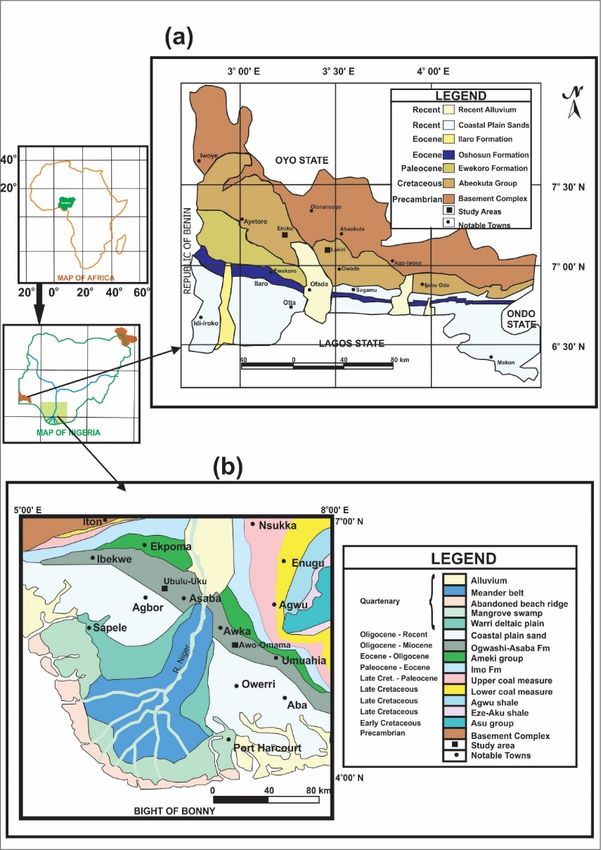
Minerals 2020, 10, 670                                                                                           4 of 16
Minerals 2020, 10, x FOR PEER REVIEW                                                                             4 of 16

       Figure 2.
      Figure   2. Vertical
                  Vertical profiles
                           profilesshowing
                                    showingsampling
                                           samplingdepths
                                                    depthsand
                                                          andlithologic
                                                              lithologicunits
                                                                        unitsof
                                                                              of the
                                                                                 the studied
                                                                                     studied kaolin
                                                                                             kaolin deposits
                                                                                                    deposits
       (after [12]).
      (after [12]).

2.2.
2.2. Sampling
     Sampling
       Two
       Two profiles
             profiles were
                       were sampled
                             sampled forfor each
                                              each kaolin
                                                     kaolin deposit
                                                              deposit (except
                                                                       (except for
                                                                               for Eruku
                                                                                   Eruku with
                                                                                            with three
                                                                                                  three profiles)
                                                                                                         profiles) at
                                                                                                                   at
intervals   with 28 kaolin  samples   obtained    (Table  1, Figure 2).  Composite  samples   (obtained
 intervals with 28 kaolin samples obtained (Table 1, Figure 2). Composite samples (obtained by mixing     by mixing
all
 allthe
      thesamples
           samplesfrom  eacheach
                      from   kaolinkaolin
                                     profileprofile
                                               into oneinto
                                                         homogenous      sample) were
                                                               one homogenous          used for
                                                                                    sample)      the determination
                                                                                               were   used for the
of  Atterberg limits,
 determination         giving a total
                  of Atterberg        of 9giving
                                 limits,    samples    (oneofsample
                                                   a total          per kaolin
                                                               9 samples        profile).per
                                                                          (one sample     The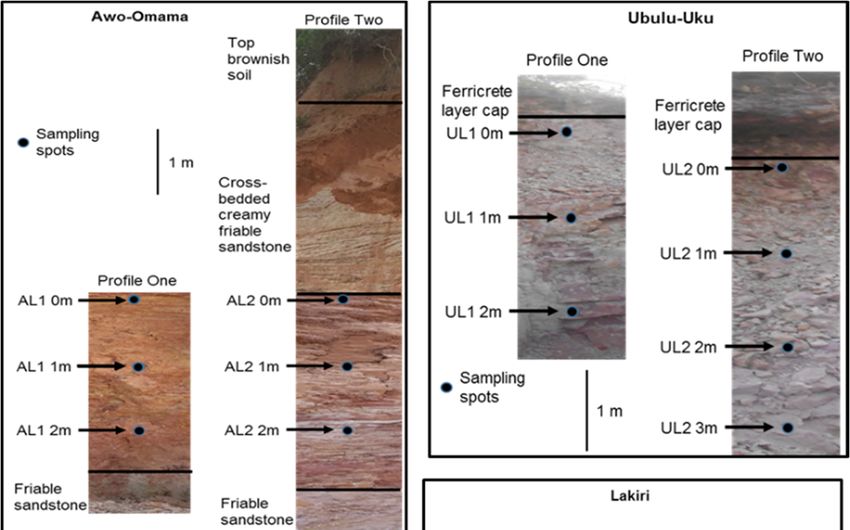
Minerals 2020, 10, 670                                                                               5 of 16

                      ´ 4.36 Å,
were observed at 7.13 Å,     ´ 4.16 Å´ and 3.57 Å;
                                                ´ whereas peaks at 4.25 Å
                                                                        ´ and 3.34 Å
                                                                                   ´ were assigned
                                  ´ 4.15 Å,
to quartz. Peaks observed at 3.51 Å,      ´ 2.71 Å ´ and 10.01 Å
                                                               ´ were assigned to anatase, goethite,
hematite, and muscovite, respectively. The weight percentages of the mineral phases were obtained
using the Rietveld method at XRD Analytical and Consulting cc, Pretoria.
      The morphological analyses of the samples were carried out using a Zeiss MERLIN field-emission
scanning electron microscope (Carl Zeiss, Jena, Germany) at the Central Analytical Facilities (CAF),
Stellenbosch University (SU), SA. The SDT Q600 thermogravimetric analysis and differential scanning
calorimetry (TGA-DSC) analyser in the Department of Chemistry, University of Johannesburg (UJ) in
Johannesburg, South Africa, was used for the thermal analysis. Ten milligram (10 mg) of the samples
were heated from 25 ◦ C to 1100 ◦ C, at a rate of 10 ◦ C /min [19]. Major element compositions of the
bulk kaolin samples were determined by X-ray fluorescence (XRF) spectrometry on a PANalytical
Axios Wavelength Dispersive spectrometer (Malvern Panalytical Ltd., Malvern, UK) at the CAF,
SU, SA. The machine is equipped with a 2.4 kW Rh anode X-ray tube and linked to a SuperQ
PANalytical software.

3. Results

3.1. Physico-Chemical Characteristics

3.1.1. Colour
     The percentage colour distribution for the Cretaceous kaolins was dominated by light and
pinkish grey, followed by light pink, reddish yellow and pale red, and pinkish white; whereas the
Paleogene/Neogene kaolins were dominated by pale red followed by pinkish grey, reddish brown and
light brown (Table 2 and Figure 3).

      Table 2. Colour, pH, electrical conductivity (EC), and particle size distribution of the studied
      Cretaceous–Paleogene/Neogene kaolins.

                                                                            EC      Clay    Silt   Sand
           Age            Deposit    Sample ID       Colour        pH
                                                                          (µm/cm)   (%)     (%)     (%)
        Cretaceous         Eruku        EP1 0 m     Light pink     4.56    5.00      58     13      29
                                          2m        Light pink     4.80    0.70      60      3      37
                                          4m        Light grey     4.74    1.20      90     6        4
                                        EP2 0 m   Reddish yellow   4.73    8.10      60      8      32
                                          2m       Pinkish grey    4.70    2.20      66      5      29
                                          4m      Reddish yellow   4.68    0.70      74      7      19
                                        EP3 0 m    Pinkish grey    4.87    0.60      55      6      39
                                          2m       Pinkish grey    4.27    0.20      63     14      23
                                          4m        Light grey     4.50    3.30      78     7       15
                           Lakiri       LP1 0 m   Pinkish white    5.21    2.20      68     12      20
                                          2m         Pale red      4.70    8.40      78      4      18
                                          4m      Pinkish grey     4.73    2.90      85     10       5
                                        LP2 0 m      Pale red      4.78    9.10      76     12      12
                                          2m        Light grey     4.94    0.50      79     7       14
                                          4m        Light grey     4.35    1.10      84     9        7
    Paleogene/Neogene    Awo-Omama      AL1 0 m      Pale red      4.63    0.30      60      7      33
                                         1m          Pale red      4.88    13.1      58     10      32
                                         2m          Pale red      4.68    4.30      55     12      33
                                        AL2 0 m      Pale red      4.69    0.20      56      4      40
                                         1m        Pinkish grey    4.92    1.50      64      5      31
                                         2m          Pale red      4.96    0.40      68      4      28
                         Ubulu-Uku      UL1 0 m      Pale red      4.50    1.10      68      8      24
                                         1m        Light brown     4.62    1.30      73     9       18
                                         2m          Pale red      4.27    4.40      64      3      33
                                        UL2 0 m      Pale red      4.84    0.70      68      1      31
                                         1m        Pinkish grey    5.29    3.90      68      8      24
                                         2m          Pale red      5.15    9.70      43     11      46
                                         3m       Reddish brown    4.70    1.10      60     8       32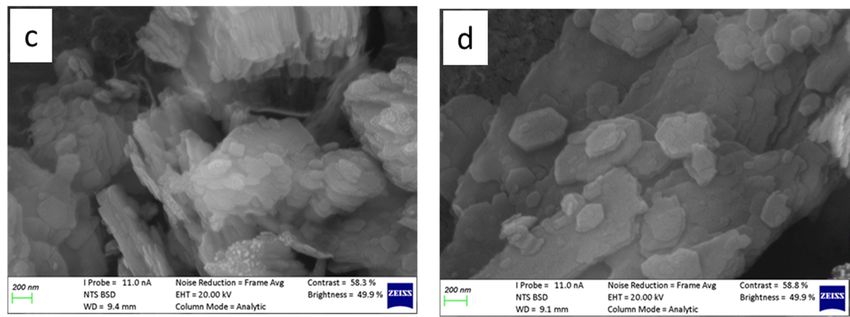
Minerals 2020, 10, 670                                                                                     6 of 16
Minerals 2020, 10, x FOR PEER REVIEW                                                                       6 of 16

         Figure 3. Colour
                   Colour distribution
                          distribution of the studied kaolins: (a)
                                                               (a) Cretaceous
                                                                   Cretaceous and
                                                                              and (b)
                                                                                  (b) Paleogene/Neogene.

3.1.2. Hydrogen
3.1.2. Hydrogen Ion
                Ion Concentration
                    Concentration (pH)
                                  (pH) and
                                       and Electrical
                                           Electrical Conductivity
                                                      Conductivity (EC)
                                                                   (EC)
     The pH
     The   pH values
               values of
                      of the
                         the studied
                             studied kaolins
                                      kaolins were
                                              were generally
                                                   generally acidic
                                                             acidic with values  8.0  µS/cm)
(Table
(Table 2).
       2).
3.1.3. Particle Size Distribution
3.1.3. Particle Size Distribution
      The analysed samples showed wide variations in the particle size (Table 2) with clay fraction
     The analysed samples showed wide variations in the particle size (Table 2) with clay fraction (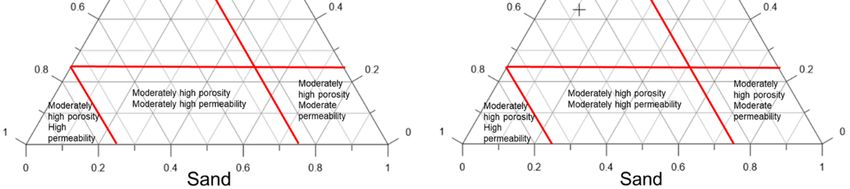
Minerals 2020, 10, 670                                                                                       7 of 16

Minerals 2020, 10, x FOR PEER REVIEW                                                                         7 of 16
minerals present; whereas quartz was the only primary mineral present in the Paleogene/Neogene
kaolins. The main secondary
Paleogene/Neogene    kaolins. minerals
                              The maininsecondary
                                           the Cretaceous  andin
                                                     minerals  Paleogene/Neogene  kaolins
                                                                 the Cretaceous and       were kaolinite,
                                                                                    Paleogene/Neogene
anatase were
kaolins  and goethite (Table
              kaolinite,     4, Figure
                         anatase       4).
                                 and goethite   (Table 4, Figure 4).

      Table 4. Mineral composition, thermal peak temperatures, and total weight losses for the studied
      Table 4. Mineral composition, thermal peak temperatures, and total weight losses for the studied
      Cretaceous–Paleogene/Neogene kaolins.
      Cretaceous–Paleogene/Neogene kaolins.
           Age
          Age                      XRD (wt%)
                              XRD (wt%)                            DTA DTA
                              Kao Qtz Ana    Hem Mus Goe Dht (°C) Dht        MFt (°C)
                                                                                    MFt TWL TWL(%)
                                   Kao   Qtz Ana Hem Mus           Goe
    Cretaceous      Average    83     21   1   -     5       1     511     (◦ C)     ◦
                                                                               981.9( C) 13.6(%)
      (n  = 15)
       Cretaceous    MaxAverage99   8357   2
                                          21   -1    9-      15    517
                                                                    1       511985 981.9 14.4
                                                                                            13.6
         (n = 15)    Min Max 49     991    1
                                          57  tr2    1-      19    488
                                                                    1       517980 985     13.1
                                                                                            14.4
Paleogene/Neogene AverageMin 62     4937  11   -1     -tr    11     1
                                                                   505      488964.3 980    13.1
                                                                                           12.2
      (n = 13)
  Paleogene/Neogene  MaxAverage93   6274   1
                                          37   -1     --     1-    514
                                                                    1       505970 964.3 13.8
                                                                                            12.2
         (n = 13)    Min Max 25     936    1
                                          74   -1     --     1-    500
                                                                    1       514951 970     10.7
                                                                                            13.8
      Kao—kaolinite; Qtz—quartz;
                          Min Ana—       6 Hem—
                                 25anatase;     1 hematite;
                                                        -   Mus- —muscovite;
                                                                    1         Goe—951
                                                                            500             10.7
                                                                                     goethite;
      Dhy —dehydroxylation
      Kao—kaolinite;          temperature;
                       Qtz—quartz;          MFt—mullite
                                       Ana—anatase;       formation temperature;
                                                        Hem—hematite;            TWL—totalGoe—goethite;
                                                                          Mus—muscovite;      weight loss;
      Dhy—dehydroxylation
      tr                    temperature; MFt—mullite formation temperature; TWL—total weight loss; tr—trace;
         —trace; (-)—not detected.
      (-)—not detected.

      Figure 4. X-ray
                X-ray diffractograms
                      diffractograms of the profiles of the studied kaolin deposits with the highest kaolinite
      contents showing kaolinite (k), quartz (q), muscovite (m), anatase
                                                                  anatase (a),
                                                                           (a), and
                                                                                and goethite
                                                                                    goethite (g).
                                                                                             (g).

3.2.2. Kaolinite Thermal Evolution
    The endothermic (dehydroxylation) and exothermic (mullite formation) temperature peaks
were between 488–517 °C and 980–985 °C, 500–514 °C and 951–970 °C for Cretaceous and
Paleogene/Neogene kaolins, respectively (Table 4, Figure 5). The reactions were accompanied with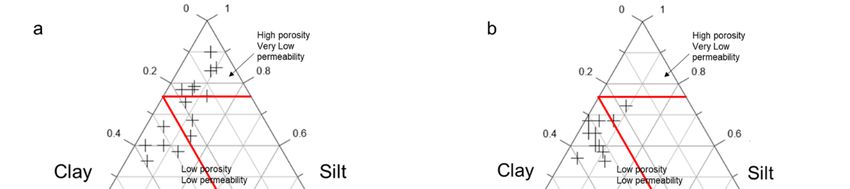
Minerals 2020, 10, 670 8 of 16
3.2.2. Kaolinite Thermal Evolution
The10,
Minerals 2020, endothermic
x FOR PEER (dehydroxylation)
REVIEW and exothermic (mullite formation) temperature peaks were8 of 16
between 488–517 ◦ C and 980–985 ◦ C, 500–514 ◦ C and 951–970 ◦ C for Cretaceous and Paleogene/Neogene
totalkaolins,
weight respectively
losses ranging from
(Table 13.1–14.4%
4, Figure and
5). The 10.7–13.8%
reactions for Cretaceous
were accompanied and
with Paleogene/Neogene
total weight losses
ranging
kaolins, from 13.1–14.4% and 10.7–13.8% for Cretaceous and Paleogene/Neogene kaolins, respectively.
respectively.
Figure
Figure Representative thermogravimetric
5. 5.Representative thermogravimetric analysis and differential
analysis scanning calorimetry
and differential scanning(TGA/DSC)
calorimetry
curves of the samples of the studied kaolin deposits with the highest kaolinite contents.
(TGA/DSC) curves of the samples of the studied kaolin deposits with the highest kaolinite contents.
3.2.3. Kaolinite Morphology
3.2.3. Kaolinite Morphology
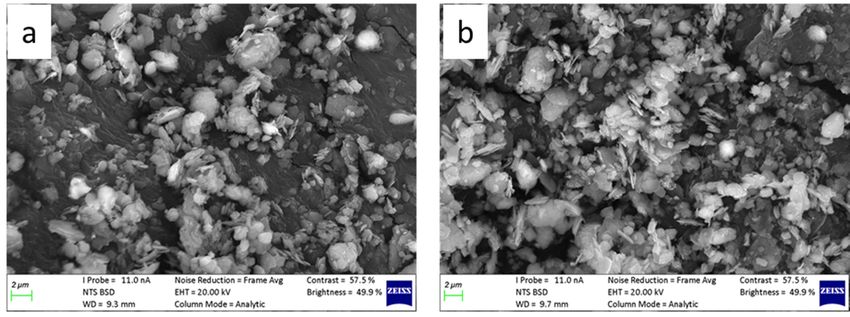
The SEM images displayed the various morphologies and textures of the studied
The SEM images displayed the
Cretaceous–Paleogene/Neogene various
kaolins morphologies
(Figure and textures
6). The Cretaceous kaolins,ofcomprised
the studied Cretaceous–
of thin platy
Paleogene/Neogene kaolins
kaolinite particles with (Figure
no stacks 6). The
(Figure 6a,b),Cretaceous
are comparable kaolins, comprised
to the hard of thin platy
Paleogene/Neogene kaolinite
Georgia
particles with
kaolins nothin
with stacks (Figure
platy 6a,b),
particles withare
nocomparable
large books or to stacks
the hard
[5]. Paleogene/Neogene Georgia kaolins
However, the Paleogene/Neogene
withkaolins, characterised
thin platy by pseudohexagonal
particles with no large booksstacks to books
or stacks with thin platy
[5]. However, particles (Figure 6c–f), kaolins,
the Paleogene/Neogene are
comparable to the soft Cretaceous Georgia kaolin with large coarse stacks interspersed
characterised by pseudohexagonal stacks to books with thin platy particles (Figure 6c–f), in a matrix of are
finer platy particles, as well as the soft Late Cretaceous/Early Paleogene/Neogene Capim
comparable to the soft Cretaceous Georgia kaolin with large coarse stacks interspersed in a matrix of River kaolin
with larger stacks [5].
finer platy particles, as well as the soft Late Cretaceous/Early Paleogene/Neogene Capim River kaolin
with larger stacks [5].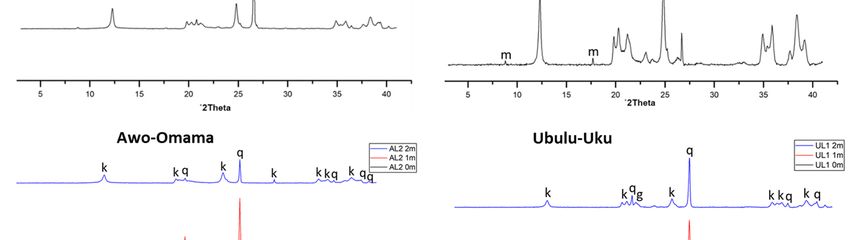
Minerals 2020, 10, 670                                                                                                             9 of 16
Minerals 2020, 10, x FOR PEER REVIEW                                                                                               9 of 16

      Figure 6. Scanning electron microscopy (SEM) micrographs of: Eruku (a) and Lakiri (b) kaolins
      Figure 6. Scanning electron microscopy (SEM) micrographs of: Eruku (a) and Lakiri (b) kaolins
      showing    platyparticles,
      showing platy    particles,Awo-Omama
                                   Awo-Omama    (c,d)(c,d) pseudohexagonal
                                                       pseudohexagonal stacksstacks  and with
                                                                               and books bookseuhedral
                                                                                                with euhedral
                                                                                                       crystals,
      crystals, and  Ubulu-Uku    (e,f) kaolins  showing    pseudohexagonal   stacks and books with
      and Ubulu-Uku (e,f) kaolins showing pseudohexagonal stacks and books with subhedral crystals. subhedral
      crystals.
3.3. Chemical Characteristics
3.3. Chemical Characteristics
      The major oxide compositions of the Cretaceous–Paleogene/Neogene kaolins are presented in
TableThe   major
       5. The    oxide
              most       compositions
                    abundant           of the
                               oxides were  SiOCretaceous–Paleogene/Neogene
                                                2 , Al2 O3 , Fe2 O3 and TiO2 ; whereas kaolins
                                                                                         MgO,are presented
                                                                                               CaO, Na2 O andin
Table  5. The
K2 O were     most abundant
            present            oxides were
                     in small quantities. TheSiO 2, Al2O3, Fe2Oof
                                               predominance       3 and
                                                                     SiOTiO
                                                                        2  and
                                                                             2 ; whereas
                                                                                 Al  O
                                                                                    2 3  MgO,
                                                                                        were   CaO,
                                                                                             mainly Na   O and
                                                                                                    associated
                                                                                                       2

K 2O were
with  quartzpresent in small
             and kaolinite    quantities.
                           minerals. Fe2 OThe  predominance
                                           3 and                  of SiO
                                                   TiO2 are the main     2 and Al2O3component.
                                                                       discolouring     were mainly associated
                                                                                                  The presence
with
of Fe2quartz
       O3 and and
               TiO2kaolinite   minerals.with
                     can be associated    Fe2O 3 and TiO
                                              hematite,      2 are the
                                                          goethite   andmain
                                                                         anatase discolouring
                                                                                    minerals. component. The
presence of Fe2O3 and TiO2 can be associated with hematite, goethite and anatase minerals.
      Table 5. Major oxide compositions (wt%) of the studied Cretaceous–Paleogene/Neogene kaolins
      compared
      Table     with the
            5. Major     world
                      oxide    sedimentary
                            compositions   kaolinofdeposits.
                                         (wt%)      the studied Cretaceous–Paleogene/Neogene kaolins
      compared with the world sedimentary kaolin deposits.
          Deposit                  Al2 O3   CaO      Fe2 O3    K2 O     MgO     Na2 O     SiO2      TiO2      LOI   SiO2 /Al2 O3
      Deposit
           Eruku          Min       Al2O3
                                   11.44      CaO
                                            0.01       Fe2O3 0.27
                                                      1.48     K2O 0.04MgO 0.02Na2O 47.22 SiO2 1.07TiO2 4.03LOI          SiO2/Al2O3
                                                                                                                        1.29
           (n = 9)
       Eruku              Max
                          Min      36.64
                                    11.44   0.03
                                              0.01    5.04
                                                        1.48 0.65
                                                                0.27 0.05
                                                                        0.04 0.050.02 80.30
                                                                                          47.22 2.841.07 12.894.03      7.02 1.29
                         Average   28.25    0.02      2.56   0.41    0.04    0.02     56.82     2.10     10.00          2.33
       (n = 9)            Max       36.64    0.03       5.04     0.65    0.05      0.05     80.30      2.84     12.89       7.02
                         Average    28.25    0.02       2.56     0.41    0.04      0.02     56.82      2.10     10.00       2.33
       Lakiri             Min       21.40    0.01       0.59     0.06    bdl       0.01     44.63      1.14     7.42        1.13
       (n = 6)            Max       39.50    0.02       2.70     0.56    bdl       0.04     69.60      2.00     13.92       3.25
                         Average    35.55    0.02       1.09     0.20    bdl       0.02     49.64      1.60     12.57       1.53
Minerals 2020, 10, 670 10 of 16
Table 5. Cont.
Deposit Al2 O3 CaO Fe2 O3 K2 O MgO Na2 O SiO2 TiO2 LOI SiO2 /Al2 O3
Lakiri Min 21.40 0.01 0.59 0.06 bdl 0.01 44.63 1.14 7.42 1.13
(n = 6) Max 39.50 0.02 2.70 0.56 bdl 0.04 69.60 2.00 13.92 3.25
Average 35.55 0.02 1.09 0.20 bdl 0.02 49.64 1.60 12.57 1.53
Awo-Omama Min 7.16 0.02 0.85 0.08 0.04 0.02 50.11 0.83 2.83 1.56
(n = 6) Max 32.09 0.04 4.24 0.27 0.06 0.02 87.99 1.99 11.97 12.29
Average 18.02 0.03 2.42 0.16 0.04 0.02 71.04 1.35 6.87 5.69
Ubulu-Uku Min 17.80 0.01 4.63 0.33 0.01 0.01 54.63 1.67 6.81 2.08
(n = 7) Max 26.83 0.02 8.30 0.60 0.17 0.03 67.63 2.38 10.02 3.80
Average 22.65 0.02 6.34 0.46 0.06 0.02 59.95 2.03 8.71 2.76
SCGK 1 Average 38.38 0.05 0.30 0.04 0.25 0.27 45.30 1.44 13.97 1.18
HPNGK 1 Average 39.50 0.03 1.13 0.06 0.03 0.08 44.00 2.43 13.90 1.11
SLCEPNCK 1 Average 38.03 0.01 0.59 0.02 0.01 0.03 46.56 0.78 13.80 1.22
Paper
Min 36 - 0.5 0.5 - - 45 0.5 - -
Coating 2
Max 38 - 1.00 1.50 - - 49.00 1.30 - -
Paper Filler 2 Min 37 - 0.5 0.5 - - 46 0.5 - -
Max 38 - 1.00 1.50 - - 48.00 1.50 - -
Ceramics 2 Min 36 - 0.6 1.2 - - 45 0.02 11.2 -
Max 38 - 1.00 2.70 - - 50.00 0.10 12.50 -
Pharm. & Min 38.1 0.1 0.1 0 0.1 0 44.6 0 13.8 -
Cosmetics 2 Max 39.5 0.2 0.20 0.20 0.2 0.1 46.40 1.40 13.90 -
SCGK—Soft Cretaceous Georgia Kaolins; HPNGK—Hard Paleogene/Neogene Georgia Kaolins; Soft Late
Cretaceous/Paleogene/Neogene Capim River Kaolins; bdl—below detection limit; LOI—loss on ignition; 1 —[5];
2 —[20,21].
The loss on ignition (LOI) average values for Paleogene/Neogene kaolins were relatively lower
than those for the Cretaceous kaolins. This is understandable since LOI is related to the dehydroxylation
of kaolins, organic matter oxidation, and decomposition of carbonates and hydroxides [22].
4. Discussion
Raw kaolin colour and fired products have aesthetic importance in their application, particularly
in ceramics [23]. Colours are imparted by colour-causing elements retained either in the structure of
the kaolin mineral or as associated oxides (such as anatase, hematite and goethite) occurring with
the kaolin mineral [24]. Clay minerals such as kaolin with Fe and Mg in its octahedral sites, contain
less structural water; hence less energy will be required for dehydroxylation and less temperature for
vitrification than usual. The lesser temperature is possible because Fe, Mg, Ca, Na and K oxides can act
as fluxing agents [11,19,25].
The EC estimates the amounts of soluble salts (such as chlorides, phosphates, sulphates, carbonates
and nitrates), which could cause severe problems in many applications [26,27]. In drying and firing of
ceramic clay bodies, visible surface-scum due to the migration of soluble salts have been observed on
the surface of vessels coupled with exfoliation and peeling of the surface under extensive crystallisation
condition [24]. The relatively low EC values suggest little or no dissolved salts in the kaolins [26].
Chemically inert (pH range of 4–9) and low conductivity kaolins could be useful in the production
of excellent fillers and extenders [5]. Considering the clayey nature of the samples in addition to the
relatively low conductivity, production waste resulting from cracking due to shrinkage when fired
would be low for ceramic applications [24].
The control of the sand, silt and clay fractions over porosity and permeability was assessed based
on the ternary diagram of McManus [28] (Figure 7). The Lakiri kaolins plotted predominantly within
the high porosity and very low permeability region (except for LP1 0 m); whereas the Eruku (except
EP1 4 m and EP2 4 m), Awo-Omama, and Ubulu-Uku kaolins all plotted in the low porosity and low
permeability region (Figure 7). Based on the Strazzera et al. [29] and Murray [5] criteria, the more
fine-grained Cretaceous kaolins with higher porosity could be suitable to produce porous ceramic
wares. The very low to low permeability is indicative of low cohesion and difficulty to extrude becauseMinerals 2020, 10, 670 11 of 16
moderate permeability will facilitate penetration of water into the kaolin, rendering its adsorption
faster and more important. In addition, the water in the ceramic paste must provide enough cohesion
to the ceramic body to equilibrate extrusion [27].
Minerals 2020, 10, x FOR PEER REVIEW 11 of 16
Minerals 2020, 10, x FOR PEER REVIEW 11 of 16
Figure 7. Ternary diagram of studied Cretaceous (a) and Paleogene/Neogene (b) kaolins based on
Figure 7. Ternary diagram of studied Cretaceous (a) and Paleogene/Neogene (b) kaolins based on their
their sand, silt, clay fraction percentages (Fields after [28]).
sand, silt, clay fraction percentages (Fields after [28]).
One of7.the
Figure most diagram
Ternary important factors Cretaceous
of studied in the industrial
(a) and applications of kaolin
Paleogene/Neogene is its plasticity.
(b) kaolins based on It is
Onecontrolled
of the
their most
sand, important
silt,
by several fraction factors
clay factors, such as in
percentages the
(Fields
the industrial
aftersize
particle applications
[28]).distribution, mineralofcomposition
kaolin is its andplasticity.
the It is
controlled by several factors, such as the particle for
presence of organic matter [30]. The PI and LL values size thedistribution,
Cretaceous-Paleogene/Neogene
mineral compositionkaolins and the
Oneonofthe
plotted theHoltz
most andimportant
Kovacsfactors
diagramin the
[31]industrial
(Figure 8a) applications
shows thatofallkaolin is its plasticity.
the kaolins plotted inItthe
is
presence controlled
of organic by matter
several [30]. The
factors, PIasand
such the LL values
particle size for the Cretaceous-Paleogene/Neogene
distribution, mineral composition and the kaolins
medium plastic region except for two Paleogene/Neogene samples which are in the low (UL1) and
plotted on the
presence
high Holtz
(AL2) andmatter
of regions.
organic Kovacs [30]. diagram
The PI and [31] (Figure
LL values for the8a) shows that all the kaolins
Cretaceous-Paleogene/Neogene plotted in the
kaolins
medium plotted
plasticonregion
the Holtz and Kovacs
except for twodiagram [31] (Figure 8a) shows
Paleogene/Neogene that all which
samples the kaolins
areplotted
in theinlow
the (UL1) and
medium plastic region except for two Paleogene/Neogene samples which are in the low (UL1) and
high (AL2) regions.
high (AL2) regions.
Figure 8. Position of the studied Cretaceous-Paleogene/Neogene kaolins on the Holtz and Kovacs [31]
diagram (a) and clay workability chart (After [17]) (b).
The slight
Figure 8.Figure
Position differences
8. Position in the
of theofstudied
the studied plasticity of the studied kaolins
Cretaceous-Paleogene/Neogene
Cretaceous-Paleogene/Neogene are
kaolinsrelated to the
on the Holtz
kaolins on differences
and
the Kovacs
Holtz [31]in
and the
Kovacs [31]
diagramof
abundance (a)silt
andand
clay clay
workability chartHigher
fractions. (After [17])
clay(b).
and silt fractions give rise to relatively higher
diagram (a) and clay workability chart (After [17]) (b).
plasticity [30]. In addition, a moderate PI indicates moderate potential for swelling. However,
The slight
excessive differences
shrinkage is not in the plasticity
expected of the
since the studiedobtained
PI values kaolins are
wererelatedMinerals 2020, 10, 670 12 of 16
within the optimum properties region and samples EP2 and UL1, which plotted outside both the
acceptable and optimum property regions.
Keller [37] described clays containing 3 wt% iron oxides with 1 to 3 wt% titania as useless to
the ceramist. However, Pruett and Alves [38] reported that the beneficiation of a kaolin to nearly
white is probable for kaolins containing a total ofMinerals 2020, 10, 670 13 of 16
kaolins. The average bulk TiO2 , MgO, CaO, Na2 O and K2 O concentrations of the studied kaolins were
comparable to the commercially marketed sedimentary kaolins; whereas Fe2 O3 concentrations were
quite higher. However, the average LOI values varying from 6.87–12.57 wt% were lower than the LOI
of ideal kaolinite (13.9) and that of commercially marketed sedimentary kaolins (Table 5).
Specifications related to the major oxides’ data are very important for industrial applications of
the kaolins. The average major oxides compositions of the studied Eruku, Awo-Omama and Ubulu-Uku
kaolins compared with specifications for paper coating, paper filler, ceramics, pharmaceutical and
cosmetics industries [20,21] showed that they cannot be used in their raw states without proper
beneficiation (Table 5). However, Lakiri kaolin could be more suited for applications in the paper
coating and ceramics industries except for TiO2 and K2 O contents (Table 5). The use of high magnetic
separators, possibly with other techniques such as flotation and/or selective flocculation will be effective
in refining the kaolins to increase their commercial uses [5,54].
5. Conclusions
This study determined the physico-chemical, mineralogical and chemical compositions of the
studied kaolins. The kaolins were considered to contain little or no soluble salts which can cause
exfoliation and peeling of the surfaces of ceramic clay bodies. The Cretaceous kaolins were more
clayey than the Paleogene/Neogene kaolins. Hence, from their particle size distribution, the Lakiri
kaolins were found to be highly porous with very low permeability; whereas the Eruku, Awo-Omama,
and Ubulu-Uku kaolins have low porosity and permeability, which have implications for the cohesion
and extrusion of the kaolins when used in the ceramic industry. Medium plasticity for the Cretaceous
and Paleogene/Neogene kaolins suggests moderate potential for swelling. The PI ≥ 10% values
obtained were appropriate for building related ceramic productions particularly in brick making and
possibly pottery wares without extrusion. In addition, PI < 35% suggest that excessive shrinkage is not
expected. Weight losses, if accompanied by shrinkages, would affect the use of the kaolins in ceramic
processing during firing. The platy morphology, particularly in the Cretaceous kaolins, is ideal for
imparting better paper quality.
For paper coating, paper filler, ceramics, pharmaceutical and cosmetics industries, the Cretaceous
Eruku and Paleogene/Neogene Awo-Omama and Ubulu-Uku kaolins are unsuitable as raw materials
due to their chemical compositions. However, the Cretaceous Lakiri kaolins could be suitable in
the paper coating and ceramic industries except for their TiO2 and K2 O contents. To improve the
commercial usage of the kaolins, beneficiation would be required.
Author Contributions: Investigation, O.O.; Writing—original draft, O.O.; Writing—review & editing, G.-I.E. and
J.O. All authors have read and agreed to the published version of the manuscript.
Funding: This research was funded by the University of Venda’s Research and Publication Committee, grant
number S 677.
Acknowledgments: The authors acknowledge the financial support received from the Research and Publication
Committee (RPC), University of Venda. We also appreciate Remy Bucher of the iThemba Labs, Sabine Verryn of
XRD Analytical and Consulting, Thivhani Meshack of the Department of Chemistry, UJ, and Mareli Grobbelaar of
the CAF, SU.
Conflicts of Interest: The authors declare no conflict of interest.
References
1. Onyemaobi, O.O. Mineral Resources Exploitation, Processing and Utilization—A Sine Qua Non for Nigeria’s
Metallurgical Industrial Development Inaugural Lecture Series 5 of FUTO; FUTO Press: Owerri, Nigeria,
2002; p. 48.
2. Ekosse, G.-I.E. Kaolin deposits and Occurrences in Africa: Geology, Mineralogy and Utilization. Appl. Clay Sci.
2010, 50, 212–236. [CrossRef]Minerals 2020, 10, 670 14 of 16
3. Oyebanjo, O.M. Paleo-Environmental Conditions and Tectonic Settings of Cretaceous-Tertiary Kaolins in
the Eastern Dahomey and Niger Delta Basins in Nigeria. Ph.D. Thesis, University of Venda, Thohoyandou,
South Africa, May 2018.
4. Virta, R.L. Kaolin Industrial Mineral. Rev. Min. Eng. 2004, 56, 28–29.
5. Murray, H.H. Applied Clay Mineralogy. Occurrences, Processing and Application of Kaolins, Bentonites,
Palygorskite–Sepiolite, and Common Clays, 1st ed.; Elsevier: Oxford, UK, 2007; p. 189.
6. Awad, M.E.; López-Galindo, A.; Medarević, D.; Ðuriš, J.; El-Rahmany, M.M.; Ibrić, S.; Viseras, C. Flow and
Tableting Behaviors of Some Egyptian Kaolin Powders as Potential Pharmaceutical Excipients. Minerals
2020, 10, 23. [CrossRef]
7. IndustryArc. Kaolin Market—Industry Analysis, Market Size, Share, Trends, Application Analysis, Growth
and Forecast 2019–2025. Available online: https://www.industryarc.com/Research/Kaolin-Market-Research-
500193 (accessed on 2 June 2020).
8. Murray, H.H.; Kogel, J.E. Engineered clay products for the paper industry. Appl. Clay Sci. 2005, 19, 199–206.
[CrossRef]
9. Premium Times. Nigeria: The Travails of Nigeria’s Artisanal Kaolin Miners Who Toil Daily to Earn Little.
Available online: https://allafrica.com/stories/201908160047.html (accessed on 29 May 2020).
10. Badmus, B.S.; Olatinsu, O.B. Geophysical evaluation and chemical analysis of kaolin clay deposit of Lakiri
village, southwestern Nigeria. Int. J. Phys. Sci. 2009, 4, 592–606.
11. Emofurieta, W.O.; Kayode, A.A.; Coker, S.A. Mineralogy, Geochemistry and Economic Evaluation of the
Kaolin Deposits near Ubulu-Uku, Awo-Omama and Buan in Southern Nigeria. J. Min. Geol. 1992, 28, 211–220.
12. Oyebanjo, O.M.; Ekosse, G.E.; Odiyo, J.O. Mineral constituents and kaolinite crystallinity of theMinerals 2020, 10, 670 15 of 16
28. McManus, J. Grain size distribution and interpretation. In Techniques in Sedimentology; Tucker, M.E., Ed.;
Blackwell Scientific Publications: Oxford, UK, 1988; pp. 63–85.
29. Strazzera, B.; Dondi, M.; Marsigli, M. Composition and ceramic properties of tertiary clays from southern
Sardinia (Italy). Appl. Clay Sci. 1997, 12, 247–266. [CrossRef]
30. Daoudi, L.; Elboudour, E.H.; Saadi, L.; Albizane, A.; Bennazha, J.; Waqif, M.; El Ouahabi, M.; Fagel, N.
Characteristics and ceramic properties of clayey materials from Amezmiz region (Western High Atlas,
Morocco). Appl. Clay Sci. 2014, 102, 139–147.
31. Holtz, R.D.; Kovacs, W.D. An Introduction to Geotechnical Engineering; Prentice-Hall, Inc.: Upper Saddle River,
NJ, USA, 1981.
32. Daniel, D.E. Seminar Publication: Design and Construction of RCRA/CERCLA Final Covers; Environmental
Protection Agency: Washington, DC, USA, 1991.
33. Abajo, M. Manual Sobre Fabricación de Baldosas. Tejas y Ladrillos; Beralmar S.A.: Barcelona, Spain, 2000.
34. Vieira, C.M.; Sa’nchez, R.; Monteiro, S.N. Characteristics of clays and properties of building ceramics in the
state of Rio de Janeiro, Brazil. Constr. Build. Mater. 2008, 22, 781–787. [CrossRef]
35. Bain, J.A. A plasticity chart as an aid to the identification and assessment of industrial clays. Clay Miner.
1971, 9, 1–17. [CrossRef]
36. Dondi, M.; Fabbri, B.; Guarini, G. Grain-Size Distribution of Italian Raw Materials for Building Clay Products:
A Reappraisal of the Winkler Diagram. Clay Miner. 1998, 33, 435–442. [CrossRef]
37. Keller, W.D. Flint clay and flint-clay facies. Clays Clay Miner. 1968, 16, 113–128. [CrossRef]
38. Pruett, R.J.; Alves, P.A. Compositions Comprising Fine Sedimentary Kaolin and Methods for Preparing
Same. U.S. Patent 8465583, 18 June 2013.
39. Wilson, M.J. Rock-Forming Minerals, Sheet Silicates–Clay Minerals, 2nd ed.; The Geological Society: London,
UK, 2013; Volume 3c, p. 724.
40. Gilkes, R.J.; Prakongkep, N. How the unique properties of soil kaolin affect the fertility of tropical soils.
Appl. Clay Sci. 2016, 131, 100–106. [CrossRef]
41. Luz, A.B.; Middea, A. Purification of kaolin by selective flocculation. In Proceedings of the 43rd Annual
Conference of Metallurgist of CIM, Hamilton, ON, Canada, 22–25 August 2004; pp. 243–253.
42. Baioumy, H.M. Geochemistry and origin of the Cretaceous sedimentary kaolin deposits, Red Sea, Egypt.
Chem. Erde 2014, 74, 195–203. [CrossRef]
43. Schroeder, P.A.; Pruett, R.J.; Melear, N.D. Crystal-chemical changes in an oxidative weathering front in a
Georgia kaolin deposit. Clays Clay Miner. 2004, 52, 211–220. [CrossRef]
44. Pruett, R.J. Kaolin deposits and their uses: Northern Brazil and Georgia, USA. Appl. Clay Sci. 2016, 131, 3–13.
[CrossRef]
45. Teklay, A.; Yin, C.; Rosendahl, L.; Bøjer, M. Calcination of kaolinite clay particles for cement production:
A modeling study. Cem. Concr. Res. 2014, 61–62, 11–19. [CrossRef]
46. Vaculíková, L.; Plevová, E.; Vallová, S.; Koutník, I. Characterization and differentiation of kaolinites from
selected Czech deposits using infrared spectroscopy and differential thermal analysis. Acta Geodyn. Geomater.
2011, 8, 59–67.
47. Garcia-Valles, M.; Pi, T.; Alfonso, P.; Canet, C.; Martinez, S.; Jimenez-Franco, A.; Tarrago, M.;
Hernández-Cruz, B. Kaolin from Acoculco (Puebla, Mexico) as raw material: Mineralogical and thermal
characterization. Clay Miner. 2015, 50, 405–416. [CrossRef]
48. El Ouahabi, M.; Daoudi, L.; Fagel, N. Mineralogical and geotechnical characterization of clays from northern
Morocco for their potential use in the ceramic industry. Clay Miner. 2014, 49, 35–51. [CrossRef]
49. Garcia-Valles, M.; Alfonso, P.; Martinez, S.; Roca, N. Mineralogical and Thermal Characterization of Kaolinitic
Clays from Terra Alta (Catalonia, Spain). Minerals 2020, 10, 142. [CrossRef]
50. Keller, W.D. Scan electron micrographs of kaolins collected from diverse environments of origin–I.
Clays Clay Miner. 1976, 24, 107–113. [CrossRef]
51. Keller, W.D. Classification of kaolins exemplified by their textures in scan electron micrographs.
Clays Clay Miner. 1978, 26, 1–20. [CrossRef]
52. Joussein, E.; Petit, S.; Churchman, J.; Theng, B.; Righi, D.; Delvaux, B. Halloysite clay minerals—A review.
Clay Miner. 2005, 40, 383–426. [CrossRef]Minerals 2020, 10, 670 16 of 16
53. Ekosse, G. Provenance of the Kgwakgwe kaolin deposit, southeastern Botswana and its possible utilization.
Appl. Clay Sci. 2001, 20, 137–152. [CrossRef]
54. Gougazeh, M. Removal of iron and titanium contaminants from Jordanian Kaolins by using chemical leaching.
J. Taibah Univ. Sci. 2018, 12, 247–254. [CrossRef]
© 2020 by the authors. Licensee MDPI, Basel, Switzerland. This article is an open access
article distributed under the terms and conditions of the Creative Commons Attribution
(CC BY) license (http://creativecommons.org/licenses/by/4.0/).You can also read