Vitamin D and Anti-Müllerian Hormone Levels in Infertility Treatment: The Change-Point Problem - MDPI
←
→
Page content transcription
If your browser does not render page correctly, please read the page content below
nutrients
Article
Vitamin D and Anti-Müllerian Hormone Levels in
Infertility Treatment: The Change-Point Problem
Anna Bednarska-Czerwińska 1 , Katarzyna Olszak-Wasik
                                                  ˛   2, * , Anita Olejek 2 ,
                  1
Michał Czerwiński and Andrzej Tukiendorf   3

 1   GynCentrum Clinic, Żelazna 1, 40-851 Katowice, Poland; annabednarska@post.pl (A.B.-C.);
     czerwinski.m92@gmail.com (M.C.)
 2   Department of Gynecology, Obstetrics and Oncological Gynecology, Silesian Medical University,
     Batorego 15, 41-902 Bytom, Poland; anitaolejek@wp.pl
 3   Department of Public Health, Wrocław Medical University, Bartla 5, 51-618 Wrocław, Poland;
     andrzej.tukiendorf@gmail.com
 *   Correspondence: olszakwasik@tlen.pl; Tel.: +48-32-486-15-40

 Received: 6 April 2019; Accepted: 8 May 2019; Published: 10 May 2019

 Abstract: Background: Anti-Müllerian hormone (AMH) is considered to be one of the most significant
 indicators of women’s fertility. Many studies have shown that vitamin D may modify human
 reproductive functions; however, the results are conflicting. The composition of follicular fluid (FF)
 creates the biochemical environment of the oocyte and affects its quality, which later determines
 the embryo quality. In this study, we aimed to revise with advanced statistical techniques the
 relationship between AMH and vitamin D in FF. Methods: The study was designed as a prospective
 single-center study in infertile patients with AMH ≥ 0.7 ng/mL who underwent controlled ovarian
 hyperstimulation for in vitro fertilization. AMH and vitamin D levels in FF were measured. Next,
 the standard and advanced statistical (including segmented regression) techniques were applied.
 Results: We observed a negative linear correlation between levels of AMH in serum and FF and total
 vitamin D concentrations up to approximately 30 ng/mL; with a statistically significant relationship
 in FF. Beyond that concentration, the trend was positive but statistically insignificant. Conclusions:
 As an existing “change-point problem” was noticed, we suggest segmentation in the relationship
 between vitamin D and AMH during infertility treatment.

 Keywords: vitamin D; anti-Müllerian hormone; follicular fluid; segmented regression

1. Introduction
      It is widely known that the anti-Müllerian hormone (AMH) in the serum of women of reproductive
age is secreted by the granulosa cells of ovarian follicles and appears to regulate early follicle
development. Its level varies slightly with the menstrual cycle, reaching the peak value during the
late follicular phase [1]. However, the serum AMH level varies greatly among similar individuals for
unknown reasons [2]. Notably, when estradiol and follicle-stimulating hormone (FSH) levels follow
the expected patterns during gestation, no significant modifications are found in AMH levels during
pregnancy or in the early puerperium; thus, FSH does not seem to play a direct role in AMH synthesis
and secretion [1]. Moreover, the excessive production of AMH by growing follicles is now considered
to be an important feature of polycystic ovary syndrome (PCOS). The lack of an international standard
for the serum AMH assay, mainly because of technical issues, makes it difficult to define consensual
thresholds and thus impairs the widespread use of this new ovarian marker in the diagnosis of PCOS [3].
It is hoped that the serum AMH assay will soon be improved for predicting menopause. Based on
standard statistical methods, the relationship between ovarian reserve tests and time to menopause

Nutrients 2019, 11, 1053; doi:10.3390/nu11051053                              www.mdpi.com/journal/nutrients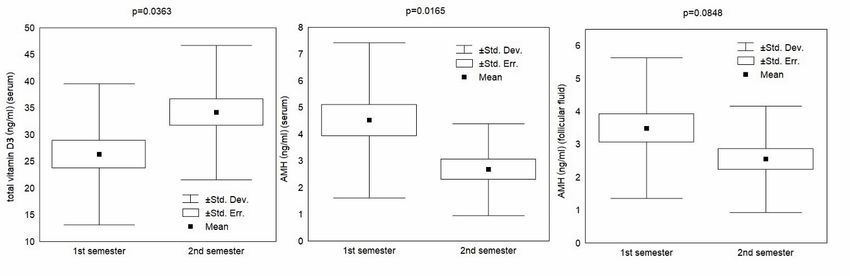
Nutrients 2019, 11, 1053                                                                            2 of 10

were recently defined [4]. A reduction in AMH with age in women has also been confirmed by some
investigators [5].
      The skin, liver, and kidneys are the main organs involved in the production of vitamin D
and its metabolites. First, hydroxylation of vitamin D synthesized in the skin takes place in the
liver. Next, hydroxylation in the kidneys turns 25-hydroxyvitamin D (25(OH)D) into the active
1,25-dihydroxyvitamin D3 form (1,25(OH)2 D3 ). In addition, other tissues (e.g., placenta) are able to
produce 1,25(OH)2 D3 [6]. Most 25(OH)D is bound to the vitamin D binding protein (DBP) or to serum
albumin. Only around 1% of 25(OH)D acts as a free biologically active hormone [7]. For routine
diagnostic testing, total 25(OH)D is measured.
      It is known that vitamin D deficiency may be a factor participating in the development of
gestational diabetes mellitus, as vitamin D regulates insulin production and insulin response in tissues.
It is believed that maternal supply of vitamin D affects early fetal development and fetal-placental
immune response which, if inappropriate, entails the risk of preeclampsia [6]. Vitamin D status in
pregnancy also impacts the offspring’s long-term health outcomes (bone development, birth and
postnatal weight, tendency for autoimmune diseases, and neuropsychiatric outcomes). The biologically
active 1,25(OH)2 D3 metabolite increases with the gestational age; however, this rise may result from
the availability of 25(OH)D [6].
      It is also hypothesized that vitamin D has a direct effect on AMH production, and, thus, patients
with higher concentrations of vitamin D are able to maintain their ovarian reserve for longer [8].
Studies either confirm that vitamin D may be a positive regulator of AMH production [2], or report that
its levels are unrelated to ovarian reserve or ovarian response after ovarian stimulation [9]. Significant
seasonal variations in serum vitamin D were observed between summer and winter; however, serum
AMH levels remained unaffected by season [10]. A large review examined the role of vitamin D
in ovarian physiology and its implications for reproduction [11]. Follicular fluid (FF) serves as the
biochemical microenvironment of the oocyte before ovulation. Among its constituents, vitamin D
was studied in terms of possible influence on female fertility [12]. To date, however, no negative
relationship between vitamin D concentration in the serum and FF has been found in the literature.
      Given the above facts, the aim of this clinical study was to update current knowledge regarding
the relationship between vitamin D levels and levels of AMH in serum and FF. Our purpose was to
identify changes of vitamin D and AMH concentrations and then to estimate the possible location of
changes (change-points). Standard and advanced statistical techniques were applied in the statistical
analysis to investigate “the change-point problem”.

2. Material and Methods

2.1. Study Design and Participants
     The present study was designed as a prospective single-center cohort study comprising
53 women with infertility (Caucasian ethnicity, with secondary or university levels of education,
aged 34.7 ± 4.1 years, with a mean body mass index (BMI) of 22.2 ± 2.7 kg/m2 ) who sought medical
attention at GynCentrum, Katowice, Poland, in 2017. All were diagnosed with tubal factor infertility.
Based on this diagnosis, couples were qualified for in vitro fertilization (IVF). Only patients in good
general health condition were asked to participate in the study. Patients with a medical history
of hypertension, diabetes, renal dysfunction, hyperinsulinism, PCOS, and endometriosis were not
enrolled in the study.

2.2. Ethical Consideration
     All the patients signed an informed consent form approved by the Silesian Medical University
Ethics Committee (ref. no. KB1/63/16). All methods were performed in accordance with the
guidelines of the European Society of Human Reproduction and Embryology, the American Society for
Reproductive Medicine, and the Polish Society of Reproductive Medicine and Embryology.
Nutrients 2019, 11, 1053 3 of 10
2.3. Data Collection
Before undergoing infertility treatment, all the recruited patients provided a blood sample on
the day of their first consultation, irrespective of the day of the menstrual cycle (for the AMH test).
Between the second and third day of the patient’s menstrual cycle, prior to ovarian hyperstimulation,
additional hormone tests were performed (FSH-follicle stimulating hormone, LH- luteinizing hormone
and estradiol). All patients with AMH ≥ 0.7 ng/mL were scheduled to undergo controlled ovarian
hyperstimulation (COH) using the antagonist protocol, intracytoplasmic sperm injection, and a single
embryo transfer. The starting dose of COH was based on age, AMH, FSH, BMI (body mass index), and
experience from previous cycles. Gonadotropin (Gonal F, Merck Serono, UK, and Menopur, Ferring,
Germany) doses were further adjusted according to ultrasound findings and estradiol measurements
during stimulation monitoring. When at least three follicles reached a diameter of 18 mm, recombinant
human chorionic gonadotropin (r-hCG) (Ovitrelle, Serono, Switzerland) was administered, and 35–36 h
later, oocyte retrieval was performed under light sedation. FF from the first mature follicle aspirated
was collected before any flushing, for oocyte recovery. The FF was then centrifuged at 3000 cycles/min
and stored at −60 ◦ C until assayed.
All laboratory measurements were performed using an electrochemiluminescent (ECLIA)
immunoanalyzer (Cobas e411, Roche Diagnostics, Mannheim, Germany). Vitamin D and anti-Müllerian
hormone levels in the FF were measured according to the quantitation limits of the assay at 3.0 and
0.1 ng/mL. Serum AMH samples were obtained at the first consultation, irrespective of the day of
the menstrual cycle. Blood was drawn in plain serum tubes, centrifugation was performed within
1 h, and then the serum was separated. The results were measured using the immunoanalyzer
manufacturer’s instructions.
2.4. Statistical Analysis
The initial design of the study was confirmed using a calculation to determine the sample size
needed to ensure that a correlation coefficient between vitamin D levels and AMH will differ from
zero. In the next step, a Student’s t-test was applied to show seasonal differences between the first
(winter + spring) and the second (summer + autumn) semesters, and Pearson’s correlation was used to
illustrate linearity between AMH in serum and FF and vitamin D levels. Finally, to identify changes in
levels of AMH in serum and FF at unknown vitamin D concentrations, and to estimate the location of
changes, change-point regression was used. Generally, change-point regression (also called segmented
regression) is a regression in which the expected value of the dependent variable or response is
assumed to have a different functional form in several neighborhoods of the explanatory variable
space. The change-point is estimated in so-called broken-line regression models, where the regression
function is assumed to be continuous at the point of change. Numerous methodological approaches
have been implemented to examine change-point models; typically, these involve maximum-likelihood
estimation or Bayesian estimation [13].
3. Results
3.1. Sample Size Calculation
This statistical procedure showed that the collected sample size of 53 patients had a power, or 1 - β
(probability of failing to reject the null hypothesis under the alternative hypothesis = type II error
rate), of more than 90% to detect a correlation between vitamin D levels and AMH levels with r = 0.1
(the expected correlation coefficient) and a significance level α (threshold probability for rejecting the
null hypothesis = type I error rate) of 0.05 using a two-sided Z-test [14].
3.2. Student’s t-Test
First, seasonal differences between the first (winter + spring) and the second (summer + autumn)
semesters were evaluated using a standard Student’s t-test. The results are displayed in Table 1.Table 1. Seasonal differences in vitamin D (total) and other biomarkers.
Overall 1st Semester 2nd Semester t-Test
Origin
Nutrients 2019, 11, 1053 Biomarker Mean ± SD Mean ± SD Mean ± SD p-value
4 of 10
vitamin D total (ng/mL) 29.7 ± 13.3 26.3 ± 13.2 34.2 ± 12.6 0.0363
Seasonal
Table 1.AMH differences in vitamin
(ng/mL) D (total) and
3.68 ± 2.58 4.52other
± 2.90biomarkers.
2.67 ± 1.72 0.0165
Serum FSH (mIU/mL) 6.87 ± 1.741st Semester
Overall 6.61 ± 1.792nd Semester
7.25 ± 1.66 t-Test 0.2476
Origin Biomarker
LH (mIU/mL) Mean ±6.12
SD± 2.16 Mean ±6.25 5.94 ± 2.66 p-value0.6611
SD± 1.74 Mean ± SD
vitamin D total (ng/mL)
estradiol (pg/mL) 29.7 ± 13.3
1269 ± 754 26.3 ± 13.2
1447 ± 662 34.2 ± 12.6
1076 ± 814 0.0363 0.0957
AMH (ng/mL) 3.68 ± 2.58 4.52 ± 2.90 2.67 ± 1.72 0.0165
Serum AMH (ng/mL)
FSH (mIU/mL) 6.87 ± 1.74
3.01 ± 1.90 6.61 ± 1.79
3.49 ± 2.14 7.25 ± 1.66
2.55 ± 1.62 0.2476 0.0848
LH (mIU/mL) 6.12 ± 2.16 6.25 ± 1.74 5.94 ± 2.66 0.6611
FSH (mIU/mL) 4.75 ± 2.04 4.34 ± 1.73 4.87 ± 2.03
Follicular Fluid
estradiol (pg/mL) 1269 ± 754 1447 ± 662 1076 ± 814 0.0957 0.3255
AMHLH (mIU/mL)
(ng/mL) 0.81 ± 0.82 3.49 ± 2.14
3.01 ± 1.90 0.74 ± 0.66 2.55 ± 1.62
0.77 ± 0.90 0.0848 0.9174
Follicular FSHestradiol
(mIU/mL) (µg/mL)
4.75 ± 2.04
542 ± 419
4.34 ± 1.73
492 ± 346
4.87 ± 2.03
568 ± 496
0.3255 0.5344
Fluid LH (mIU/mL) 0.81 ± 0.82 0.74 ± 0.66 0.77 ± 0.90 0.9174
(AMH- anti-Müllerian
estradiol hormone,
(µg/mL) FSH- follicle stimulating
542 ± 419 hormone,
492 ± 346 LH- luteinizing
568 ± 496 hormone, SD-
0.5344
AMH-standard deviation).
anti-Müllerian hormone, FSH- follicle stimulating hormone, LH- luteinizing hormone, SD- standard deviation.
AAstatistically
statisticallysignificant difference
significant (p 30 ng/mL p-value t-test
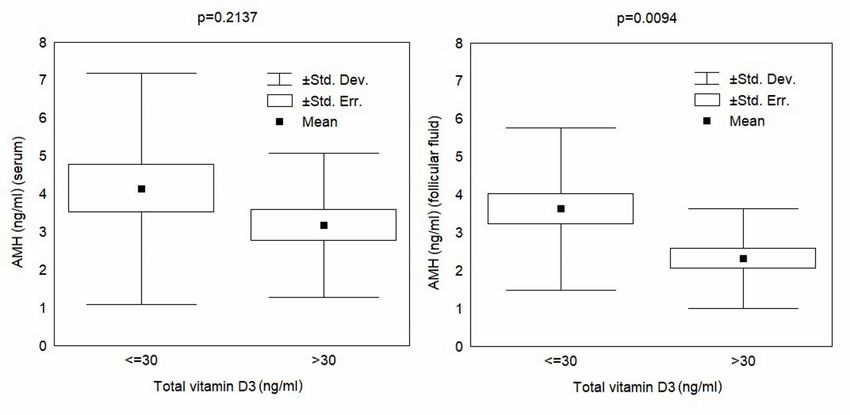
AgeCharacteristics
Patient 34.1 ± 4.2 Mean ± SD35.4 ± 4 Mean ± SD 0.2782 p-value
BMI (kg/m2 ) 22.5 ± 2.9 21.8 ± 2.8 0.5208
AMH (ng/mL) Age(serum) 4.14 ± 3.05 34.1 ± 4.2
3.18 ± 1.90 35.4 ± 4 0.2137 0.2782
AMH (ng/mL) (follicular fluid) 3.63 ± 2.14 2.32 ± 1.32 0.0094
AMH- anti-Müllerian hormone, BMI- body mass index, SD- standard deviation.
The Student’s t-test results shown in Table 2 indicate an insignificant difference in the AMH
concentration in serum in reference to the ES norm, but a statistically significant decrease in the AMH
level in the FF among patients with higher levels of vitamin D. The results are plotted in Figure 2.AMH (ng/mL) (follicular fluid) 3.63 ± 2.14 2.32 ± 1.32 0.0094
AMH- anti-Müllerian hormone, BMI- body mass index, SD- standard deviation.
The Student’s t-test results shown in Table 2 indicate an insignificant difference in the AMH
Nutrients 2019, in
concentration 11,serum
1053 in reference to the ES norm, but a statistically significant decrease in the AMH 5 of 10
level in the FF among patients with higher levels of vitamin D. The results are plotted in Figure 2.
Figure 2. AMH (anti-Müllerian hormone) in serum and in follicular fluid relative to the vitamin D
Figure
norm2.(30
AMH (anti-Müllerian hormone) in serum and in follicular fluid relative to the vitamin D
ng/mL).
norm (30 ng/mL).
3.3. Pearson’s Linear Correlations
3.3. Pearson’s Linear Correlations
The results of Pearson’s linear correlations for AMH, in serum and FF, and vitamin D levels are
The results
reported of Pearson’s
in Table 3. linear correlations for AMH, in serum and FF, and vitamin D levels are
reported in Table 3.
Table 3. Pearson’s linear correlations for total vitamin D and AMH concentrations.
Table 3. Pearson’s linear correlations for total vitamin D and AMH concentrations.
AMH r (CI 95%) p-value
AMH r (CI 95%) p-value
serum −0.19 (−0.46, 0.12) 0.2211
follicular fluid
serum −0.28 (−0.51,
−0.19 (−0.46, 0.02)
0.12) 0.2211 0.0391
AMH- anti-Müllerian hormone, CI- confidence interval.
follicular fluid −0.28 (−0.51, 0.02) 0.0391
The data presented (AMH-in Table 3 indicate
anti-Müllerian both CI-
hormone, theconfidence
negative interval).
linear correlations between AMH in
serum and FF and the total vitamin D concentration. However, the relationship between AMH levels
in FF
Theand
datavitamin D concentration
presented was statistically
in Table 3 indicate significant.
both the negative Thecorrelations
linear results are presented graphically
between AMH in in
serum and
Figure FF and the total
3. 2019, 11, 1053
Nutrients
vitamin D concentration. However, the relationship between AMH levels6 of 10
in FF and vitamin D concentration was statistically significant. The results are presented graphically
in Figure 3.
Figure
Figure 3. AMH versus vitamin D in serum and in follicular fluid (linear (AMH-anti-Müllerianhormone,
3. AMHversusvitaminDinserumandinfollicularfluid(linearcorrelations). correlations). (AMH- anti-
FF- Müllerian hormone, FF- follicular fluid).
follicular fluid).
Figure 3 shows that some apparent change-points for the AMH concentration, in both serum
and FF, occur around a vitamin D concentration of 30 ng/mL. A possible segmentation of this rela-
tionship will be checked using the appropriate statistical tool (i.e., segmented regression).Nutrients 2019, 11, 1053 6 of 10
Figure 3 shows that some apparent change-points for the AMH concentration, in both serum and FF,
occur around a vitamin D concentration of 30 ng/mL. A possible segmentation of this relationship will
be checked using the appropriate statistical tool (i.e., segmented regression).
3.4. Change-Point Problem
In this study, the “segmented” R package [16] was used to estimate trends in the change-points
and slopes of AMH (in serum and in FF) in relation to the total vitamin D concentration (Table 4).
Table 4. Segmented regression of AMH concentrations in relation to vitamin D concentration.
(AMH-anti-Müllerian hormone, CI- confidence interval)
AMH Origin Regression Parameter Mean (CI 95%) p-value
change-point 31 (15,47) 0.0001
Serum slope I −0.14 (0.00, 0.28) 0.0605
slope II 0.05 (−0.11, 0.21) 0.5017
change-point 33 (15, 51) 0.0003
Follicular Fluid slope I −0.09 (−0.17, −0.01) 0.0340
slope II 0.02 (−0.10, 0.14) 0.7432
The results reported in Table 4 were interpreted as follows: negative effects of vitamin D on AMH
in serum and FF were observed at concentrations up to 31 and 33 ng/mL, respectively. In the serum,
the effect was borderline significant, whereas in the FF, the impact was statistically significant. The larger
the estimated change-point vitamin D concentrations, the more positively they influenced the analyzed
Nutrients 2019, 11, 1053 7 of 10
AMH trends; however, the effects were statistically insignificant (see Table 4, for details). The effects of
vitamin D concentrations can be observed in Figure 4.
Figure 4. Effects of vitamin D on AMH in serum and follicular fluid.
Figure 4. Effects of vitamin D on AMH in serum and follicular fluid.
4. Discussion
4. Discussion
There is an increasing awareness that vitamin D plays an important role in reproduction, and
severalThere is studies
clinical an increasing
suggestawareness
a correlationthat vitaminadequate
between D playsvitamin
an important
D levelsrole
andinsuccessful
reproduction, and
fertility
several clinical
treatments in women studies
withsuggest a correlation
infertility [11] (mostlybetween adequate
in the context vitamin
of in D levels and[17,18].
vitro fertilization) successful fertil-
Because
ity treatments
seasonal in women
fluctuations withvitamin
in serum infertility
D [11] (mostly
levels in theto
are related context of in vitro
ultraviolet fertilization)
light exposure [19][17,18].
and
Because
because theseasonal
“sunshine fluctuations
vitamin” isin related
serum vitamin
to seasonalD levels are related
fluctuations to ultraviolet
in ovulation [20], itlight exposure [19]
is reasonable to
and because
hypothesize thevitamin
that “sunshine
D mayvitamin” is related
be capable to seasonal
of influencing fluctuations
ovarian functioninand
ovulation [20], it is reason-
AMH production [10].
ableinvestigators
Some to hypothesize that
have vitamin
even D may
observed be capable
a positive linearofrelationship
influencingbetween
ovarianvitamin
function D and
and AMH [2]. pro-
duction [10]. Some investigators have even observed a positive linear relationship
It is also believed that acute supplementation with high-dose vitamin D rapidly increases serum AMH between vitamin
D and AMH [2]. It is also believed that acute supplementation with high-dose vitamin D rapidly
increases serum AMH in young women [21]. However, it seems that dietary intake contributes to
vitamin D blood levels to a lesser extent.
AMH inhibits the primordial to primary follicle transition. This repressive effect on granulose
cell differentiation is mediated by highly specific type II receptors (AMHR-II); thus, higher AMH isNutrients 2019, 11, 1053 7 of 10
in young women [21]. However, it seems that dietary intake contributes to vitamin D blood levels to a
lesser extent.
AMH inhibits the primordial to primary follicle transition. This repressive effect on granulose
cell differentiation is mediated by highly specific type II receptors (AMHR-II); thus, higher AMH is
responsible for suppressing follicles maturation. The role of vitamin D is to inhibit AMHR- II [22].
A study by Malloy et al. [23] also showed that the AMH promoter contains a functional vitamin D
response element (VDRE) and its expression is regulated by 1,25(OH)2 D3 . The physiological relevance
of AMH is unclear [24]. In a study of rhesus macaque follicles, AMH concentrations were higher in
the lower vitamin D media (25 pg/mL) during 5 weeks of culture than in the higher vitamin D media
(100 pg/mL). Given that the effect was reversed at 4 weeks, the action of vitamin D on the primate
follicle appears to be indirect [25]. A critical appraisal of the role of the “sunshine vitamin” can also be
found in a paper by Laganà et al. [26].
Our findings likely confirm seasonal fluctuation of vitamin D levels [10], but the relationship
between vitamin D and AMH concentration is in opposition to some reports [2,21]. A strong negative
trend of AMH, both in serum and in FF, was observed with vitamin D concentrations of up to
approximately 30 ng/mL; beyond that concentration, the trend is positive but statistically insignificant.
Various reasons might explain our outcomes, but similar trends in the relationship between vitamin D
and sex hormones have been reported recently. For example, one study [27] found that progesterone
concentration was decreased in response to 1,25(OH)2 D3 . Furthermore, the authors hypothesize that
excess vitamin D may even cause a reduction in this important hormone and consequently have a
severe detrimental role during early pregnancy.
With gestational age, liver synthetic function increases, as does the biologically active 1,25(OH)2 D3
metabolite. However, this rise may result from the availability of 25(OH)D [6].
During pregnancy, high estrogen levels are responsible for the liver production of many proteins
and among them the vitamin D binding protein (DBP). Higher concentrations of binding proteins
diminish the level of free vitamin D. Ovarian hormonal controlled hyperstimulation is also associated
with high estrogen levels (the mean estradiol serum level in our study was 1269+/− 754 pg/mL).
The question that appears here is whether long-lasting hyperstimulation with elevated estradiol levels
may influence the level of vitamin D in dependency of DBP availability. However, the average half-life
of 25(OH)D in blood is around 3 weeks [7] and hormonal stimulation in our group lasted no longer
than 13 days (data not shown).
Total 25(OH)D levels depend on DBP levels that may vary in different conditions and
populations [6]. We did not measure DBP concentration, nor liver and renal function during the study.
Also, as shown by Tsuprykov et al. [7], free, but not total 25(OH)D characterizes vitamin D status in
pregnancy with higher sensitivity.
This is probably one of the limitations in our study. Vitamin D behaves in a similar way to
hormones, so to assess vitamin D status among infertile women, we could measure free instead of
total 25(OH)D.
The precise steroidogenic signaling cascade of vitamin D is not still well-described in the literature.
As stated by Parikh et al. [28], 1,25(OH)2 D3 stimulated progesterone and estradiol production. Together
with insulin, 1,25(OH)2 D3 increased estradiol production by 60%. 1,25(OH)2 D3 used alone also
influenced IGFBP-1 production, but together with insulin the activity was changed towards inhibition
of IGFBP-1 production.
Although, in studies by Aleyasin et al. [29], serum and follicular levels of vitamin D did not differ
with the cause of infertility, some associations were found between serum levels of 25(OH)D and PCOS,
where 25(OH)D levels increased to compensate for insulin resistance. In our study, PCOS cases were
not enrolled.
Likewise, it is possible that physiological levels of vitamin D have a beneficial role in endometrial
receptivity, while an excess of vitamin D plays a detrimental role in ovarian homeostasis, disturbing
oocyte development and consequently embryo quality [30]. This may explain why decreased expressionNutrients 2019, 11, 1053 8 of 10 of vitamin D binding protein (VDBP) in the FF was associated with improved IVF outcomes [31], and why women with serum 25(OH)D
Nutrients 2019, 11, 1053                                                                                               9 of 10

4.    Broer, S.L.; Eijkemans, M.J.; Scheffer, G.J.; van Rooij, I.A.; de Vet, A.; Themmen, A.P.; Laven, J.S.; de Jong, F.H.;
      Te Velde, E.R.; Fauser, B.C.; et al. Anti-mullerian hormone predicts menopause: A long-term follow-up study
      in normoovulatory women. J. Clin. Endocrinol. Metab. 2011, 96, 2532–2539. [CrossRef] [PubMed]
5.    Barbakadze, L.; Kristesashvili, J.; Khonelidze, N.; Tsagareishvili, G. The correlations of anti-mullerian
      hormone, follicle-stimulating hormone and antral follicle count in different age groups of infertile women.
      Int. J. Fertil. Steril. 2015, 8, 393–398. [PubMed]
6.    von Websky, K.; Hasan, A.A.; Reichetzeder, C.; Tsuprykov, O.; Hocher, B. Impact of vitamin D on
      pregnancy-related disorders and on offspring outcome. J. Steroid Biochem. Mol. Biol. 2018, 180, 51–64.
      [CrossRef]
7.    Tsuprykov, O.; Buse, C.; Skoblo, R.; Hocher, B. Comparison of free and total 25-hydroxyvitamin D in normal
      human pregnancy. J. Steroid Biochem. Mol. Biol. 2019. [CrossRef]
8.    Grzechocinska, B.; Dabrowski, F.A.; Cyganek, A.; Wielgos, M. The role of vitamin D in impaired fertility
      treatment. Neuroendocrinol. Endocrinol. Lett. 2013, 34, 756–762.
9.    Fabris, A.M.; Cruz, M.; Iglesias, C.; Pacheco, A.; Patel, A.; Patel, J.; Fatemi, H.; García-Velasco, J.A. Impact of
      vitamin D levels on ovarian reserve and ovarian response to ovarian stimulation in oocyte donors. Reprod.
      Biomed. Online 2017, 35, 139–144. [CrossRef]
10.   Pearce, K.; Gleeson, K.; Tremellen, K. Serum anti-Mullerian hormone production is not correlated with
      seasonal fluctuations of vitamin D status in ovulatory or PCOS women. Hum. Reprod. 2015, 30, 2171–2177.
      [CrossRef]
11.   Irani, M.; Merhi, Z. Role of vitamin D in ovarian physiology and its implication in reproduction: A systematic
      review. Fertil. Steril. 2014, 102, 460–468. [CrossRef] [PubMed]
12.   Revelli, A. Follicular fluid content and oocyte quality: From single biochemical markers tometabolomics.
      Reprod. Biol. Endocrinol. 2009, 7, 40. [CrossRef] [PubMed]
13.   Khodadadi, A.; Asghariany, M. Change-point Problem and Regression: An Annotated Bibliography. Collection of
      Biostatistics Research Archiv; The Berkeley Electronic Press: Berkeley, CA, USA, 2008; p. 44.
14.   Hulley, S.B.; Cummings, S.R.; Browner, W.S.; Grady, D.G.; Newman, T.B. Designing Clinical Research: An
      Epidemiologic Approach, 4th ed.; Lippincott Williams & Wilkins: Philadelphia, PA, USA, 2013; Appendix 6C:79.
15.   Holick, M.F.; Binkley, N.C.; Bischoff-Ferrari, H.A.; Gordon, C.M.; Hanley, D.A.; Heaney, R.P.; Murad, M.H.;
      Weaver, C.M. Evaluation, treatment, and prevention of vitamin D deficiency: An Endocrine Society clinical
      practice guideline. J. Clin. Endocrinol. Metab. 2011, 96, 1911–1930. [CrossRef]
16.   Muggeo, V.M.R. Segmented: An R package to fit regression models with broken-line relationships. R News
      2008, 8, 20–25.
17.   Ozkan, S.; Jindal, S.; Greenseid, K.; Shu, J.; Zeitlian, G.; Hickmon, C.; Pal, L. Replete vitamin D stores predict
      reproductive success following in vitro fertilization. Fertil. Steril. 2010, 94, 1314–1319. [CrossRef] [PubMed]
18.   Paffoni, A.; Ferrari, S.; Viganò, P.; Pagliardini, L.; Papaleo, E.; Candiani, M.; Tirelli, A.; Fedele, L.; Somigliana, E.
      Vitamin D deficiency and infertility: Insights from in vitro fertilization cycles. J. Clin. Endocrinol. Metab.
      2014, 99, E2372–E2376. [CrossRef]
19.   Dixon, K.M.; Mason, R.S. Vitamin D. Int. J. Biochem. Cell Biol. 2009, 5, 982–985. [CrossRef]
20.   Rojansky, N.; Brzezinski, A.; Schenker, J.G. Seasonality in human reproduction: An update. Hum. Reprod.
      1992, 7, 735–745. [CrossRef]
21.   Dennis, N.A.; Houghton, L.A.; Pankhurst, M.W.; Harper, M.J.; McLennan, I.S. Acute supplementation with
      high dose vitamin D3 increases serum anti-Müllerian hormone in young women. Nutrients 2017, 9, 719.
      [CrossRef]
22.   Merhi, Z.; Doswell, A.; Krebs, K.; Cipolla, M. Vitamin D alters genes involved in follicular development
      and steroidogenesis in human cumulus granulosa cells. J. Clin. Endocrinol. Metab. 2014, 99, E1137–E1145.
      [CrossRef]
23.   Malloy, P.J.; Peng, L.; Wang, J.; Feldman, D. Interaction of the vitamin D receptor with a vitamin D response
      element in the Mullerian-inhibiting substance (MIS) promoter: Regulation of MIS expression by calcitriol in
      prostate cancer cells. Endocrinology 2008, 150, 1580–1587. [CrossRef] [PubMed]
24.   Lee, M.M.; Donahoe, P.K.; Hasegawa, T.; Silverman, B.; Crist, G.B.; Best, S.; Hasegawa, Y.; Noto, R.A.;
      Schoenfeld, D.; MacLaughlin, D.T. Mullerian inhibiting substance in humans: Normal levels from infancy to
      adulthood. J. Clin. Endocrinol. Metab. 1996, 81, 571–576. [PubMed]
Nutrients 2019, 11, 1053 10 of 10
25. Xu, J.; Hennebold, J.D.; Seifer, D.B. Direct vitamin D3 actions on rhesus macaque follicles in three-dimensional
culture: Assessment of follicle survival, growth, steroid, and antimüllerian hormone production. Fertil.
Steril. 2016, 106, 1815–1820. [CrossRef] [PubMed]
26. Laganà, A.S.; Vitale, S.G.; Ban Frangež, H.; Vrtačnik-Bokal, E.; D’Anna, R. Vitamin D in human reproduction:
The more, the better? An evidence-based critical appraisal. Eur. Rev. Med. Pharmacol. Sci. 2017, 21, 4243–4251.
27. Hong, S.H.; Lee, J.E.; Kim, H.S.; Jung, Y.J.; Hwang, D.; Lee, J.H.; Yang, S.Y.; Kim, S.C.; Cho, S.K.; An, B.S.
Effect of vitamin D3 on production of progesterone in porcine granulosa cells by regulation of steroidogenic
enzymes. J. Biomed. Res. 2016, 30, 203–208.
28. Parikh, G.; Varadinova, M.; Suwandhi, P.; Araki, T.; Rosenwaks, Z.; Poretsky, L.; Seto-Young, D. Vitamin D
regulates steroidogenesis and insulin-like growth factor binding protein-1 (IGFBP-1) production in human
ovarian cells. Horm. Metab. Res. 2010, 42, 754–757. [CrossRef]
29. Aleyasin, A.; Hosseini, M.A.; Mahdavi, A.; Safdarian, L.; Fallahi, P.; Mohajeri, M.R.; Abbasi, M.; Esfahani, F.
Predictive value of the level of vitamin D in follicular fluid on the outcome of assisted reproductive technology.
Eur. J. Obstet. Gynecol. Reprod. Biol. 2011, 159, 132–137. [CrossRef] [PubMed]
30. Firouzabadi, R.D.; Rahmani, E.; Rahsepar, M.; Firouzabadi, M.M. Value of follicular fluid vitamin D in
predicting the pregnancy rate in an IVF program. Arch. Gynecol. Obstet. 2014, 289, 201–206. [CrossRef]
[PubMed]
31. Estes, S.J.; Ye, B.; Qiu, W.; Cramer, D.; Hornstein, M.D.; Missmer, S.A. A proteomic analysis of IVF follicular
fluid in women ≤32 years old. Fertil Steril. 2009, 92, 1569–1578.
32. Ciepiela, P.; Dul˛eba, A.J.; Kowaleczko, E.; Chełstowski, K.; Kurzawa, R. Vitamin D as a follicular marker of
human oocyte quality and a serum marker of in vitro fertilization outcome. J. Assist. Reprod. Genet. 2018, 35,
1265–1276. [CrossRef]
33. Skrobot, A.; Demkow, U.; Wachowska, M. Immunomodulatory Role of Vitamin D: A Review. Adv. Exp. Med.
Biol. 2018, 1108, 13–23. [PubMed]
© 2019 by the authors. Licensee MDPI, Basel, Switzerland. This article is an open access
article distributed under the terms and conditions of the Creative Commons Attribution
(CC BY) license (http://creativecommons.org/licenses/by/4.0/).You can also read