A HIGH-THROUGHPUT ELECTROCHEMILUMINESCENCE 7-PLEX ASSAY SIMULTANEOUSLY SCREENING FOR TYPE 1 DIABETES AND MULTIPLE AUTOIMMUNE DISEASES - JOVE
←
→
Page content transcription
If your browser does not render page correctly, please read the page content below
Journal of Visualized Experiments                                                                                                        www.jove.com

Video Article
A High-Throughput Electrochemiluminescence 7-Plex Assay Simultaneously
Screening for Type 1 Diabetes and Multiple Autoimmune Diseases
                1,2           1,3          1              1            1
Xiaofan Jia* , Ling He* , Yong Gu , Hilary High , Liping Yu
1
    Barbara Davis Center for Diabetes, University of Colorado School of Medicine
2
    Department of Endocrinology, Beijing Hospital, National Center of Gerontology; Institute of Geriatric Medicine, Chinese Academy of Medical Sciences
3
    Department of endocrinology, Guangzhou First People's Hospital, School of Medicine, South China University of Technology
*
    These authors contributed equally

Correspondence to: Liping Yu at LIPING.YU@cuanschutz.edu

URL: https://www.jove.com/video/61160
DOI: doi:10.3791/61160
Keywords: Medicine, Issue 159, electrochemiluminescence assay, multiplex autoantibody assay, type 1 diabetes, autoimmune disease, screening,
prediction
Date Published: 5/29/2020
Citation: Jia, X., He, L., Gu, Y., High, H., Yu, L. A High-Throughput Electrochemiluminescence 7-Plex Assay Simultaneously Screening for Type 1
Diabetes and Multiple Autoimmune Diseases. J. Vis. Exp. (159), e61160, doi:10.3791/61160 (2020).

Abstract
      Islet autoantibodies (IAbs) are widely used in type 1 diabetes (T1D) diagnosis and prediction. Four major IAbs to insulin (IAA), glutamate
      decarboxylase-65 (GADA), insulinoma antigen-2 (IA-2A), and zinc transporter-8 (ZnT8A) are equally important in disease prediction. Presently,
      up to 40% of patients diagnosed with T1D go on to develop other autoimmune disorders. Unfortunately, current screening methods using a
      single autoantibody for measurement are laborious and inefficient for large scale screening studies. We recently developed a simple multiplexed
      electrochemiluminescence (ECL) assay to address these current issues. The assay combines all 7 autoantibody tests into one well. Each well
      includes three IAbs (IAA, GADA, and IA-2A), autoantibodies to thyroid peroxidase (TPOA) and thyroid globulin (ThGA) to detect autoimmune
      thyroid disease, autoantibodies to tissue transglutaminase (TGA) for celiac disease, and autoantibodies to interferon alpha (IFNαA) for
      autoimmune polyglandular syndrome-1 (APS-1); all of which screen for T1D and other relevant autoimmune diseases, simultaneously. The
      multiplex ECL assay is based on the single ECL assay platform, but instead uses the multiplex plate combining multiple autoantibody assays,
      up to 10, into a single well. The main difference from the single ECL assay is that each antibody-antigen complex formed in the fluid-phase
      is restrained onto a specific spot on each well through a linker system on the multiplex plate. The 7-Plex ECL assay, in the present study, is
      validated against standard radio-binding assays (RBA) and single ECL assays, using a large cohort of newly diagnosed T1D patients and age-
      matched healthy controls, resulting in excellent assay sensitivity and specificity.

Introduction
      Type 1 diabetes (T1D) is a serious chronic disease that is most common at the childhood. Currently, around 1.4 million people have the T1D in
      the United States; strikingly, the incidence of T1D is steadily increasing at 3-5% each year worldwide and has doubled in the last two decades,
                                    1,2
      especially in young children . Islet autoantibodies (IAbs) in blood circulation are the most reliable biomarker at present. The IAbs may appear
                                           3
      years before clinical T1D develops . Currently, four major IAbs are widely used in T1D diagnosis and risk screening including autoantibodies to
      insulin (IAA), glutamate decarboxylase-65 (GADA), insulinoma antigen-2 (IA-2A), and zinc transporter-8 (ZnT8A). These four IAbs are equally
      important in prediction of T1D development. The classification of T1D has been re-defined recently as the presence of ≥2 of any 4 IAbs with a
                                                           4
      normal glucose metabolism as the disease stage 1 .

      In the Diabetes Autoimmunity Study in the Young (DAISY), it was revealed that one in four children at risk for T1D were likely to progress to islet,
      celiac, thyroid or rheumatoid autoimmunity and more strikingly, approximately 40% of patients who have been diagnosed with T1D eventually
                                                     5,6,7
      develop an additional autoimmune condition          . Identification of autoantibodies are essential for prediction and diagnosis of these autoimmune
      diseases and should provide better clinical care for patients. There is no easy and inexpensive way at present to screen for these multiple
      autoimmune conditions. Current screening methods using standard radio-binding assay (RBA), with a single autoantibody measurement, are
      laborious and inefficient for a largescale screening.

      Here, we will be describing the newly developed simple multiplexed ECL assay, which we have authenticated using a single ECL assay
               8,9,10,11
      platform          . The multiplex ECL assay combines 7 autoantibody tests into a single well, using only 15 µL of serum, and is capable of
      screening for T1D and multiple relevant autoimmune diseases simultaneously including celiac disease, autoimmune thyroid disease, and APS-1.
      A ZnT8A ECL assay had not been developed at the time and was not included in the multiplexed assay. The multiplex ECL assay provides an
      excellent tool for high throughput in general population screening for T1D and multiple autoimmune diseases.

Protocol
      The research protocol was approved by the Colorado Multiple Institutional Review Board.

Copyright © 2020 Creative Commons Attribution-NonCommercial-NoDerivs 3.0 Unported                                          May 2020 | 159 | e61160 | Page 1 of 11
License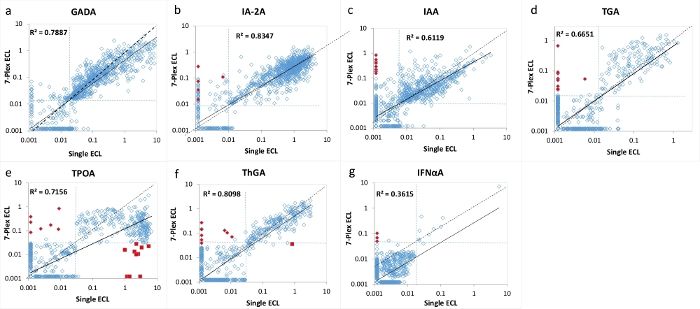
Journal of Visualized Experiments                                                                                         www.jove.com

1. Buffer preparation
  1. Make the labeling buffer (2x PBS, pH 7.9). Using 400 mL of distilled deionized (DD) water, add 100 mL of 10x PBS. To adjust the pH of the
     solution, add NaOH until it reaches 7.9.
  2. Create 3 mM biotin by dissolving 1 mg of biotin into 588 µL of labeling buffer previously created. Make 3 mM Ru Sulfo-NHS by dissolving 150
     nmol of Ru Sulfo-NHS into 50 µL of labeling buffer.
  3. Make the antigen buffer (1% BSA) by taking 500 mL of 1x PBS and adding 5 g of bovine serum albumin (BSA) to the solution. Prepare 0.5 M
     of acetic acid solution. Prepare 1 M Tris-HCl buffer using Trizma Base and adjusting the pH to 9.0.
  4. For the coating buffer (3% Blocker A), take 500 mL of 1x PBS and add 15 g of Blocker A. Prepare the washing buffer (0.05 % Tween 20,
     PBST) by mixing 5000 mL of 1x PBS with 2.5 mL of Tween 20. Create reading buffer (2x Read Buffer T with surfactant) by adding 500 mL of
     DD water and 500 mL of 4x Read Buffer T with Surfactant.
     NOTE: To keep consistency between assays it is important that both the biotin and Ru Sulfo-NHS solutions are created just before the
     labeling procedure and are not created and stored for future use.

2. Labeling each antigen protein with biotin and Ru Sulfo-NHS separately
  NOTE: To have a more effective labeling reaction, use an antigen protein concentration of ≥0.5 mg/mL.

  1. Calculate the molar number of each antigen protein and the molar numbers of the biotin and Ru Sulfo-NHS. Add a proper amount of biotin or
     Ru Sulfo-NHS to antigen protein for labeling reaction according to the molar ratio of antigen protein to biotin or Ru Sulfo-NHS.
       1. For the antigen that has the smaller molecular weight (≤10 kDa), such as proinsulin protein, use a molar ratio of 1:5 (antigen: biotin and
           Ru Sulfo-NHS). For the antigen that has the larger molecular weight (>50 kDa), such as GAD protein, use a molar ratio of 1:20. For the
           antigen that has a middle molecular weight (10-50 kDa), use a molar ratio adjusted between 1:5-1:20.

  2. For both the biotin and Ru Sulfo-NHS, divide each antigen weight by their corresponding molecular weights to get the antigen molar number
     for each one. Divide the molar number by the concentration to get the volume for biotin. Repeat this for Ru Sulfo-NHS.
  3. Mix the antigen protein with biotin using the proper molar ratio, determined in step 2.2. Then do the same for Ru Sulfo-NHS.
     NOTE: For efficiency of labeling reaction, any reducing chemicals like Tris or glycine in the buffer system need to be exchanged to 2x PBS
     buffer, pH 7.9 by the sizing spin column. The labeling protocols for biotin and Ru Sulfo-NHS are identical.
  4. Cover the reaction tubes with aluminum foil and incubate them at room temperature (RT) for 1 h. The reason covering the reaction tubes with
     foil is because both biotin and Ru Sulfo-NHS reagents are light sensitive.
  5. Prime the 2 mL or 5 mL spin column while the reaction tubes are incubating (the size of spin column is determined by the volume uploaded
     onto the column). Fill the spin column with 2x PBS buffer and then centrifuge it at 1,000 x g for 2 min each time, for a total of three times.
  6. Stop the labeling reaction after the reaction tubes have finished incubating. To stop the reaction, purify the labeled antigen protein by passing
     it through the spin column once. Then centrifuge the column at 1,000 x g for 2 min.
  7. Calculate the total labeled antigen concentration by dividing the amount of antigen protein present by the final volume. Aliquot 50 µL of the
     purified labeled antigen protein per tube and store the aliquots at -80 °C for long term use.
     NOTE: It is important to be aware that for every time the spin column passes the antigen protein through, there will be about a 90-95%
     retention rate.

3. Define the best concentration and ratios for the two labeled antigens for the assay
(checkerboard assay)
  NOTE: Since the ECL-IAA assay in this 7-Plex assay requires acid treatment of serum samples, the checkerboard assay for each antigen has to
  go through this step before incubating with the labeled antigen mixture.

  1. Apply the checkerboard assay for each antigen separately before running the multiplex assay. Steps 3.2-3.6 will use GAD65 as an example.
  2. Calculate dilution of labeled GAD65 protein. The recommended targeted concentration of the first mixture solution of biotinylated GAD65 is
     2000 ng/mL and Ru Sulfo-NHS labeled GAD65 is 1000 ng/mL. If the concentration of both biotinylated and Ru Sulfo-NHS labeled GAD65 in
     stock solution are 1.0 µg/µL, the volume needed for biotinylated GAD65 in 560 µL of working solution will be 1.12 µL, and the volume needed
     for Ru Sulfo-NHS labeled GAD65 in 700 µL of working solution will be 0.7 µL.
  3. Mix 1.12 µL of biotinylated GAD65 protein with 240 µL of streptavidin-conjugated linker 1 in one tube and 160 µL of 1% BSA. Incubate the
     mixture at room temperature for 30 min. Add 160 µL of stop solution to the tube and incubate the mixture at room temperature for another 30
     min.
  4. Make a serial dilution. Take 280 µL of the mixture to a new tube and add 280 µL of stop solution to make a 1:2 dilution. Prepare several new
                                                                                                                                    12
     tubes. Repeat this step to run a horizontal serial dilution for biotin labeled GAD65 antigen (refer to the previous publication ).
  5. Mix 0.7 µL of Ru Sulfo-NHS labeled GAD65 (1 µg/µL) protein with 700 µL of stop solution. Then take 350 µL of the mixture to a new tube and
     add 350 µL of stop solution to make a 1:2 dilution. Prepare several new tubes, repeat this step to run a vertical serial dilution for Ru Sulfo-
     NHS labeled GAD65 antigen.
  6. Prepare two serum samples, one sample highly positive for GADA and one sample negative for GADA, each having a volume of 0.75 mL.
     Aliquot 15 µL of positive serum into every well on the left half of the 96-well PCR plate. Aliquot 15 µL of negative serum into every well on the
     right half of the 96-well PCR plate.
  7. Add 18 µL of 0.5 M acetic acid into each well and mix. Incubate for 45 min at RT. Prepare a new 96-well PCR plate. Add 17.5 µL of the
     biotin labeled antigen and 17.5 µL of the Ru Sulfo-NHS labeled antigen into each well according to the serial dilutions (refer to the previous
                 12
     publication ).
  8. Continue the rest of the assay steps described in step 5.2 through 9.1.

Copyright © 2020 Creative Commons Attribution-NonCommercial-NoDerivs 3.0 Unported                            May 2020 | 159 | e61160 | Page 2 of 11
License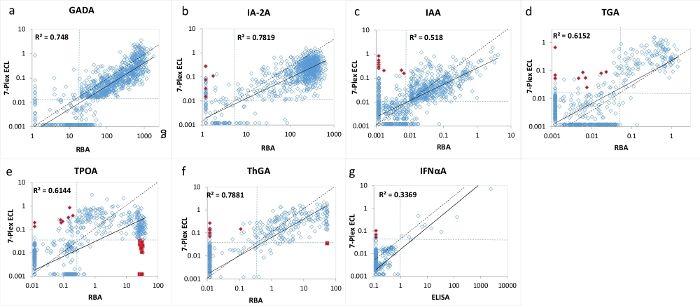
Journal of Visualized Experiments                                                                                             www.jove.com

  9. Determine the signal ratio from the high positive samples against the corresponding negative sample signals. Select the best concentration
     for the Biotin labeled antigen and the Ru Sulfo-NHS labeled antigen by identifying the point that has the highest or near to the highest ratio of
     positive to negative signal. In this ratio calculation, consider the low background signal obtained from the negative samples.
     NOTE: The optimal concentrations of Ru Sulfo-NHS and biotin labeled antigen proteins from checkerboard assays are shown below: 30 ng/
     mL and 200 ng/mL for GAD65, 120 ng/mL and 120 ng/mL for proinsulin, 10 ng/mL and 42 ng/mL for IA-2, 80 ng/mL and 80 ng/mL for TG, 8
     ng/mL and 16 ng/mL for TPO, 31 ng/mL and 31 ng/mL for ThG, and 12 ng/mL and 12 ng/mL for IFNα.

4. Create the mixed linker-coupled antigen solution
  1. Select the optimal concentration for each antigen based on the checkerboard assay. Dilute the biotin and Ru Sulfo-NHS labeled antigen to
     the rational working concentration.
  2. Bind different linkers to each of the uniquely biotinylated antigen proteins. For one 96-well plate assay, mix 4 µL of biotinylated GAD65, TPO,
     tTG, ThG, proinsulin, IFN-α and IA-2 protein with 240 µL of streptavidin-conjugated linker 1, 2, 3, 4, 8, 9 and 10 into separate tube (Figure 1).
     Then add 156 µL of PBS/1% BSA per tube. Incubate the mixture at room temperature for 30 min.
  3. Add 160 µL of stop solution into each tube and incubate them at room temperature for another 30 min. Take 400 µL of linker-coupled antigen
     from each tube, and combine all 7 antigens together. Add 1.2 mL of stop solution and then add 4 µL of Ru Sulfo-NHS labeled GAD65, TPO,
     tTG, ThG, proinsulin, IFN-α and IA-2 antigen to the mixture. Now the antigen solution is ready to be used in the assay.

5. Incubate serum samples with the labeled antigen
  NOTE: Since the ECL-IAA assay in this 7-Plex assay requires acid treatment of serum samples, each serum requires the acid treatment step
  before incubating with labeled antigen mixture for this 7-Plex assay.

  1. Aliquot 15 µL of serum per well for a 96-well PCR plate. Add 18 µL of 0.5 M acetic acid into each well and mix. Incubate for 45 min at RT.
     Prepare a new 96-well PCR plate and aliquot 35 µL of antigen solution into each well.
  2. While the plate is still incubating, add 13 µL of 1 M Tris pH 9.0 buffer to every well in the antigen plate. Add buffer to the side of each well to
     limit the mixing of Tris buffer and antigen. After incubation is complete, take 25 µL of the acid treated serum, and immediately pipette it into
     every well on the antigen plate. Agitate the solution and cover the plate with PCR sealing foil to avoid light exposure.
  3. At RT, put the plate on a shaker, set at a low speed, for 1 h. Afterwards, store the plate at 4 °C and let the plate incubate for 18-24 h.

6. Prepare the multiplex plate
  1. Take a multiplex plate from the 4 °C refrigerator and allow the plate to come to RT. Once the multiplex plate is at RT, add 150 µL of 3%
     Blocker A to each well. Cover the multiplex plate with sealing foil. Incubate the plate in a 4 °C refrigerator overnight.
     NOTE: Assay Day 1 includes Steps 4 through 6.

7. Transfer serum/antigen incubates into the multiplex plate
  1. The following day, place paper towels on the table and take the incubating multiplex plate from the refrigerator. Empty all of the buffer out of
     the plate. To do this, flip the plate upside down and pat it onto the prepared paper towels until there is no buffer present in any of the wells.
  2. Wash the multiplex plate by adding 150 µL of PBST into every well. Discard the buffer, as mention in step 7.1., and repeat this step three
     times. Add 30 µL of serum/antigen incubates into every well in the multiplex plate. Cover the plate with foil to limit its exposure to light. Place
     the plate on a plate shaker, set to a low speed, at RT for 1 h.

8. Wash the plate and add read buffer
  1. Remove the serum/antigen incubates from the multiplex plate by holding the plate upside down and flicking out the solution. Add 150 µL of
     PBST into all of the wells and remove the buffer from the plate by again holding the plate upside down and flicking out the solution. Repeat
     this step three times. After the third wash is complete, add 150 µL of Reading buffer into each well.
     NOTE: Air bubbles interfere with the plate reader machine’s ability to accurately analyze the plate’s results and should be avoided at all costs.

9. Read the plate and analyze data
  1. Count the prepared plate on the plate reader machine, reading all of the values in counts per second (CPS).
  2. Calculate the relative index for the assay, using the antibody levels obtained from the plate reader machine, with the following equation:
     Index value = [CPS (sample) - CPS (negative standard)] / [CPS (positive standard) - CPS (negative standard)].
  3. Determine which antibody results are negative or positive using the cut-offs that have been established.
     NOTE: Assay Day 2 includes Steps 7 through 9.

Representative Results
  Analysis of assay results was shown in Table 1, Table 2 and Table 3. Reading values come from the data from the 10 spots within the same
  well. Index values for each sample were calculated against their corresponding internal positive and negative controls as described in the assay
  protocol. Examples of bad duplicates are shown in Table 1 and caused the final index calculation error in Table 3. All raw counting values must
  be checked to avoid any false positive or false negative results.

Copyright © 2020 Creative Commons Attribution-NonCommercial-NoDerivs 3.0 Unported                               May 2020 | 159 | e61160 | Page 3 of 11
License
Journal of Visualized Experiments www.jove.com
The 7-multiplexed ECL assay was validated using a large cohort of samples from 1026 newly diagnosed patients with T1D and 1022 age and
sex matched healthy control subjects. The levels of autoantibodies from 7-Plex ECL assay for 1026 T1D patients were compared with the levels
from each of our corresponding established single ECL assays as shown in Figure 2 and from each corresponding single standard RBA and
th
ELISA as shown in Figure 3. The assay specificities were set up identical at 99 percentiles for all autoantibody assays except for thyroid
autoantibodies (where the 95th percentile was used), of 1022 healthy controls for all three assay methods (7-Plex ECL, single ECL, RBA or
ELISA) as listed in Table 4. The inter-assay CVs of GADA, IA-2A, IAA, TPOA, ThGA, TGA, and IFNαA are 6.4%, 4.5%, 9.1%, 4.9%, 5.7%,
11.3% and 5.9%, respectively.
A small number of discordant samples for each of the 7 autoantibodies were found around the borderline of cut-offs for each assays (Figure 2
and Figure 3). Eleven control samples (11/1022, 1.1%) were found multiple autoantibody positive only in the 7-Plex assay and negative in each
corresponding single assay. Similarly, it happened in 9 samples of the T1D patients (9/1026, 0.9%). In addition, 10 high positive TPOA and one
ThGA in patient cohort that were seen in both the single ECL assay and RBA were missed in the 7-Plex assay. These samples were converted
positive in the 7-Plex assay when they were further diluted. In general, 100% of positivity in single ECL assay or RBA were covered in the 7-Plex
ECL assay, with the same assay specificity as illustrated in Table 4.
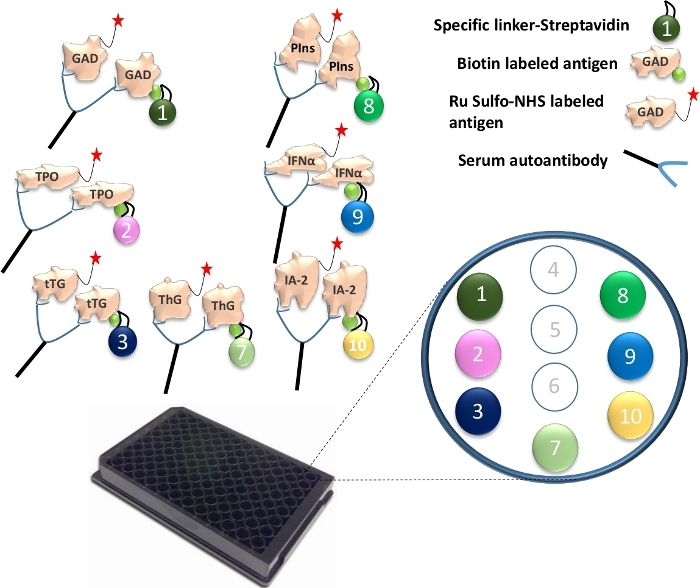
Figure 1: Illustration of the Mutiplex ECL assay.
Autoantibodies in serum will bridge the Ru Sulfo-NHSged antigen to the biotinylated antigen. This is coupled with a specific linker to form a
complex of antigen-antibody-antigen-linker. The complexes are captured onto the plate and are restrained to their specific spots through each
specific linker. The specifically coupled linker numbers, for the 7 different antigen proteins, are illustrated. Detection of antibody signals are
13
accomplished using Ru Sulfo-NHS labeled antigens with electrochemiluminescence. The figure is from Gu, Y. et al. . Please click here to view a
larger version of this figure.
Copyright © 2020 Creative Commons Attribution-NonCommercial-NoDerivs 3.0 Unported May 2020 | 159 | e61160 | Page 4 of 11
LicenseJournal of Visualized Experiments www.jove.com
Figure 2: Comparison of 7 autoantibody levels in 1026 new onset patients with T1D between the single ECL assay and the 7-Plex ECL
assay.
Panels a, b, c, d, e, f, and g display comparisons of autoantibody levels for GADA, IA-2A, IAA, TGA, TPOA, ThGA, and IFNαA, respectively. The
th
dotted lines represent the assay cut-offs for each autoantibody assay. The cut-offs were set to the 99 percentile of 1022 age-matched healthy
th
controls for each assay (except for TPOA and ThGA which were set to the 95 percentile), as shown in Table 4, from 1022 age matched healthy
controls for both single and multiplex ECL assays. Red closed diamonds are marked as ‘false’ positives in the 7-Plex ECL assay,Journal of Visualized Experiments www.jove.com
1 2 3 4 5 6
A 5580 5674 105 117 125 139 linker-1
100 108 102 102 3956 3745 linker-2
115 124 107 116 113 124 linker-3
67 64 68 61 65 69 linker-4
89 87 98 92 90 80 linker-5
87 71 89 87 61 72 linker-6
94 82 79 85 2154 2280 linker-7
75 66 1628 1594 81 83 linker-8
98 103 71 84 69 85 linker-9
102 118 93 98 113 99 linker-10
B 324 337 147 148 5426 5366 linker-1
101 102 93 88 86 74 linker-2
111 119 119 123 66 72 linker-3
72 65 59 68 74 67 linker-4
81 98 83 92 79 72 linker-5
90 84 93 86 70 76 linker-6
101 105 101 97 956 944 linker-7
82 83 189 204 97 90 linker-8
92 83 78 64 82 78 linker-9
83 79 88 93 4722 4965 linker-10
C 110 110 87 81 2114 2365 linker-1
5526 5680 88 70 86 93 linker-2
114 132 67 71 3326 3284 linker-3
64 62 88 74 64 80 linker-4
94 82 86 75 89 76 linker-5
77 87 75 63 70 86 linker-6
77 86 71 84 138 121 linker-7
73 86 80 79 59 73 linker-8
86 74 5064 4923 88 86 linker-9
105 113 85 80 124 114 linker-10
D 98 88 92 84 136 127 linker-1
288 291 86 86 558 564 linker-2
109 101 74 73 141 127 linker-3
78 66 66 55 74 66 linker-4
79 83 79 86 96 91 linker-5
83 86 96 89 86 73 linker-6
87 89 77 87 841 855 linker-7
74 72 60 72 90 95 linker-8
68 75 331 328 2460 2580 linker-9
86 98 80 75 123 133 linker-10
E 101 114 101 106 532 548 linker-1
101 96 110 104 682 675 linker-2
6015 5988 124 126 101 98 linker-3
Copyright © 2020 Creative Commons Attribution-NonCommercial-NoDerivs 3.0 Unported May 2020 | 159 | e61160 | Page 6 of 11
LicenseJournal of Visualized Experiments www.jove.com
66 71 82 71 80 62 linker-4
102 97 99 80 83 110 linker-5
82 67 81 80 60 85 linker-6
85 95 52 84 245 221 linker-7
72 78 82 74 486 503 linker-8
77 97 97 77 56 66 linker-9
114 104 5726 5814 259 253 linker-10
F 119 120 133 118 112 96 linker-1
101 91 100 95 96 82 linker-2
406 395 111 123 2127 101 linker-3
72 60 86 72 79 83 linker-4
76 85 96 99 89 103 linker-5
88 78 91 83 89 95 linker-6
104 97 87 102 56 66 linker-7
76 77 79 93 69 75 linker-8
85 71 95 100 83 71 linker-9
131 131 358 364 92 86 linker-10
G 90 95 85 82 105 107 linker-1
99 86 77 76 1250 1174 linker-2
119 123 120 118 112 108 linker-3
76 83 77 80 86 76 linker-4
88 86 86 93 107 92 linker-5
73 73 71 82 84 75 linker-6
5210 5173 72 69 76 85 linker-7
80 81 79 82 100 101 linker-8
96 97 89 83 65 83 linker-9
98 103 86 88 1933 1979 linker-10
H 114 124 81 86 299 295 linker-1
107 92 69 72 4256 4388 linker-2
114 123 125 129 501 536 linker-3
77 70 67 64 74 62 linker-4
92 110 81 84 77 71 linker-5
87 79 72 76 83 81 linker-6
328 341 84 80 88 97 linker-7
75 84 75 90 74 83 linker-8
73 79 78 76 84 70 linker-9
113 120 81 76 2372 2350 linker-10
Table 1: Analysis of 7-plex ECL assay: raw CPS counts (left half of the plate). Raw CPS counts are acquired from an assay plate (the left
half of the plate) and each sample is performed in duplicate. Under each row of the plate (A-H), there are 10 lines of reading values representing
the data from the 10 spots within the same well, corresponding to each linker number as marked. Examples of bad duplicates are highlighted in
grey, as seen in row F-linker 3-columns 5 and 6.
Copyright © 2020 Creative Commons Attribution-NonCommercial-NoDerivs 3.0 Unported May 2020 | 159 | e61160 | Page 7 of 11
LicenseJournal of Visualized Experiments www.jove.com
Row of Column of linker 1 linker 2 linker 3 linker 7 linker 8 linker 9 linker 10
Table 1A Table 1A
A 1-2 GADA PC 5627 104 120 88 71 101 110
B 1-2 GADA Low 331 102 115 103 83 88 81
PC
C 1-2 TPOA PC 110 5603 123 82 80 80 109
D 1-2 TPOA Low 93 290 105 88 73 72 92
PC
E 1-2 TGA PC 108 99 6002 90 75 87 109
F 1-2 TG Low PC 120 96 401 101 77 78 131
G 1-2 ThGA PC 93 93 121 5192 81 97 101
H 1-2 ThGA Low 119 100 119 335 80 76 117
PC
A 3-4 IAA PC 111 102 112 82 1611 78 96
B 3-4 IAA Low PC 148 91 121 99 197 71 91
C 3-4 IFNaA PC 84 79 69 78 80 4994 83
D 3-4 IFNaA Low 88 86 74 82 66 330 78
PC
E 3-4 IA-2A PC 104 107 125 68 78 87 5770
F 3-4 IA-2A Low 126 98 117 95 86 98 361
PC
G 3-4 NC 84 77 119 71 81 86 87
H 3-4 NC 84 71 127 82 78 77 79
A 5-6 sample1 132 3851 119 2217 82 77 106
B 5-6 sample2 5396 80 69 950 94 80 4844
C 5-6 sample3 2240 90 3305 130 66 87 119
D 5-6 sample4 132 561 134 848 93 2520 128
E 5-6 sample5 540 679 100 233 495 61 256
F 5-6 sample6 104 89 1114 61 72 77 89
G 5-6 sample7 106 1212 110 81 101 74 1957
H 5-6 sample8 297 4322 519 93 79 77 2361
Table 2: Analysis of 7-plex ECL assay: arrangement of the Table 1 data, marked as 7 linkers. The data from Table 1 were rearranged, with
linkers 4 through 6 (not used) deleted, and mean values were calculated from each duplicate reading from Table 1. The values of the internal
standard high and low positive controls, corresponding to each autoantibody assay, restrained by a particular linker, are in dark bold. PC, positive
control. NC, normal control.
Copyright © 2020 Creative Commons Attribution-NonCommercial-NoDerivs 3.0 Unported May 2020 | 159 | e61160 | Page 8 of 11
LicenseJournal of Visualized Experiments www.jove.com
GAD-Index TPOA-Index TGA-Index ThGA-Index IAA-Index IFNaA-Index IA-2A-Index
GADA PC 1.000 0.005 0.000 0.003 -0.006 0.003 0.004
GADA Low PC 0.045 0.005 -0.001 0.006 0.002 0.000 -0.001
IAA PC 0.005 1.000 0.001 0.002 -0.001 -0.001 0.004
IAA Low PC 0.002 0.039 -0.002 0.003 -0.005 -0.003 0.001
IA-2A PC 0.004 0.004 1.000 0.004 -0.004 0.000 0.004
IA-2A Low PC 0.007 0.004 0.048 0.006 -0.002 -0.002 0.008
TGA PC 0.002 0.003 0.000 1.000 0.000 0.002 0.002
TG Low PC 0.006 0.004 0.000 0.052 -0.001 -0.002 0.005
TPOA PC 0.005 0.005 -0.001 0.002 1.000 -0.002 0.001
TPOA Low PC 0.012 0.003 0.000 0.006 0.076 -0.003 0.001
ThGA PC 0.000 0.000 -0.008 0.001 0.000 1.000 -0.001
ThGA Low PC 0.001 0.002 -0.008 0.002 -0.009 0.050 -0.002
IFNaA PC 0.004 0.006 0.001 0.000 -0.002 0.000 1.000
IFNaA Low PC 0.008 0.004 0.000 0.005 0.004 0.002 0.048
NC 0.000 0.000 0.000 0.000 0.000 0.000 0.000
NC 0.000 -0.001 0.001 0.002 -0.002 -0.002 -0.001
sample1 0.009 0.683 0.000 0.419 0.001 -0.002 0.003
sample2 0.958 0.001 -0.008 0.172 0.009 -0.001 0.837
sample3 0.389 0.002 0.542 0.012 -0.009 0.000 0.006
sample4 0.009 0.088 0.003 0.152 0.008 0.496 0.007
sample5 0.082 0.109 -0.003 0.032 0.271 -0.005 0.030
sample6 0.004 0.002 0.169 -0.002 -0.006 -0.002 0.000
sample7 0.004 0.205 -0.002 0.002 0.013 -0.002 0.329
sample8 0.039 0.768 0.068 0.004 -0.001 -0.002 0.400
Table 3: Analysis of 7-plex ECL assay: results of index values. Index values for each sample for all 7 autoantibody assays were calculated
against their corresponding internal positive and negative controls as described in the assay protocol. Any index value that was greater than
the cut-off value was defined as a positive result, shown in dark bold. The TGA-index value of sample6 was highlighted in grey as it’s an error
caused by bad duplicates shown in row F-linker 3-columns 5 and 6 in Table 1.
GADA IA-2A IAA TGA TPOA ThGA IFNαA*
Sens Spec Sens Spec Sens Spec Sens Spec Sens Spec Sens Spec Sens Spec
RBA 73.4% 98.5% 75.2% 99.0% 47.7% 99.1% 12.9% 99.0% 23.9% 95.2% 19.3% 94.7% 1.0% 99.6%
Single 71.6% 99.1% 73.6% 99.3% 48.3% 99.7% 16.0% 98.9% 26.3% 94.9% 20.6% 95.1% 0.8% 99.2%
ECL
7-Plex 71.2% 98.9% 77.3% 98.9% 49.5% 98.9% 16.5% 98.7% 26.1% 94.7% 21.1% 94.7% 1.7% 99.1%
ECL
Table 4: Assay sensitivity and specificity among 1026 T1D patients and 1022 controls, matched for both age and sex, in a 7-plex ECL
assay, compared to the corresponding single ECL assay and RBA or ELISA*. Three different assays (RBA, single ECL and 7-Plex ECL) for
each autoantibody were set to similar specificities using the 1022 age and sex matched healthy controls. The specificity outcome from the control
cohort studied was set around 95% for TPOA and ThGA and at 99% for the 5 other assays. *Asterisk marks the IFNαA assay for ELISA, while
others are RBA.
Discussion
In numerous national and international clinical trials for type 1 diabetes, the performance of the single ECL assay to detect islet autoantibodies
8,9,10,11
and autoantibodies to transglutaminase (TGA) for celiac disease, has been substantiated . Throughout these trails, this assay has
increased the sensitivity and specificity for autoantigen detection when assessed against the existing ‘gold’ standard RBA. The enhanced
disease specificity can be viewed when discriminating high-affinity and high-risk islet autoantibodies from low-risk, low-affinity signals, between
14,15,16,17
the single ECL assay and the RBA . Building on the single ECL assay, we pose a new high throughput multiplexed ECL autoantibody
assay, to enable us to screen for T1D as well as several applicable autoimmune diseases at the same time.
Copyright © 2020 Creative Commons Attribution-NonCommercial-NoDerivs 3.0 Unported May 2020 | 159 | e61160 | Page 9 of 11
LicenseJournal of Visualized Experiments www.jove.com
The multiplex ECL assay uses the multiplex plate, which can combine up to 10 autoantibody assays into one single well. For the present study,
7 autoantibody assays are combined together. The autoantibodies comprise of 3 IAbs (IAA, GADA, and IA-2A), 2 autoimmune thyroid disease
autoantibodies (TPOA and ThGA), celiac disease autoantibodies (TGA), and APS-1 autoantibodies to interferon alpha (IFNαA). The assay
9,10,12,18
mechanism is, in general, based on a single ECL assay as previously published with some modifications. The main difference of a
multiplex ECL assay from a single ECL assay is that each antibody-antigen complex formed in the fluid-phase is restrained to a specific linker
(Figure 1). The biotin labeled antigen is incubated with the Streptavidin conjugated, a linker used to form a specific antigen-linker complex.
Antibody-antigen immune complex forms after incubation with patient serum and is captured onto a specific spot through the specific linker
system on each well of the multiplex plate. Ru Sulfo-NHS labeled antigen captured by antibodies at the same time provides the signal with
electrochemiluminescence. The plate reader machine can detect up to 10 different signals from the spot sources located in each well. To keep
autoantibody assays consistent between plates and while conducting long-term studies, we suggest that the same linker is used.
Before setting up a multiplex ECL assay, single ECL assays for each autoantibody need to be optimized onto a multiplex plate, respectively, and
validated against both RBA and single ECL assays on a regular ECL plate. To enhance the checkerboard assay, to the related autoantibody
assay on the multiplex plate, a high positive patient and a negative patient sample were used. After the checkerboard assay was conducted, the
most ideal concentrations for Ru Sulfo-NHS and biotin labeled antigen where calculated for each of the 7 autoantibody assays. The following
shows these concentrations: 30 ng/mL and 200 ng/mL for GAD65, 120 ng/mL and 120 ng/mL for proinsulin, 10 ng/mL and 42 ng/mL for IA-2,
80 ng/mL and 80 ng/mL for TG, 8 ng/mL and 16 ng/mL for TPO, 31 ng/mL and 31 ng/mL for ThG, and 12 ng/mL and 12 ng/mL respectively for
13
IFNα . The concentrations of some of the antigens from the checkerboard assay may need to be further adjusted according to the outcomes in
the actual multiplex assay after combining all of the assays together.
As IAA is included in the present multiplex ECL assay, acid treatment of serum samples is mandatory before incubating the serum with antigen,
12
as reported in the previous study . Generally, when an extra autoantibody is added to a multiplex assay, the assay background is affected and
an extremely high signal from one spot, in the well, may obstruct the results of nearby spots via crosstalk. Therefore, the maximum CPS needs
to be limited to 20,000 counts for each autoantibody, or lower, for the highest positive samples. From our knowledge, in order to reduce the
amount of crosstalk involved, autoantibodies that have a lower background should be separated, when designing the spot map, far from spots
with a higher frequency of counts.
High positives and negative controls were used internally in every assay to calculate an accurate index for the unknown samples being tested. To
accurately assess and monitor the assay’s sensitivity, low positive controls, set near the assay’s upper limit were used. These standard positive
and negative controls were created in bulk and aliquot for long-term use and stored at -20 °C or below, for consistency between assays. For
quality assurance purposes, samples were run twice in every assay and every positive result was reran and confirmed by running the sample in
a new ECL assay the next day. If there was any disagreement with the first and second confirmatory assay, a third assay was necessary. Of the
three assays conducted, the results of the two assays that agree (e.g., +, + or -,-), determined the final result (positive or negative) of the sample.
In the last decade, many study groups are seeking a high throughput assay utilizing the multiplex method to combine multiple autoantibody
assays together into one well to screen large populations. There are a few studies that are using different types of technologies to conduct
19,20,21,22
multiplex autoantibody assays , but there is no comparison for any of these assays in sensitivity and specificity against the current
‘gold’ standard RBA, when studying T1D. These different types of platforms used are not validated through the international Islet Autoantibody
Standardization Program (IASP) workshop or through testing large cohorts in clinical trials. In a recent general population-based screening
in Germany, a high throughput combined assay, 3 Screen ICATM ELISA distributed by Kronus, is being used as a tool for first line screening
23
to detect three IAbs, GADA, IA-2A, and ZnT8A, to achieve early diagnosis of childhood T1D . The 3-Screen ELISA assay measures 3
autoantibodies either in 3 separated wells, consuming a large volume of serum, or in a single well with all 3 assays mixed. If one well in the 3-
Screen ELISA assay is positive, one is unable to distinguish which of three autoantibodies are present. The biggest disadvantage of this assay is
its inability to include IAA measurement. All IAA results performed by ELISA, as proven in IASP workshops, do not have an acceptable sensitivity
24
and specificity . IAA is usually the first IAb to appear and has a high prevalence among young children. IAb screening, with IAA, is necessary
for children and it is not deemed acceptable to conduct this screening without IAA to asses T1D risk in the community. In addition, there are no
published studies or data that show the Kronus IAb kit assay as being more T1D disease specific and able to discriminate high risk from low risk
13
IAbs. The 7-Plex ECL assay, in the present study, was validated using a large cohort of newly diagnosed patients with T1D . Compared with the
current standard RBA and well-established single ECL assay, the 7-Plex assay is able to retain 100% positivity with the same assay specificity
(Table 4). Currently, the 4-Plex ECL assay, parallel with the standard RBA, is being applied to an ongoing large clinical trial: Autoimmunity
Screening for Kids (ASK) study. This trial screens children in the general population, of the Denver metropolitan area, for T1D and celiac disease.
Compared to standard RBA used in the ASK study, the multiplex ECL assay is showing excellent sensitivity and a higher disease specificity,
25
identical to our previous reports using the single ECL study . Furthermore, our 4-Plex ECL assay demonstrated a pronounced reduction in labor,
cost, and serum volume by 70%, compared to the corresponding 4 single assays for ECL and RBA. Using the multiplexed ECL assay, we can
customize each well with different numbers, representing different autoantibodies (up to 10), to test for different autoimmune diseases that are
specific to the needs of a particular clinical location.
There are some limitations observed, shown in the present study, for a multiplexed ECL assay using the multiplex plate. The final dilution of
serum, incubated with antigen, cannot be adjusted to yield the most optimal conditions for every single autoantibody assay that is combined in
a single well. Nine samples (9/1026), from T1D patients, were observed to have a false negative result for particular autoantibodies. 7 of the
false negatives were for TPOA and 2 were for ThGA, in the 7-Plex ECL assay, but high positive results were exhibited in both the single ECL
assay and the RBA (Figure 2 & 3). After further dilution of all 9 samples, they became positive on the multiplex plate. This result is caused by,
what we describe as the ‘prozone’ phenomenon. This phenomenon causes the sample to show a false negative result because the high antibody
titers are affecting the formation of antigen-antibody lattices. When setting up a multiplex assay, samples with very high titers, for each of the
combined autoantibodies, are recommended to have pre-tests ran to identify the optional dilution of serum for antigen incubation. Alternatively,
autoantibody assays with similar optimized conditions should be selected to form a combined assay from which the best assay sensitivity and
specificity is achieved for each autoantibody. In the present study, 7 samples (7/1022), from healthy normal controls, resulted in false positives
for multiple autoantibodies in the 7-Plex assay, but after running a single ECL assay and RBA (Figure 2 & 3) these autoantibodies were found to
be negative in both assays. The reasons behind these false positive results occurring on the multiplex plate, for these small subset of samples,
Copyright © 2020 Creative Commons Attribution-NonCommercial-NoDerivs 3.0 Unported May 2020 | 159 | e61160 | Page 10 of 11
LicenseJournal of Visualized Experiments www.jove.com
are currently unknown. For the current application of the multiplex ECL assay, all positive samples are repeated with their corresponding single
ECL assay to confirm positivity, which removes this false positive error from the multiplex ECL assay.
Disclosures
The authors have nothing to disclose.
Acknowledgments
This work was supported by NIH grant DK32083, JDRF Grants 2-SRA-2015-51-Q-R and 2-SRA-2018-533-S-B.
References
1. Harjutsalo, V., Sjoberg, L., Tuomilehto, J. Time trends in the incidence of type 1 diabetes in Finnish children: a cohort study. Lancet. 371
(9626), 1777-1782 (2008).
2. Vehik, K. et al. Increasing incidence of type 1 diabetes in 0- to 17-year-old Colorado youth. Diabetes Care. 30 (3), 503-509 (2007).
3. Atkinson, M. A., Eisenbarth, G. S., Michels, A. W. Type 1 diabetes. Lancet. 383 (9911), 69-82 (2014).
4. Insel, R. A. et al. Staging presymptomatic type 1 diabetes: a scientific statement of JDRF, the Endocrine Society, and the American Diabetes
Association. Diabetes Care. 38 (10), 1964-1974 (2015).
5. Barker, J. M. et al. Autoantibody "subspecificity" in type 1 diabetes: risk for organ-specific autoimmunity clusters in distinct groups. Diabetes
Care. 28 (4), 850-855 (2005).
6. Triolo, T. M. et al. Additional Autoimmune Disease Found in 33% of Patients at Type 1 Diabetes Onset. Diabetes Care. 34 (5), 1211-1213
(2011).
7. de Graaff, L. C., Smit, J. W., Radder, J. K. Prevalence and clinical significance of organ-specific autoantibodies in type 1 diabetes mellitus.
Netherlands Journal of Medicine. 65 (7), 235-247 (2007).
8. Yu, L. et al. Proinsulin/Insulin autoantibodies measured with electrochemiluminescent assay are the earliest indicator of prediabetic islet
autoimmunity. Diabetes Care. 36 (8), 2266-2270 (2013).
9. Yu, L. et al. Distinguishing persistent insulin autoantibodies with differential risk: nonradioactive bivalent proinsulin/insulin autoantibody assay.
Diabetes. 61 (1), 179-186 (2012).
10. Miao, D. et al. GAD65 autoantibodies detected by electrochemiluminescence assay identify high risk for type 1 diabetes. Diabetes. 62 (12),
4174-4178 (2013).
11. Gu, Y., Zhao, Z., High, H., Yang, T., Yu, L. Islet Autoantibody Detection by Electrochemiluminescence (ECL) Assay. Journal of Clinical &
Cellular Immunology. 8 (6) (2017).
12. Gu, Y. et al. Electrochemiluminescence Assays for Human Islet Autoantibodies. Journal of Visualized Experiments. 10.3791/57227 (133)
(2018).
13. Gu, Y. et al. High-throughput multiplexed autoantibody detection to screen type 1 diabetes and multiple autoimmune diseases simultaneously.
Ebiomedicine. 47, 365-372 (2019).
14. Dongmei, M., A., K. S., Li, Zh., K. Michelle, G., Ling, J., Taylor, A. Electrochemiluminescence Assays for Insulin and Glutamic Acid
Decarboxylase Autoantibodies Improve Prediction of Type 1 Diabetes Risk. Diabetes Technology & Therapeutics. 17 (2), 119-127 (2015).
15. Steck, A. K. et al. ECL-IAA and ECL-GADA Can Identify High-Risk Single Autoantibody-Positive Relatives in the TrialNet Pathway to
Prevention Study. Diabetes Technology & Therapeutics. 18 (7), 410-414 (2016).
16. Fouts, A. et al. Do Electrochemiluminescence Assays Improve Prediction of Time to Type 1 Diabetes in Autoantibody-Positive TrialNet
Subjects? Diabetes Care. 39 (10), 1738-1744 (2016).
17. Sosenko, J. M. et al. The Use of Electrochemiluminescence Assays to Predict Autoantibody and Glycemic Progression Toward Type 1
Diabetes in Individuals with Single Autoantibodies. Diabetes Technology & Therapeutics. 19 (3), 183-187 (2017).
18. Zhao, Z. et al. Higher Sensitivity and Earlier Identification of Celiac Disease Autoimmunity by a Nonradioactive Assay for Transglutaminase
Autoantibodies. Journal of Immunology Research. 2016, 5 (2016).
19. Zhang, B., Kumar, R. B., Dai, H., Feldman, B. J. A plasmonic chip for biomarker discovery and diagnosis of type 1 diabetes. Nature Medicine.
20 (8), 948-953 (2014).
20. Tsai, C. T., Robinson, P. V., Spencer, C. A., Bertozzi, C. R. Ultrasensitive Antibody Detection by Agglutination-PCR (ADAP). American
Chemical Society Central Science. 2 (3), 139-147 (2016).
21. Yim, S. W. et al. Four-color alternating-laser excitation single-molecule fluorescence spectroscopy for next-generation biodetection assays.
Clinical chemistry. 58 (4), 707-716 (2012).
22. Bale, S. S. et al. A highly sensitive microsphere-based assay for early detection of Type I diabetes. Technology. 02 (03), 200-205 (2014).
23. Ziegler, A. G. et al. 3 Screen ELISA for High-Throughput Detection of Beta Cell Autoantibodies in Capillary Blood. Diabetes Technology &
Therapeutics. 18 (11), 687-693 (2016).
24. Schlosser, M. et al. Diabetes Antibody Standardization Program: evaluation of assays for insulin autoantibodies. Diabetologia. 53 (12),
2611-2620 (2010).
25. Zhao, Z. et al. A multiplex assay combining insulin, GAD, IA-2 and transglutaminase autoantibodies to facilitate screening for pre-type 1
diabetes and celiac disease. Journal of Immunological Methods. 430, 28-32 (2016).
Copyright © 2020 Creative Commons Attribution-NonCommercial-NoDerivs 3.0 Unported May 2020 | 159 | e61160 | Page 11 of 11
LicenseYou can also read