GAZE-BASED JPEG COMPRESSION WITH VARYING QUALITY FACTORS - HENRIK NILSSON - BACHELOR OF SCIENCE IN COMPUTER SCIENCE JUNE 2019 - DIVA
←
→
Page content transcription
If your browser does not render page correctly, please read the page content below
Bachelor of Science in Computer Science
June 2019

    Gaze-based JPEG compression with
          varying quality factors

                               Henrik Nilsson

  Faculty of Computing, Blekinge Institute of Technology, 371 79 Karlskrona, Sweden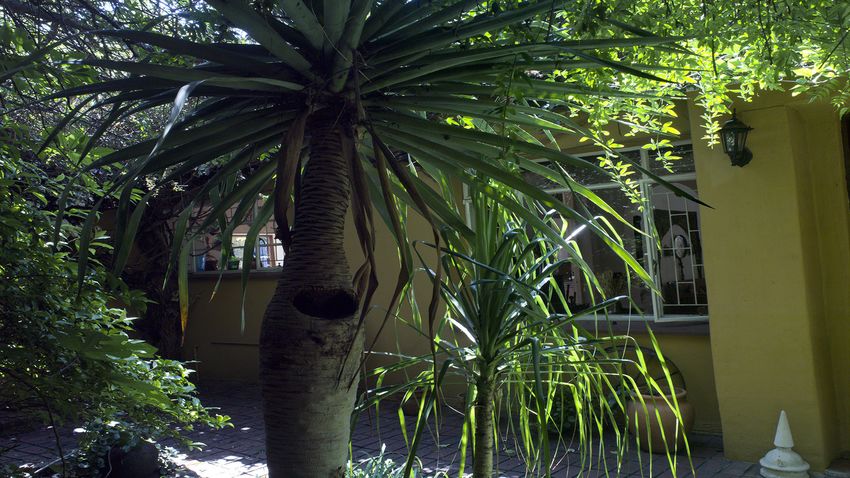
This thesis is submitted to the Faculty of Computing at Blekinge Institute of Technology in
partial fulfilment of the requirements for the degree of Bachelor of Science in Computer Science.
The thesis is equivalent to 20 weeks of full time studies.

The authors declare that they are the sole authors of this thesis and that they have not used
any sources other than those listed in the bibliography and identified as references. They further
declare that they have not submitted this thesis at any other institution to obtain a degree.

Contact Information:
Author(s):
Henrik Nilsson
E-mail: heni16@student.bth.se

University advisor:
Stefan Petersson
Hans Tap
Department of DIDA

Faculty of Computing                               Internet : www.bth.se
Blekinge Institute of Technology                   Phone    : +46 455 38 50 00
SE–371 79 Karlskrona, Sweden                       Fax      : +46 455 38 50 57
Abstract

Background. With the rise of streaming services such as cloud gaming, a fast inter-
net speed is required for the overall experience. The average internet connection is
not suited for the requirements that cloud gaming require. A high quality and frame
rate is important for the experience. A solution to this problem would be to have
parts where the user is looking at in a image be displayed in higher quality compared
to the rest of the image.
Objectives. The objective of this thesis is to create a gaze-based lossy image com-
pression algorithm that reduces quality where the user is not looking. By using
different radial functions to determine the quality decrease, the perceptual quality
is compared to traditional JPEG compression. The storage difference when using a
gaze-based lossy image compression is also compared to the JPEG algorithm.
Methods. A gaze-based image compression algorithm, which is based on the JPEG
algorithm, is developed with DirectX 12. The algorithm uses Tobii eye tracker to
get where the user is gazing at the screen. When the gaze-position is changed the
algorithm is run again to compress the image. A user study is conducted to the test
the perceived quality of this algorithm compared to traditional lossy JPEG image
compression. Two different radial functions are tested with various parameters to
determine which one is offering the best perceived quality. The algorithm is also
tested along with the radial functions on how much of a storage difference there is
when using this algorithm compared to traditional JPEG compression.
Results. With 11 participants, the results show the gaze-based algorithm is per-
ceptually the same on images that have few objects who are close together. Images
with many objects that are spread throughout the image performed worse on the
gaze-based algorithm and was less picked compared traditional JPEG compression.
The radial functions that cover much of the screen is more often picked compared
to other radial functions that have less area of the screen. The storage difference
between the gaze-based algorithm compared to traditional JPEG compression was
between 60% to 80% less depending on the image.
Conclusions. The thesis concludes that there is substantial storage savings that
can be made when using a gaze-based image compression compared to traditional
JPEG compression. Images with few objects who are close together are perceptually
not distinguishable when using the gaze-based algorithm.

Keywords: Perception, Compression, Eye Tracking

Acknowledgments

I would like to thank Stefan Petersson for providing me with the source code and
knowledge needed to get started with JPEG compression on the GPU. I would also
like to thank Hans Tap for his valuable feedback.

                                       iii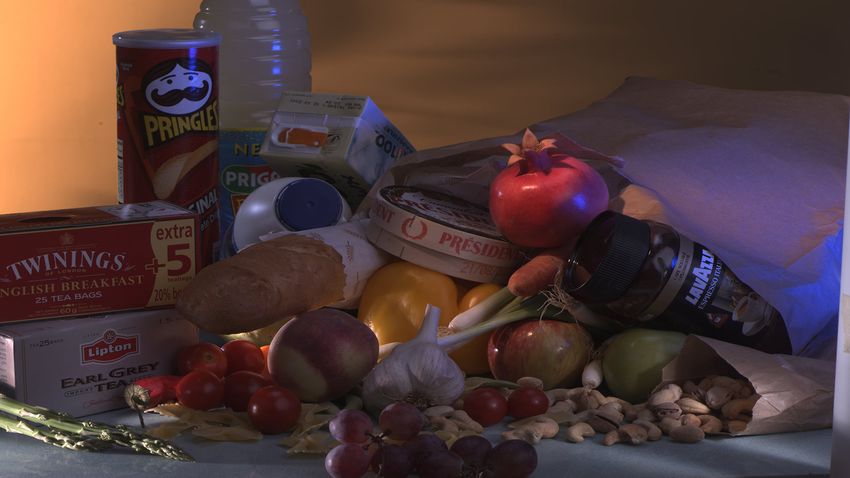
Contents

Abstract                                                                                                                               i

Acknowledgments                                                                                                                      iii

1 Introduction                                                                                                                        1
  1.1 JPEG algorithm . . . . . . . . . . . . . . . . . . . . . . . . . . . . . .                                                      1
  1.2 Eye Tracking . . . . . . . . . . . . . . . . . . . . . . . . . . . . . . .                                                      3

2 Aim and Objectives                                                                                                                  5
  2.1 Research Questions . . . . . . . . . . . . . . . . . . . . . . . . . . . .                                                      5

3 Related Work                                                                                                                        7
  3.1 Foveated Rendering . . . . . . . . . . . . . . . . . . . . . . . . . . . .                                                      7
  3.2 Foveated Rendering in Virtual Reality . . . . . . . . . . . . . . . . .                                                         8

4 Method                                                                                                                              9
  4.1 Algorithm Overview . . .       .   .   .   .   .   .   .   .   .   .   .   .   .   .   .   .   .   .   .   .   .   .   .   .    9
  4.2 Radial Functions . . . . .     .   .   .   .   .   .   .   .   .   .   .   .   .   .   .   .   .   .   .   .   .   .   .   .   10
  4.3 Algorithm Implementation       .   .   .   .   .   .   .   .   .   .   .   .   .   .   .   .   .   .   .   .   .   .   .   .   11
  4.4 Technical Specifications . .   .   .   .   .   .   .   .   .   .   .   .   .   .   .   .   .   .   .   .   .   .   .   .   .   12
  4.5 Images . . . . . . . . . . .   .   .   .   .   .   .   .   .   .   .   .   .   .   .   .   .   .   .   .   .   .   .   .   .   12
  4.6 User Study . . . . . . . .     .   .   .   .   .   .   .   .   .   .   .   .   .   .   .   .   .   .   .   .   .   .   .   .   14
  4.7 Entropy Coding . . . . . .     .   .   .   .   .   .   .   .   .   .   .   .   .   .   .   .   .   .   .   .   .   .   .   .   15

5 Results                                                                                                                            17
  5.1 Participants . . . . . . . . . . . .           .   .   .   .   .   .   .   .   .   .   .   .   .   .   .   .   .   .   .   .   17
  5.2 Compression algorithm selections               .   .   .   .   .   .   .   .   .   .   .   .   .   .   .   .   .   .   .   .   18
  5.3 Radial function selections . . . .             .   .   .   .   .   .   .   .   .   .   .   .   .   .   .   .   .   .   .   .   22
  5.4 Storage size differences . . . . . .           .   .   .   .   .   .   .   .   .   .   .   .   .   .   .   .   .   .   .   .   23

6 Analysis and Discussion                                                                                                            29
  6.1 Perceptual Quality Difference .            .   .   .   .   .   .   .   .   .   .   .   .   .   .   .   .   .   .   .   .   .   29
  6.2 Radial Functions Selections . .            .   .   .   .   .   .   .   .   .   .   .   .   .   .   .   .   .   .   .   .   .   30
  6.3 Entropy size differences . . . . .         .   .   .   .   .   .   .   .   .   .   .   .   .   .   .   .   .   .   .   .   .   30
  6.4 Feedback during the user study             .   .   .   .   .   .   .   .   .   .   .   .   .   .   .   .   .   .   .   .   .   30
  6.5 Issues with the algorithm . . . .          .   .   .   .   .   .   .   .   .   .   .   .   .   .   .   .   .   .   .   .   .   30

7 Conclusions and Future Work                                                                                                        31

                                                 v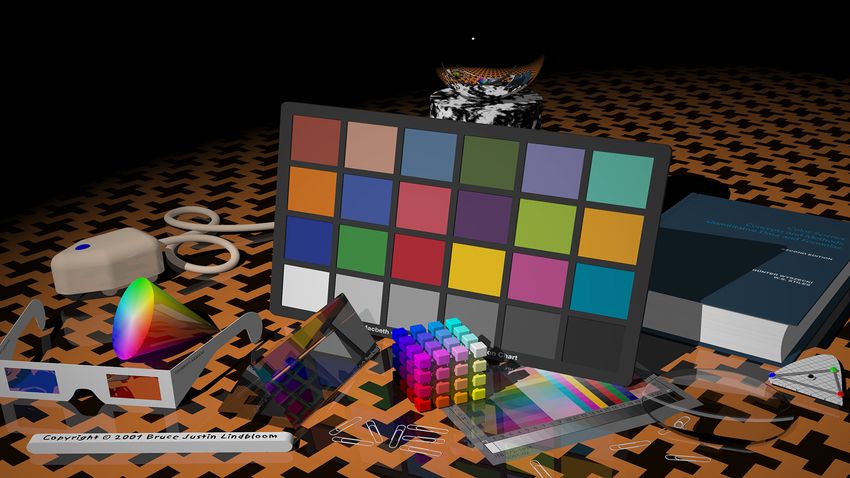
References                        33

A Supplemental Information        35

                             vi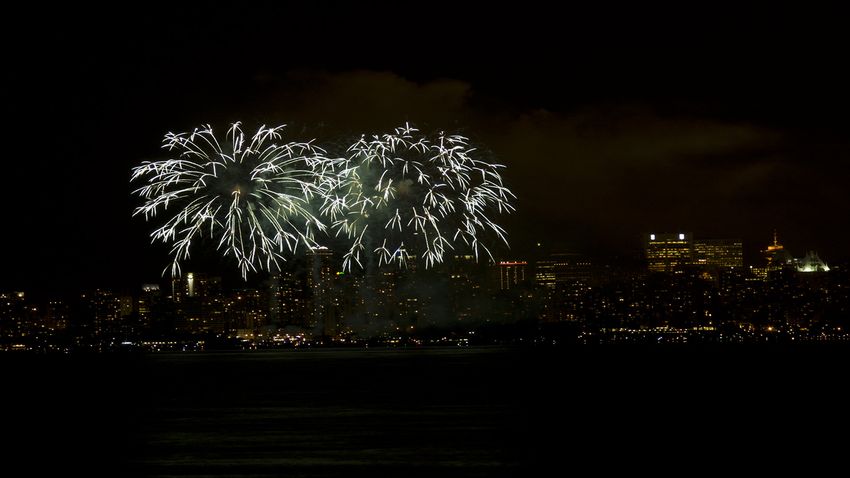
List of Figures

3.1   In foveated rendering, the image rendered on three layers that have
      different resolutions. The layers are then constructed together along
      a blur effect. (From Foveated 3D graphics) . . . . . . . . . . . . . . .      7
3.2   from Gaze-Aware Streaming Solutions for the Next Generation of Mo-
      bile VR Experiences . . . . . . . . . . . . . . . . . . . . . . . . . . .      8

4.1   Here is the gaze point located in the middle of the image. What is
      visualised is the quality variable where a higher quality is redder. The
      value is gradually becoming darker as the distance from the gaze point
      for each block is increasing. . . . . . . . . . . . . . . . . . . . . . . .   10
4.2   The circle is divided into three eccentricity layers; the inner layer is
      the most detailed. The second layer is a transition to the outer layer
      that have a constant quality set to 20. . . . . . . . . . . . . . . . . .     11
4.3   Illustration of how the information is divided for the groups . . . . .       11
4.4   All ten images used in the thesis. . . . . . . . . . . . . . . . . . . . .    13

5.1   Number of times an image was picked with either compression algorithms 18
5.2   Radial functions with their parameters compared to each other . . . . 22
5.3   Average file savings computed with both radial functions . . . . . . . 23

A.1 Code snippet from the initial setup for the gaze-based algorithm, writ-
    ten in HLSL . . . . . . . . . . . . . . . . . . . . . . . . . . . . . . . .     35
A.2 How the quality is calculated with the linear function with 80% of the
    initial radius . . . . . . . . . . . . . . . . . . . . . . . . . . . . . . .    36
A.3 How the quality is calculated with the linear function with 60% of the
    initial radius . . . . . . . . . . . . . . . . . . . . . . . . . . . . . . .    36
A.4 How the quality is calculated with the field of view function with 80%
    of the initial radius . . . . . . . . . . . . . . . . . . . . . . . . . . . .   37
A.5 How the quality is calculated with the field of view function with 60%
    of the initial radius . . . . . . . . . . . . . . . . . . . . . . . . . . . .   37

                                        vii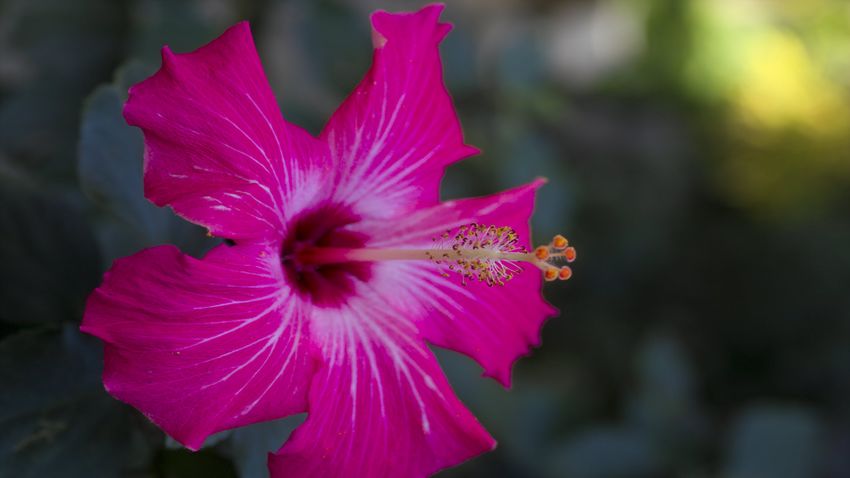
Chapter 1
                                                               Introduction

Half of today’s internet traffic is accounted by Youtube and Netflix [10]. By 2021, all
video streaming services combined will be held accountable for 82 percentage of all
internet traffic [2]. Another form of video streaming that is on the rise is cloud gaming
[6]. Cloud gaming offers customers the ability to play games across various devices
with limited hardware. The actual game is being rendered at another device such
as a server and the frames are transmitted to the user’s device. The user interacts
with the game by sending the input to the server. The internet speed necessary
to use cloud gaming services today is high compared to what the average customer
has. According to a report in 2017 done by Akamai Technologies, the global average
connection speed is 7.2 Mbps/s [1]. South Korea is the country with the highest
average speed of 28.6 Mbps/s. GeForce Now is a cloud gaming service offered by
Nvidia [3]. It can currently stream games at 1080p at 60 frames per second and
recommends a 50 Mbps/s internet connection. Traditional video streaming does
not require the customer to have a quick internet connection to affect the overall
experience of the service. As the video stream can be left to buffer the content and
played later. While cloud gaming content is requested on demand. To reach out
to a wider range of customers with slower connections there exists solutions. One
is to lower the resolution and frame rate in which the content is being delivered.
This thesis is aimed to test if it is possible to perform a greater compression rate
of still images that is not noticeable for the end user. An example of this would be
to reduce information of the image where the user is not looking at, while having
the focus point be displayed in higher quality. This would be applicable to cloud
gaming services to retain the quality and frame rate while streaming content at a
lower bandwidth.

1.1     JPEG algorithm
A popular image format for internet use, is images compressed with the JPEG algo-
rithm. Image compression algorithms are divided into two categories: “Lossy” and
“Lossless”. Both have their advantages and disadvantages. A lossless compression
refers to a type of compression that reduces the file size of an image without sacrific-
ing the quality. A lossy compression takes a more aggressive approach that works by
removing information from the original image to a create a significantly reduced file
size. The difference between the two types of compression is the trade-off between
image quality and file size. A lossless compression will retain the quality but not
offer the same magnitude of size savings.

                                           1
2 Chapter 1. Introduction
JPEG is an acronym for the Joint Photographic Experts Group[12], who is a joint
ISO/CCITT committee. They are the creators behind this compression standard. In
the original article there are two proposed compression methods. The first one was a
Discrete Cosine Transform (DCT) method that is a specified as a “lossy” compression.
The second one was a predictive method that is “lossless”. The most used one today
for web applications is the DCT method. This method works by averaging colour
variations and discards information that the human eye cannot see. The user is in
control in how much of the information that is lost through a factor of 1 to 100 [9].
The JPEG compression algorithm is divided into two parts, encoder and decoder.
Every image compression is created and packed into a file with the encoder. To
unpack the file and retrieve the image you use a decoder. The steps necessary for
the encoder is similar for the decoder but in the reverse order.
The steps for the encoder are as follows
1. Convert to YCbCr colour space.
2. Split the image into 8x8 blocks.
3. Perform DCT on each block.
4. Do quantization on the result on each block.
5. Entropy coding to save the information to a file.
The first step is to convert the representation of colours. When an image is pre-
sented on a screen, each pixel is constructed with three channels: Red, Green and
Blue (RGB). However, there is another colour space that the JPEG algorithm uses
which is called YCbCr. The YCbCr colour space also feature three channels and
they are: Luminance, which represent brightness. The other two are called chroma
components, they are split into a blue and red component. The human eye is less
sensitive to colour changes over an area compared to brightness. Because of this we
can down sample the chroma channels and the result is not noticeable.
Next step in the algorithm is to split the image into 8x8 blocks. This is because
of the assumption that neighbouring pixels are often similar.
Then a DCT is performed that converts the values to a frequency domain rep-
resentation. The result is an 8x8 table of coefficients. In this table we have two
types of coefficients, a DC coefficient and the rest are called AC coefficients. The DC
coefficient is located at the beginning of the table and is relatively larger compared
to the other values. The next step is called quantization and is the lossy part of the
algorithm. It is the quantization table that decides how much of the information that
will be reversible later in the decoding process. What this step does is cancelling out
some of the AC coefficient. By cancelling out more you get a smaller file, but a lower
quality image.
Next step is storing the 8x8 blocks out to a file. This is done by run-length
encoding, followed by Huffman coding. This is called entropy coding.
The decoders job is to perform these steps in reverse and instead of converting
to YCbCr colour space it instead converts to the RGB colour space.
JPEG compression is related to the video streaming codec MPEG, which can be
encoded in a similar way by sequencing JPEG images after each other.1.2. Eye Tracking 3 1.2 Eye Tracking With the help of today’s eye tracking hardware, it is possible to know where a user is looking at a monitor. The uses of this technology ranges from scientific research to commercial applications. The hardware consists of a sensor that is placed on a monitor. This sensor is emitting infrared light and taking high frame rate pictures of the users’ eyes. With this data the sensor can calculate where on the monitor the gazing point is located[11].
Chapter 2
                                                Aim and Objectives

The aim of this thesis is to develop a gaze-based image compression algorithm. This
algorithm can be used to save bandwidth without sacrificing perceptual quality. By
considering where the user is gazing at a given image, a higher quality is displayed and
then gradually decreasing. The algorithm is exploiting the fact that the human eye
can only see detail at a 5-degree angle[5], meaning you could theoretically perform
a more lossy compression that is not noticeable. With such algorithm, you could
save more storage and bandwidth. This would be applicable for services that rely
on streaming content over a network. By sending the gaze point to such service, it
could process the next frame with such algorithm to save bandwidth.
   The objectives for this thesis are as follows:

   • Create a gaze-based lossy image compression algorithm.

   • Make the algorithm run fast enough for an interactive application.

   • Create an application to test the algorithm.

   • Summarize the result and draw conclusions.

2.1     Research Questions
In this thesis the following research questions (RQ) is used to evaluate the gaze-based
algorithm:

   • RQ1: Can a gaze-based lossy image compressed image be perceptually indis-
     tinguishable from a JPEG compressed image?

   • RQ2: What radial function is best suited for calculating quality falloff given a
     focus point?

   • RQ3: How much of a storage saving is there between a gaze-based lossy image
     compression compared to JPEG image compression?

                                           5
Chapter 3
Related Work
There has be made related work with the user’s eyes in mind to speed up existing
techniques and saving bandwidth. As the human eye can see 135 degrees vertically
and 160 degrees horizontally we have a large field of view. However, we can only see
detail at a 5-degree angle. This is what a technique called Foveated Rendering[5] is
exploiting. Traditional computer-generated imagery renders high resolution for the
entire display which is wasteful from our perspective.
3.1 Foveated Rendering
Foveated Rendering is a graphics-rendering technique is an acceleration algorithm
that is used to speed up rendering by reducing the image quality in the peripheral
vision. It works by dividing the frame into three layers called eccentricity layers.
These layers reflect how the acuity is decreasing as the distance from the gaze point
is increasing.
Figure 3.1: In foveated rendering, the image rendered on three layers that
have different resolutions. The layers are then constructed together along
a blur effect. (From Foveated 3D graphics)
The speed up of using this technique is a about 5-6 times faster at a 1920x1080
resolution. It is also stated in the article that as the resolution increase the speed up
is greater.
78 Chapter 3. Related Work
3.2 Foveated Rendering in Virtual Reality
Another study has also been made that feature eye tracking as an acceleration tech-
nique for Virtual Realty streaming [7]. It is designed around the same idea as the
foveated render technique. The study also proposes a solution to stream this foveated
data over the network to the client. In their solution they divide a frame into tiles
and encode the tiles differently depending on where the gaze point is located within
the frame. The tiles that are close to the gaze point have higher quality compared
to the others. The results of this approach showed a decrease in bandwidth usage
up to 83%.
Figure 3.2: from Gaze-Aware Streaming Solutions for the Next Generation
of Mobile VR ExperiencesChapter 4
Method
A gaze-based image compression algorithm was developed that uses a Tobii eye
tracker 4c to obtain where the user is looking at the monitor. To test the perceptual
quality of the algorithm a user study was conducted. The user study was aimed
to see if there was a difference between a JPEG compressed image and a gaze-
based compressed image. A comparison of the storage difference between a JPEG
compressed image and a gaze-based image was also made.
4.1 Algorithm Overview
The gaze-based lossy image compression algorithm is based on the JPEG algorithm.
The lossy JPEG standard has the option to adjust the image quality by a value given
between 1 to 100. This value is used to create a quantization table that affect how
much of each 8x8 block in the image is revertible during a later decoding process. A
lower set quality means that there is less information that is revertible which in turn
is a lower quality image. A lower quality image does also take up less storage space.
If the quality is set to a higher value, more information is revertible which in turn is
a higher quality image but requires more space to store.
A gaze-based lossy image compression would instead create a quantization table
for each 8x8 block in the image. The quality variables that is used to create the
quantization tables are calculated based on where the gaze point is located. With
these steps a quality decrease from a gaze point can be established.
A CPU implementation of this algorithm requires too much time to compress
a 1920x1080 image. The algorithm needs to be quick enough to meet the time
constraints for an interactive application. For this thesis the algorithm needed to
compress an image quicker than 16,67 Ms. The screen used in the user study have a
refresh rate of 60 Hz. Anything faster than that is not necessary.
Implementation details of Stefan Peterssons JPEG encoder[4] was an inspiration
to meet the time constraints. Peterson’s JPEG encoder is written in DirectX11 and
utilizes the multi-threading capabilities a GPU offers to aid in compressing images
quickly. As for JPEG features it contains:
• Varying quality settings
• Chrominance down sampling
• Colour space conversion to YCbCr.
910 Chapter 4. Method
• Entropy Coding
One of the major differences compared between Petersson’s encoder and the gaze-
based encoder is how the 8x8 blocks are quantized. The position of every block in
the image is used to calculate the quality variable which is used for creating the
quantization tables for both the luminance and chrominance. There is no chroma
down sampling and no entropy coding. Once the 8x8 block have been quantized the
data is then reverted again and an inverse discrete cosine transform is performed
followed by a colour conversion from YCbCr back to RGB. This is done to get a
visual representation of the compression results.
4.2 Radial Functions
To calculate the quality behaviour for the algorithm, two radial functions were used.
Both was implemented in a compute shader along with the algorithm. The functions
are used to perform the quality decrease from the gaze point. Where the user is
looking at is where the quality factor is set to the highest. The highest quality factor
used in this thesis is 85, which is a commonly used quality factor in image editing
software for compressing JPEG images with high quality. The first method is a linear
approach, see figure 4.1. The Euclidean distance is calculated between the gaze point
and the current block being used. This distance is normalized by dividing with the
diagonal distance for a 1920x1080 screen. The result is inverted and multiplied by
the quality factor.
Figure 4.1: Here is the gaze point located in the middle of the image.
What is visualised is the quality variable where a higher quality is redder.
The value is gradually becoming darker as the distance from the gaze
point for each block is increasing.
The second radial function is inspired from the "Foveated 3D Graphics" paper[5].
It is a combination of linear and constant quality variables, see figure 4.2. Where the
gaze point is located there is an area that have a quality set to 85. When this area
ends a linear decrease is happening where the quality is varying between the starting
85 down to 20. When this area ends the quality is set to a constant 20.
Both radial functions are tested against each other. Each radial function does also
have its own parameters that are used to test various radiuses and initial quality. The
radius parameter is responsible for determining how much of the image the function
is affecting. The initial quality parameter determines how much of the initial quality
is set.4.3. Algorithm Implementation 11
Figure 4.2: The circle is divided into three eccentricity layers; the inner
layer is the most detailed. The second layer is a transition to the outer
layer that have a constant quality set to 20.
The combination of settings is:
1. Radius 100% and quality 100%
2. Radius 80% and quality 100%
3. Radius 60% and quality 100%
4. Radius 100% and quality 80%
5. Radius 100% and quality 60%
Images of how the radius is spread for both radial functions can be seen in figures
A.2, A.3, A.4 and A.5.
4.3 Algorithm Implementation
The algorithm is written in HLSL and DirectX 12. It uses a compute shader to
simulate the compression. The shader is dispatched 240 times in the x and 135 times
in the y. Resulting in 32 400 groups being invoked per dispatch call. Each group
consists of 64 threads.
Figure 4.3: Illustration of how the information is divided for the groups
Figure 4.3 shows how the thread group shares data with each other. Each group
is responsible for an 8x8 block in the image, a luminance quantization table and a
chrominance quantization table. Within the group is 8x8 threads. Each thread is12 Chapter 4. Method
responsible a pixel one luminance and chrominance value. Sample code is provided
in appendix A, see figure A.1.
At the start of the algorithm the block location is extracted from the group
identifier. This location is converted to screen space. Once in screen space a quality
calculation is made to determines the quality for the entire block. Each thread is
then updating a value for both the quantization tables. The last step in the initial
work is to fetch the corresponding pixel. No sampling is made as the image is already
downscaled in an offline process.
4.4 Technical Specifications
A laptop was used to run the gaze-based algorithm. Following is the specifications
of the laptop:
• GeForce GTX950M, 2GB DDR3 VRAM
• Intel Core i5 – 6300HQ, 4 core 3.2 GHz
• 8 GB DDR4 RAM
• 15,6 Inch LED Display (1920x1080)
• Microsoft Windows 10
To obtain where the user is looking at in the image an eye tracker is used. For
this thesis, the Tobii Eye tracker 4c was used. It is a widely available consumer eye
tracker that is used for mainly gaming applications that support eye tracking. This
eye tracker has a frequency of 90 Hz and requires a USB 2.0 slot. The eye tracker
takes on average about 10 milliseconds to calculate the gaze point on the screen.
The gaze-based algorithm takes about 4 milliseconds to compress and present the
image on the screen. A total of 14 milliseconds is spent to display the results for the
algorithm.
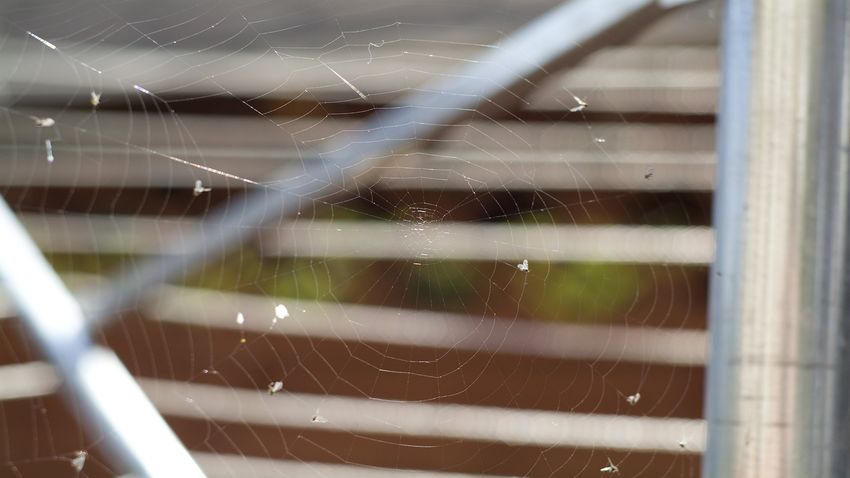
4.5 Images
The images used for this study was taken from imagecompression.info. This image
set contains different high-resolution images which have been selected to evaluate
compression and algorithm research. They are also fully redistributable.
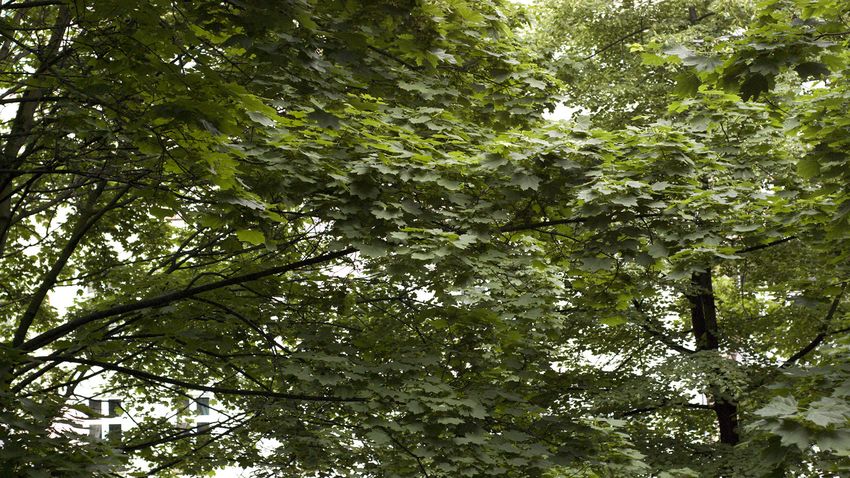
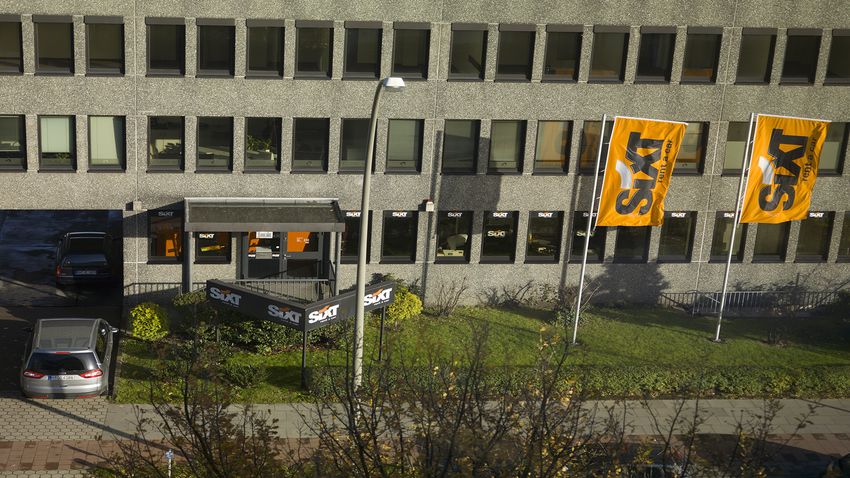
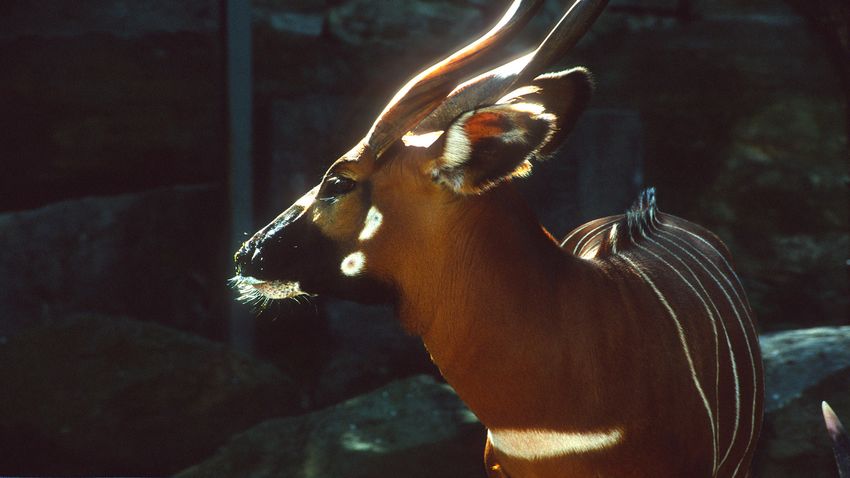
Ten images from the image set was selected based on their aspect ratio. The
algorithm does only support images that cover the entire screen. Any stretching is
not desirable, and all are displayed in landscape orientation. There is a variation of
number of objects featured in the images.
All images are resized offline with them being sampled to a 1920x1080 resolution
with the filter method being set to D3D12_FILTER_ANISOTROPIC. The resulting image
is later retrieved through an unordered access view (UAV). The image data is saved
as two versions. One version is encoded using Jon Olick’s JPEG encoder[8] with
the quality set to 85. The second version is saved as a PPM file. The PPM file
format is a small image format that is used for storing lossless images. The PPM4.5. Images 13
deer.jpg hdr.jpg
flower_foveon.jpg fireworks.jpg
big_tree.jpg big_building.jpg
artificial.jpg spider_web.jpg
nightshot_iso_1600.jpg leaves_iso_1600.jpg
Figure 4.4: All ten images used in the thesis.14 Chapter 4. Method
version is used to test the gaze-based algorithm. Since the gaze-based algorithm is
based on the JPEG algorithm it has the problem were images losing quality for being
recompressed.
4.6 User Study
A user study is conducted to test the gaze-based algorithm along with the different
radial functions. The research questions (RQ) that are being tested in the user study
are:
• RQ1: Can a gaze-based lossy image compression image be perceptually indis-
tinguishable from a JPEG compression?
• RQ2: What radial function is best suited for calculating quality falloff given a
focus point?
A test application is developed that is aimed to test the perceived quality be-
tween a gaze-based image compression and an JPEG compressed image. The two-
alternative force choice (2AFC) method is used.
The application is presenting the same image two times but with different com-
pressions. The duration for each image is five seconds, which is enough time to look
around in the image and perceive the quality. One image shown is compressed in
real time with the gaze-based image compression. The other image displayed is com-
pressed with a JPEG encoder with the quality set to 85. The participant is not told
which of the compression algorithms that are used for the image.
Once the two images have been presented the participant selects which of the
images they perceived had the best quality. The participant does not have the
option to view the images again and during the selection the images are not visible.
The order of compression methods is randomized throughout the study and it is
not always the case that the gaze-based compression will be presented first.
The participants are not told how the algorithm works. The only instruction
given prior to the study is that they will be presented the same image twice, then
given to option to select which they perceive have the best quality. Prior to the user
study a calibration of the eye tracker is performed. The age and gender provided
from the participant is written down. The participant is tested under supervision to
make sure that study is completed without any issues.
All the ten images are tested during the user study. The selections made between
the gaze-based compressed image and the JPEG compressed image are used to get
an answer for RQ1.
Each time the gaze-based compressed image is shown, one of radial functions is
used along with one of the parameters. There are two radial functions and each
function has five parameters. This means that each radial function and all the
parameters will be used once throughout the user study. The order they occur is
randomized each time the user study is run. Each time the gaze-based compression
was selected the radial function with its parameters is saved to a file. The amount
of selection for each function will be used to answer RQ2.4.7. Entropy Coding 15
4.7 Entropy Coding
Entropy coding is performed to answer the research question 3 (RQ3):
• RQ3: How much of a storage saving is there between a gaze-based lossy image
compression compared to a JPEG compression?
Entropy coding is the last step in the JPEG algorithm that is responsible for saving
the results from the quantization step effectively to a file. The gaze-based algorithm
uses the same type of entropy coding as in the JPEG algorithm. To make the gaze-
based algorithm run in real-time it was run on the GPU. However, timing constraint
is not a focus to answer RQ3. The algorithm implemented on the CPU with the
difference that the quantified data is not reverted. The encoding algorithm is based
on Jon Olick’s encoder[8]. This open source encoder is used to create JPEG images of
the image set. It is important to use the same encoding implementation as the JPEG
standard does not strictly specify how the data needs to save. The most common
way is to perform a run-length encoding followed by Huffman encoding. Arithmetic
coding, which is superior to Huffman encoding, is supported by the standard but not
commonly used. The storage of an image compressed with the gaze-based algorithm
is dependent on where the gaze point is located within the image. Because of this
an average storage size is computed from every gaze point within the image.Chapter 5
Results
The user study had 11 participants in total. All participants are regular office workers
that use computers in their everyday work. All were contacted by a relative. Each
participant was tested on the same ten images and was tested on both radial functions
with all five parameters. The order in which of the ten images was shown was
randomized for each participant. The user study was performed at the participants
office.
5.1 Participants
There was a wide range in the age of the participants. It ranged from 17 to 62 with
an average age of 40.
Age distribution
Gender distribution
1718 Chapter 5. Results
5.2 Compression algorithm selections
Figure 5.1: Number of times an image was picked with either compression
algorithms
Here we see the selections made on each of ten images used. What radial functions
which is being used in not considered. The selection distribution is very image
dependent. Images that feature clear objects close together is selected about the
same amount regardless of compression algorithm.
The following graphs show what radial function and which configuration that
were tested on each image. Since everything was randomized for each participant,
not every image was tested with all of the configurations.5.2. Compression algorithm selections 19
20 Chapter 5. Results
5.2. Compression algorithm selections 21
22                                                              Chapter 5. Results

5.3     Radial function selections

      Figure 5.2: Radial functions with their parameters compared to each other

    Two radial functions were used with different parameters. The parameters changed
how big of an area the function covered on the image and the overall quality. When
both parameters were set to 100% the radial functions where displayed as shown in
figure 4.2 and 4.1. The radial functions that was in use when the gaze-based image
was selected is shown here. What image that was shown is not considered.
    There is a trend in radial functions with big radiuses was selected more often
compared to smaller radiuses. The Linear function was selected more often compared
to the FOV function.
5
.4.S
tor
ages
ized
iffe
ren
ces 2
3
5
.4 S
torag
esi
zed
iffe
ren
ces
F
igu
re5
.3:A
ver
agefi
les
avin
gsc
ompu
tedw
ithbo
thr
adi
alfun
cti
ons
Th
epe
rcen
tag
ede
cre
asew
asc
alcu
lat
edu
sin
gth
efo
llow
ingf
ormu
la:
(
Ori
gina
lSi
ze NewS
ize)
/Or
igina
lSi
ze=Pe
rcen
tag
e (
5.1
)
Theavera
g eentr
op ybytesi
zep erc
entagedecre a
seisintheran
geo f60%to8 0%
comparedtoen t
ropysizecompu t
edw ithtrad
itionalJPEGc ompre
ssion.Bo
thr ad
ial
funct
ionswithallp arame
terswh e
rec omputedf o
rev e
ryg az
epoin
tanda ve
ragedfor
eachim a
ge.
Thefol
lowingg raphsdi
splayth estor
ag edifferenceforeachofthetenim age
s
wi
thbo thofther ad
i a
lfunct
ionsalongtheirconfi gura
tion
s.24 Chapter 5. Results
5.4. Storage size differences 25
26 Chapter 5. Results
5.4. Storage size differences                                                  27

    The FOV function produces smaller entropy byte sizes compared to the linear
function. The most important parameter for entropy byte size is the quality param-
eter. The initial FOV setting also produces less entropy byte size compared to the
Linear.
Chapter 6
Analysis and Discussion
A total of 11 participants participated in the user study to test the perceptual quality
difference between a JPEG compressed image and a gaze-based compressed. All tests
were performed without any issues. There are several conclusions that can be made
from the results given by the user study.
6.1 Perceptual Quality Difference
Based on the selections made in figure 5.1, all test images can be categorized with
the following criteria. The categories are:
1. Images that have few objects close together.
2. Images with many objects spread around throughout the image.
3. Images with no clear point of interest.
In category one, we find images such as deer.jpg, flower_foveon.jpg and arti-
ficial.jpg. These images share the same type of property which is that they feature
few objects which are displayed very clearly and closely. Images with this property
was evenly selected for both compression algorithms. An explanation for this would
be that there was less eye movement during the time the image was shown. This
meant that the participant where less likely to notice any compression artefacts.
In the second category there are images such as big_building.jpg, hdr.jpg,
leaves.jpg, spider_web.jpg. These images have many features that draws atten-
tion. Which means more eye movement which results in greater chances to notice
compression artefacts. When the gaze position is updated, the algorithm updates the
image which results in blocks that were previously in lower quality suddenly having
more information to display. This is noticeable in the peripheral vision.
The third category have images such as nightshot_iso_1600.jpg,
leaves_iso_1600.jpg and spider_web.jpg. These have few or no point of interest
in them, which means that this category also suffers from the same problems that
category two has.
A solution to this issue can be to have the luminance quantization table constant
throughout the algorithm and let the chrominance tables be calculated with the radial
functions. This would be motivated as the luminance of pixels are more noticeable
for the human eye compared to the chrominance.
2930 Chapter 6. Analysis and Discussion 6.2 Radial Functions Selections Both radial functions share the same trend in the percentage in which they were selected. A large radius is more desirable when it comes to perceptual quality. Both functions saw a decline in selections once the radius shrunk. When the quality percentage was lowered the decline was less noticeable. The second radial function suffered a large decline when the initial quality was 60%. 6.3 Entropy size differences There was a saving in the entropy byte size up to 80% depending on the image used. This is about the same percentage as in the Foveated Virtual Reality paper[7]. In that paper they saw an 83% decrease in bandwidth used when using their tiling approach described in section 3.2. The radial function that saved the most storage was the FOV function. This function was selected the same amount as the first function, as seen in figure 5.2. 6.4 Feedback during the user study A common question asked during the study from participants were if they we suppose to notice something. A participant reported a feel of frustration during the selection of the images. The cause was that she felt that she was supposed to notice a difference between the algorithms. A few participants reported that their selections were mostly random and hoping they would pick the “correct” answer. When the radius was 60% the length of the initial some participants reported that something was moving when the gaze-based image was shown. 6.5 Issues with the algorithm Because of technical limitations such as a framerate of 60 frames per second, it was possible to see the compression artefacts. An example of this would be that you could focus on a corner in the image and then rapidly change the focus to the opposite corner. By doing this you had a small window to see the degraded quality. A pilot study was performed on colleagues and there was a difference on the results when they were told how the algorithm worked beforehand compared to no knowing. Once a colleague knew how the algorithm work they started to rapidly change the focus. This type of algorithm is only applicable for applications that stream content to a single user. It is not possible to have multiple users gazing at the screen and have the algorithm take both into account. Cloud gaming that relies on the user to input commands have already this service setup to handle the one to one customer and server relationship. Traditional video streaming services such as Youtube would not gain any benefits from the saved bandwidth if it meant to have the same customer and server relationship as cloud gaming.
Chapter 7
                            Conclusions and Future Work

This thesis concludes that the proposed gaze-based compression algorithm is suited
for images with few objects who are close together. Once the number of objects
increase or there are no objects to be found the perceptual quality decreases. To
answer the research questions:

   • Can a gaze-based lossy image compression image be perceptually indistinguish-
     able from a JPEG compression?

The answer depends on the image used. An image with many points of interests did
perform poorly with this type of gaze-based compression. Images that only feature
a single or few objects did perform slightly worse compared to traditional JPEG
compression.

   • What radial function is best suited for calculating quality falloff given a focus
     point?

Both a linear and Field of View (FOV) approach was tested, and both functions
performed better when they did cover a larger part of the image. The linear function
had a higher pick rate when lowering the quality compared the FOV function. The
FOV function did create a smaller entropy byte size.

   • How much of a storage saving is there between a gaze-based lossy image com-
     pression compared to a JPEG compression?

The storage difference of the images tested showed on average an entropy byte de-
creases between 60% to 80% depending on the image.
    Future work is to test the algorithm on moving pictures to make it fully applicable
for cloud gaming. There were only images tested in this study. The results may be
different compared to testing on moving pictures. The scalability of the algorithm
is another type of area that can be explored. In this study, only 1920x1080 images
displayed on a screen with the same resolution was tested.

                                          31
References
[1] akamai. akamai’s [state of the internet]. https://www.
akamai.com/us/en/multimedia/documents/state-of-the-internet/
q1-2017-state-of-the-internet-connectivity-report.pdf, 2017.
[2] Cisco. Cisco visual networking index: Forecast and trends,
2017–2022 white paper. https://www.cisco.com/c/en/us/solutions/
collateral/service-provider/visual-networking-index-vni/
white-paper-c11-741490.html, February 2019.
[3] Nvidia Corporation. Geforce now. https://www.nvidia.com/sv-se/geforce/
products/geforce-now/, 2019. [Online; accessed 10-May-2019].
[4] Wolfgang Engel. GPU Pro 4 : advanced rendering techniques. CRC Press,
Taylor & Francis Group, Boca Raton, 2013.
[5] Brian Guenter, Mark Finch, Steven Drucker, Desney Tan, and John Snyder.
Foveated 3d graphics. ACM Transactions on Graphics (TOG), 31(6):1–10, 2012.
[6] Kuan. Cloud computing and digital media : fundamentals, techniques, and ap-
plications. CRC Press, Taylor & Francis Group, Boca Raton, 2014.
[7] Pietro Lungaro, Rickard Sjoberg, Alfredo J. F. Valero, Ashutosh Mittal, Konrad
Tollmar, and KTH. Gaze-aware streaming solutions for the next generation
of mobile vr experiences. IEEE Transactions on Visualization and Computer
Graphics, 24(4):1535–1544, 2018.
[8] Jon Olick. https://www.jonolick.com/code.html.
[9] Muhammad Safdar, Ming Ronnier Luo, and Xiaoyu Liu. Performance compari-
son of jpeg, jpeg 2000, and newly developed csi jpeg by adopting different color
models. Color Research and Application, 42(4):460–473, 2017.
[10] Sandvine. The global internet phenomena report. https://www.sandvine.com/
hubfs/downloads/phenomena/2018-phenomena-report.pdf, October 2018.
[11] Tobii. https://www.tobii.com/sv/group/om-tobii/
det-har-ar-eyetracking/.
[12] G. K. Wallace. The jpeg still picture compression standard. IEEE Transactions
on Consumer Electronics, 38(1):xviii–xxxiv, 1992.
33Appendix A
Supplemental Information
The source code for the algorithm and test application is available on this Github
link. https://github.com/Henkebot/BachelorThesis
Figure A.1: Code snippet from the initial setup for the gaze-based algo-
rithm, written in HLSL
3536 Appendix A. Supplemental Information
Figure A.2: How the quality is calculated with the linear function with
80% of the initial radius
Figure A.3: How the quality is calculated with the linear function with
60% of the initial radius37 Figure A.4: How the quality is calculated with the field of view function with 80% of the initial radius Figure A.5: How the quality is calculated with the field of view function with 60% of the initial radius
Faculty of Computing, Blekinge Institute of Technology, 371 79 Karlskrona, Sweden
You can also read


