Solaria - the Green Energy GrowthCo - Strategy update presentation June 2018

Page created by Todd Carrillo
 
CONTINUE READING
Solaria - the Green Energy GrowthCo - Strategy update presentation June 2018
Solaria – the Green Energy GrowthCo
Strategy update presentation          June 2018
Solaria - the Green Energy GrowthCo - Strategy update presentation June 2018
Disclaimer
This document has been prepared by SOLARIA ENERGÍA Y MEDIO AMBIENTE, S.A. (“Solaria”) for information purposes only and it is not a regulated information or information that has been subject to prior registration or review by the Spanish Securities Market Commission.
By attending a meeting where this document is presented, or by reading the slides contained herein, you will be deemed to have: (i) agreed to the following limitations and notifications and made the following undertakings; and (ii) acknowledged that you understand the legal and regulatory sanctions attached to
the misuse, disclosure or improper circulation of this document.
This document includes summarised audited and unaudited information. The financial and operational information, as well as the data on the acquisitions that have been carried out, included in the presentation, come from the accounting records of Solaria. Such information may in the future be subject to audit,
limited review or any other control by an auditor or an independent third party and therefore, this information may be modified or amended in the future.
The ordinary shares of Solaria are listed on the Madrid, Barcelona, Bilbao and Valencia Stock Exchanges (the “Spanish Stock Exchanges”), and Solaria is therefore required to publish certain business and financial information in accordance with the rules and practices of the Spanish Stock Exchanges and the
Spanish Securities Market Commission (the “Exchange Information”), which includes its audited annual financial statements. This information is available, in both the Spanish and English languages, on Solaria’s website (www.solariaenergia.com).
Neither this document nor any information contained herein may be reproduced in any form, used or further distributed to any other person or published, in whole or in part, for any purpose. Failure to comply with this obligation may constitute a violation of applicable securities laws and/or may result in civil,
administrative or criminal penalties.
This document is not an offer for the sale or the solicitation of an offer to subscribe for or buy any securities in the United States or to U.S. persons. The securities of Solaria may not be offered or sold in the United States absent registration or an exemption from registration under the U.S. Securities Act of 1933,
as amended (the “Securities Act”).
Neither this document nor any copy of it shall be taken, transmitted into, disclosed, diffused, published or distributed in the United States, Canada, Australia or Japan. The distribution of this document in other jurisdictions may also be restricted by law and persons into whose possession this document comes
should inform themselves about and observe any such restrictions.

This document is not a prospectus and does not constitute or form part of, and should not be construed as, any offer, inducement, invitation, solicitation or commitment to purchase, subscribe to, provide, sell or underwrite any securities, services or products or to provide any recommendations for financial,
securities, investment or other advice or to take any decision.
This document includes, in addition to historical information, forward-looking statements about revenue and earnings of Solaria and about matters such as its industry, business strategy, goals and expectations concerning its market position, future operations, margins, profitability, capital expenditures, capital
resources and other financial and operating information. Forward-looking statements include statements concerning plans, objective, goals, strategies, future events or performance, and underlying assumptions and other statements, which are other than statements of historical facts. The words “believe”,
“expect”, “anticipate”, “intends”, “estimate”, “forecast”, “project”, “will”, “may”, “should” and similar expressions identify forward-looking statements. Other forward looking statements can be identified from the context in which they are made. These forward-looking statements are based on numerous assumptions
regarding the present and future business strategies of Solaria and the environment in which Solaria expects to operate in the future. These forward-looking statements involve known and unknown risks, uncertainties, assumptions, estimates and other factors, which may be beyond Solaria’s control and which
may cause the actual results, performance or achievements of Solaria, or industry results, to be materially different from those expressed or implied by these forward-looking statements. None of the future projections, expectations, estimates or prospects in this document should be taken as forecasts or promises
nor should they be taken as implying any indication, assurance or guarantee that the assumptions on which such future projections, expectations, estimates or prospects have been prepared are correct or exhaustive or, in the case of the assumptions, fully stated in the document. Many factors could cause the
actual results, performance or achievements of Solaria to be materially different from any future results, performance or achievements that may be expressed or implied by such forward-looking statements. Should one or more of these risks or uncertainties materialise, or should underlying assumptions prove
incorrect, actual results may vary materially from those described herein as anticipated, believed, estimated, expected or targeted. As a result of these risks, uncertainties and assumptions, you should not place undue reliance on these forward-looking statements as a prediction of actual results or otherwise.
The information in this document has not been independently verified and will not be updated. The information in this document, including but not limited to forward-looking statements, applies only as of the date of this document and is not intended to give any assurances as to future results. Solaria expressly
disclaims any obligation or undertaking to disseminate any updates or revisions to the information, including any financial data and any forward-looking statements, contained in this document, and will not publicly release any revisions that may affect the information contained in this document and that may result
from any change in its expectations, or any change in events, conditions or circumstances on which any forward-looking statements are based or whichever other events or circumstances arising on or after the date of this document.
Market and competitive position data used in this document not attributed to a specific source, if any, are estimates of Solaria and have not been independently verified. While Solaria believes, acting in good faith, that such estimates are reasonable and reliable, they and their underlying methodology and
assumptions have not been verified by independent sources for accuracy or completeness and are subject to change. Additionally, certain data in this document has been obtained from third parties. While such data is believed, in good faith, to be reliable for the purposes for which they are used in this document,
Solaria expressly disclaims any liability as to the accuracy or completeness of such data. Accordingly, you should not place undue reliance on this information.

Certain financial and statistical information contained in this document is subject to rounding adjustments. Accordingly, any discrepancies between the totals and the sums of the amounts listed are due to rounding. Certain management financial and operating measures included in this document have not been
subject to a financial audit or have been independently verified by a third party.
This document discloses neither the risks nor other material issues regarding an investment in the securities of Solaria. The information included in this presentation is subject to, and should be read together with, all publicly available information, including the Exchange Information. However, you should be aware
that (i) Solaria’s business and results of operations are dependent on the regulatory environment and spot market prices (ii) Solaria’s pipeline involves numerous risks and uncertainties.
Regulation
The development, construction and operation of solar PV parks are highly regulated activities and Solaria conducts its operations in many countries and jurisdictions, which are governed by different laws and regulations. Such laws and regulations require licenses, permits and other approvals to be obtained and
maintained in connection with the operation of its activities. The procedures for obtaining such licenses, permits and other approvals vary from country to country, making it onerous and costly to track the requirements of individual localities and comply with the varying standard.

In addition, this regulatory framework imposes significant actual, day-to-day compliance burdens, costs and risks on us. In particular, in the countries where Solaria operates, solar PV parks are subject to strict EU (for those located in Spain, Italy and Greece), national, regional and local regulations relating to their
operation and expansion (including, among other things, land use rights, regional and local authorizations and permits necessary for the construction and operation of facilities, permits on landscape conservation, noise, hazardous materials or other environmental matters and specific requirements regarding the
connection and access to the electric transmission and/or distribution networks). Non-compliance with such regulations could result in the revocation of permits, sanctions, fines or even criminal penalties. Compliance with regulatory requirements may result in substantial costs to Solaria’s operations that may not
be recovered.
In addition, Solaria cannot predict whether the permits will attract significant opposition (public or otherwise including on account of litigation) or whether the permitting process will be lengthened due to administrative complexities and appeals.
Additionally, changes to these laws and requirements or of its interpretation by regulatory authorities and courts or the implementation of new such regulations affecting the solar PV parks in Solaria’s portfolio may result in significant additional expenses and may have a material adverse effect on Solaria’s
business, financial condition, results of operations and cash flows to the extent that Solaria cannot comply with such laws. Thus, laws and regulations could be changed to provide for new rate programs that undermine the economic returns for both new and existing solar PV parks in operation by charging
additional, non-negotiable fixed or demand charges or other fees or reductions in the number of solar PV projects allowed under net metering policies. These changes may make the development of a solar PV park infeasible or economically disadvantageous and any expenditure Solaria may have made on such
solar PV park may be wholly or partially written off.
Solaria also faces regulatory risks imposed by various transmission providers and operators, including regional transmission operators and independent system operators, and their corresponding market rules. These regulations may contain provisions that limit access to the transmission grid or allocate scarce
transmission capacity in a particular manner, which could materially and adversely affect Solaria’s business, financial condition, results of operations and cash flows.
To the extent Solaria enters into new markets in different jurisdictions, Solaria will face different regulatory regimes, business practices, governmental requirements and industry conditions. As a result, Solaria’s prior experiences and knowledge in other jurisdictions may not be relevant, and Solaria may spend
substantial resources familiarizing itself with the new environment and conditions.
Spot market prices
Revenue from Solaria’s energy generation business is partially exposed to contractual and spot market electricity prices and certain statutory preference of the energy produced from renewable sources in certain jurisdictions. Recent trends towards the unsubsidised, merchant or quasi-merchant market in Spain
mean that a significant majority of Solaria’s portfolio is expected to be exposed to pool prices or underpinned by fixed price PPAs (rather than regulated prices) by 2021. This exposure to the contractual and spot market price could be also the case for solar PV parks outside our solar PV backlog portfolio that
Solaria may develop in the future.
Spot market prices may be volatile and are affected by various factors, including the cost of commodities, user demand, the number of renewable and conventional energy producers in the market and if applicable, the price of greenhouse gas emission rights. A significant drop in commodity prices (mainly coal,
natural gas, oil and related carbon taxes) or a fundamental change in the structure of energy generation in the countries where Solaria operates may result in a decline or collapse of spot market prices. There can be no assurance that market prices will remain at levels which enable Solaria to maintain profit
margins and desired rates of return on investment. A decline or a collapse in market prices below anticipated levels could have a material adverse effect on Solaria’s business, financial condition, results of operations and cash flows.
In addition, in certain jurisdictions, including Spain, the energy produced from renewable sources has a statutory preference (prioridad de despacho) over that produced from non-renewable sources whereby the former is sold in the market before the latter if their prices match. If this preference would to be
repealed it could negatively affect our operations.
Pipeline
Solaria’s current business strategy requires the successful completion of the development and operation of the projects in its portfolio and its plans to further organically grow such portfolio of solar PV parks. As part of Solaria’s growth plan, Solaria may acquire solar PV parks in different development stages.
The development of the projects in Solaria’s pipeline involves numerous risks and uncertainties and requires extensive funding, research, planning and due diligence. Solaria may be required to incur significant amounts of capital expenditure for land viability analysis, land and interconnection rights, preliminary
engineering, permitting, legal and other expenses before it can determine whether a solar PV park is economically, technologically or otherwise feasible.
Difficulties that Solaria may face when executing this development and growth strategy include:
• obtaining and maintaining required construction, environmental and other permits, licenses and approvals; securing suitable project sites, necessary rights of way and satisfactory land rights (including land use) in the appropriate locations with capacity on the transmission grid;
• unanticipated changes in project plans;
• connecting to the power grid on schedule and within budget;
• connecting to the power grid if there is insufficient grid capacity;
• identifying, attracting and retaining qualified development specialists, technical engineering specialists and other key personnel;
• entering into PPAs or other arrangements that are commercially acceptable and adequate to obtain third-party financing therefor;
• securing cost-competitive financing on attractive terms;
• the availability of solar PV modules and other specialized equipment, increases in their prices and negotiating favorable payment terms with suppliers;
• negotiating satisfactory engineering, procurement and construction (“EPC”) agreements;
• satisfactorily completing construction on schedule, avoiding defective or late execution by providers and contractors labor, including equipment and materials supply delays, shortages or disruptions, work stoppages or labor disputes;
• cost over-runs, due to any one or more of the foregoing factors;
• operating and maintaining solar PV parks efficiently to maintain the power output and system performance; and
• accurately prioritizing geographic markets for entry, including estimates on addressable market demand.
Accordingly, some of the pipeline solar PV projects may not be completed or even proceed to construction and Solaria may not be able to recover any of the amounts invested.
All the foregoing shall be taking into account by those persons or entities which have to take decisions or issue opinions relating to the securities issued by Solaria. All such persons or entities are invited to consult all public documents and information of the Company registered within the Spanish Securities Market
Commission, including the Exchange Information.

                                                                                                                                                                                                                                                                                                                           1
Solaria - the Green Energy GrowthCo - Strategy update presentation June 2018
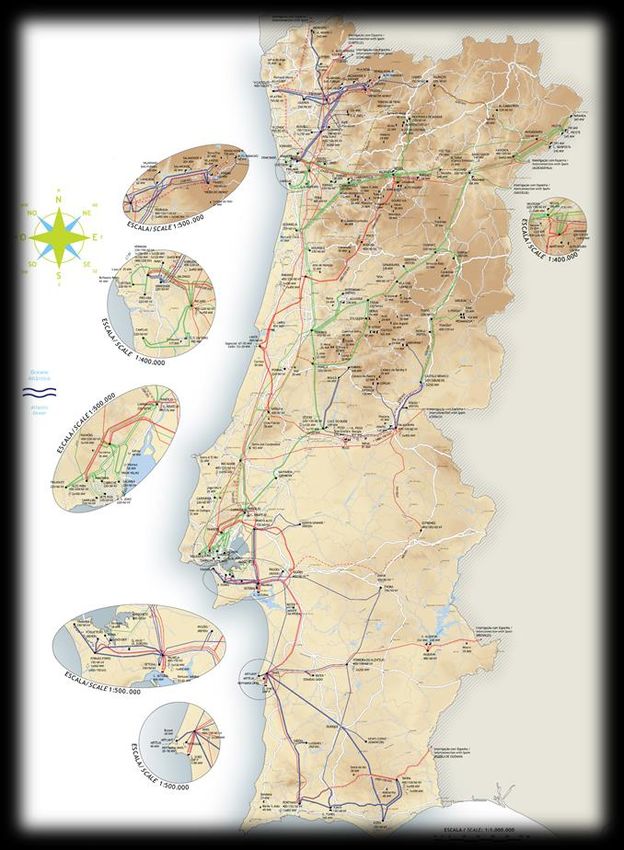
Today’s agenda and presenters

                                                               Presenting
 1   Key highlights of Solaria today                        management team

                                                            Arturo Díaz-Tejeiro
 2   Strong growth perspectives of the solar PV industry
                                                                   CEO

 3   Solaria corporate strategy                            Darío López Clemente
                                                                   COO

 4   Financial highlights and operational targets
                                                           Fernando Rodríguez
                                                           Business Development
 5   Closing remarks                                              Director

     Q&A

                                                                                  2
Solaria - the Green Energy GrowthCo - Strategy update presentation June 2018
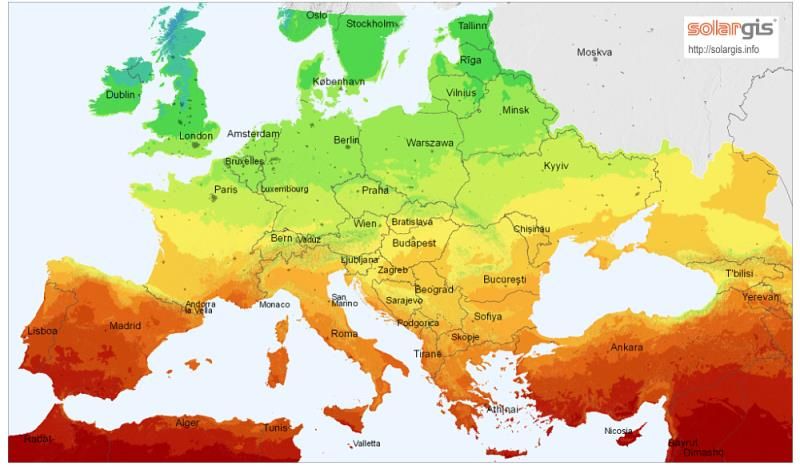
1. Key highlights of Solaria today

                                     3
Solaria - the Green Energy GrowthCo - Strategy update presentation June 2018
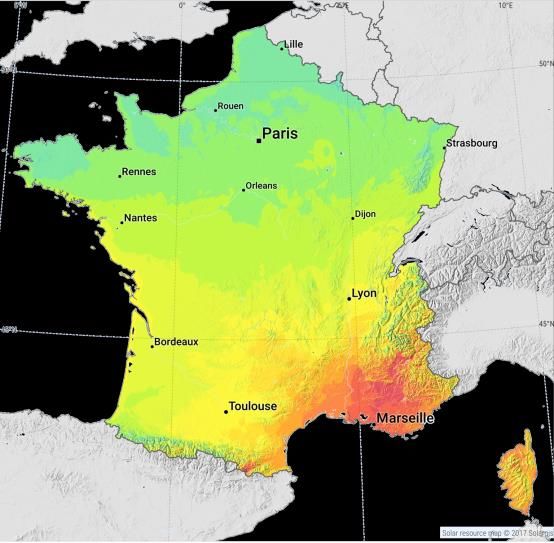
Solaria: The only European pure solar PV player
with proven experience across the value chain...

             2003 –     2006 –     2015 -
                                                  Current operational portfolio of
              2007       2014      Today
                                                  75 MW of solar PV plants

                                                                                                       Italy
  Solar
  cells                                                                                              17 MW

  Solar
 modules                                                                                              Greece
                                                                                                        0.4 MW
 Develop.
                                                                                    Spain
                                                                                       35 MW

 Turnkey
                       
Generation
                                  
                                                                                            Uruguay
                                                                                             23 MW
  O&M
                                 
… with operating capacity and projects pipeline across different geographies, mainly in Spain
                                                   Indicates location of operating assets

                                                                                                                 4
Solaria - the Green Energy GrowthCo - Strategy update presentation June 2018
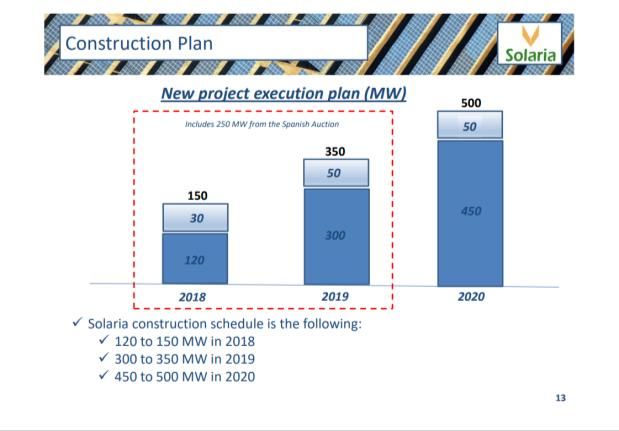
Solaria, the green growth story

Strategy based on the development of greenfield projects and selective brownfield acquisitions

                 Brownfield                                                 Greenfield

       Opportunistic acquisitions in                                  All greenfield projects always
           Southern Europe and LatAm                               developed by Solaria in-house

      Portfolio sourced from Solaria   own-                         Developments in attractive
                                                                                           and
             developed projects                                     stable markets with low risk

      Refinancing of projects to boost
                                cash                           Continuous reduction  of opex and
        flow generation and returns                                  capex to increase returns

                                              Delivery of growth

Generation portfolio                              EBITDA                                    FCF
           growth                                  growth                                  growth

                                                                                                       5
Solaria - the Green Energy GrowthCo - Strategy update presentation June 2018
~2,300 MW of greenfield development projects
targeted in well-known and attractive regions

                                                                             Greenfield pipeline

                                                       Solaria’s selection of regions is mostly based on:

                                                          Well known and consolidated solar PV markets

                                                          Regulation & PLAs procedures
                                 France                   Long term opex predictability
                                 100 MW        Italy
                                             200 MW

                                                                  Spain             1,337 MW
 Mexico
 100 MW
                                                                  Portugal             300 MW

                             Portugal                             Italy                200 MW
                             300 MW
                                                                                                             Total
                                                                  France               100 MW             pipeline of
                                    Spain
                    Brazil        1,337 MW                                                                c. 2.3 GW
                   100 MW                                         Mexico              100 MW

                                                                  Chile               180 MW

           Chile                                                  Brazil              100 MW
          180 MW

                                                                                                                        6
1.3 GW of ready-to-build projects as of today (and
growing)
 Project code       Location         Capacity   Specific prod.    Connection
                                      (MW)       MWh/MWp         distance (km)
CLM-TAL-I       Castilla La Mancha       11        2,073              2.0                                                                           3
                                                                                                                1   1
CLM-TAL-II      Castilla La Mancha      9.5        2,073              2.0
                                                                                                                                                     2
EX-CT-I           Extremadura            20        2,083              1.5                             1
CYL-TOR-I        Castilla y León         30        1,981              4.0                                  1        3 5                    1
CYL-TOR-II       Castilla y León         50        1,990              2.3                                                     1
CYL-TOR-III      Castilla y León         30        1,990              3.1        250 MW                                   1
                                                                                                                                   1
CYL-SAL-I        Castilla y León         50        2,031              1.5        eligible under           1 3                                  1
CYL-SAL-II       Castilla y León         30        2,021              2.0        auction
CYL-SAL-III      Castilla y León         30        2,011              3.0                                                              1 1
AR-HUE-I              Aragón             25        2,052              2.0
                                                                                 remuneration                             2 1
                                                                                                           1
AR-POL-I              Aragón             30        2,042              2.8        regime
CLM-HUE-II      Castilla La Mancha       30        2,000              2.0
CYL-LAS-I        Castilla y León         30        1,939              1.0                                                 2
CYL-MED-I        Castilla y León         30        1,990              1.6
CYL-MUD-I        Castilla y León        100        1,980              2.5
CLM-HUE-I       Castilla La Mancha       50        2,000              2.0
CYL-REN-I        Castilla y León         30        1,990              1.5
CLM-AÑO-I       Castilla La Mancha       50        1,980              1.0                                      1
CYL-LAS-II       Castilla y León         20        1,939              2.0
CLM-HIN-I       Castilla La Mancha       50        2,060              2.0
CLM-HIN-II      Castilla La Mancha       30        2,060              2.5                         1
CYL-GRI-I        Castilla y León        100        1,920              2.8
                                                                                                                    # projects eligible under the auction remuneration scheme
AR-SAR-I              Aragón             25        1,960              1.0
CAN-TUI-I            Canarias            15        2,250              2.0                                           # projects in the merchant / PPA market
CYL-VLL-I        Castilla y León         50        1,920              2.0
CYL-CIU-I        Castilla y León        100        1,980              1.5
CYL-ZA-I         Castilla y León         50        1,940              6.0
CYL-ARR-I
CYL-BOH-I
                 Castilla y León
                 Castilla y León
                                         25
                                         25
                                                   1,950
                                                   1,950
                                                                      3.0
                                                                      1.5         250 MW auction projects →       financing currently
GA-XIN-I               Galicia           20        1,850              2.0         under negotiation with project bond investors
AND-ALC-I           Andalucía            50        2,170              2.5
CLM-ZOR-I       Castilla La Mancha       50        1,990              1.5
AR-HUE-II             Aragón             20        2,042              2.0
AR-HUE-III            Aragón             12        2,042              1.5         >1 GW → currently under negotiations with
AR-EGE-I              Aragón             30        1,940              3.0
AR-ALC-I              Aragón             30        1,940              3.0         investment grade counterparties for PPA agreements
Total                                 1,377

                                                                                                                                                                         7
Acceleration of the construction plan for the next 3
years in Spain…

                                                    New project execution plan
 Solaria plans to construct
1.3 GW of solar PV plants in
Spain within the next 3 years          Includes 250 MW from
                                        the Spanish Auction           650MW      1,300MW

     Execution plan 1Q 2018 results
                                                   450MW

                                      200MW

                                       2018E          2019E             2020E     Total additional
                                                                                 capacity in 2021E

                                                                                                     8
… that will translate into significant EBITDA and
FCF growth

         Accumulated                          Total expected           Forward power    Expected EBITDA   Typical FCF
        execution plan                         investment                 prices(1)         margin        conversion
(MW)                                                               (€/MWh)

                        1,300
                                                                      54
                                                                             50   49

              650
                                              ~ €650m                                     > 80%           > 55%

   200

                                            Solaria installation
                                            costs are currently
 2018E      2019E      2020E                less than 0.52 €/Wp     2019E 2020E 2021E

 Solaria minimum target returns : Project IRR >12%; Equity IRR >25%

Note:    FCF conversion = FCF / EBITDA.
(1)      As per the European Power Futures – EEX, Spain.

                                                                                                                        9
Solaria is well positioned to become the leading
solar PV power generation player in Spain

          Solar PV technology expected growth is
           unquestionable                                              Government support to renewable energy

  Solar installed capacity evolution(1)
(GW)

100
                            Solar CAGR
  90                        2017–2040:
  80
                             c.11%
  70

  60

  50

  40

  30

  20

  10

      0
          2014
          2015
          2016
          2017
          2018
          2019
          2020
          2021
          2022
          2023
          2024
          2025
          2026
          2027
          2028
          2029
          2030
          2031
          2032
          2033
          2034
          2035
          2036
          2037
          2038
          2039
          2040

                                       Solar installed capacity

Source:   Bloomberg New Energy Finance (“BNEF”).                      Source:   Press releases.

  Solaria will continue increasing its solar PV project pipeline in order to become the largest
  solar PV IPP in Spain

(1)       Data for Iberia

                                                                                                                 10
Successful brownfield strategy continues: new
acquisitions executed + ongoing project refinancings
                   New brownfield acquisition                       Italian projects refinancing

              Location                  Sardinia
                                                          Solaria is in current negotiations for the refinancing of
                                                            the portfolio in Italy with a project bond (c.€50m)
                Power                  4.3 MWp

                                 PV crystalline module
            Technology            Greenhouse rooftop

        Commissioning            2 Plants in May 2011

             Regulatory           II Conto, Integrato –
              regime                   Spalma C)                                            Marche

                   EV                   ~ €15m                    Ollastra

               EBITDA                   ~ €2.3m                    UTA       Sardinia

Source: Company information.

                                                                                                                      11
2. Strong growth perspectives of the solar PV
industry
Solar PV has reduced its costs significantly over
the last few years…

 Global(1) capex for Solar PV has decreased substantially and it is expected to keep falling
(€/W)
        2.4                                                                                                                                               Module

                    2.0                                                                                                                                   Inverter

                                                                                                                                                          Balance of plant

                                1.4                                                                                                                       EPC
                                                        1.2         1.2
                                            1.1                                 1.1                                                                       Other
                                                                                            0.8         0.8         0.7

        2010       2011        2012        2013        2014        2015        2016        2017       2018E       2019E

         Cost reduction mainly driven by module cost components reduction and increasing competitiveness of manufacturers

        − Monocrystalline module price of $0.37/W as of end of 2017, expected to decrease further in the future ($0.24/W by year end and further in
          the medium term(2))

         Other components such as inverters have also improved efficiency, reduced costs and increased availability

Source:   BNEF.
Note:     Converted from USD to Euro at the respective year end exchange rate. Estimated data converted from USD to Euro at an exchange rate of 1.2$/€.
(1)       Based on utility scale, fixed-axis PV system.
(2)       As per BNEF report on Solar PV market published on June 2018.
                                                                                                                                                                             13
… while solar PV technology has also significantly
increased its efficiency
         Improvement in technology has resulted in the usage of one axis-tracking systems at competitive prices, allowing for significant energy
          production increases

  Increasing efficiency of PV cells(1)                                                                            Key evidence – Production evolution

(%)                                                                                                            (KWh/KW)

  22%
                                                                                                                                                                2,000
  21%
                                                                                                                                                     +33%
  20%
                                                                                                                                    1,500
  19%

  18%

  17%

                                                                                                                                     2008                        2018
  16%
                                                                                                                           Fixed structure                  1 axis tracker

  15%
              2010      2011      2012      2013      2014      2015      2016      2017E
                                                                                                                          Efficiency improvement already reflected in cost
                          Mono crystalline                    Multi crystalline
Source:   BNEF.                                                                                                Source:   Company information.

Note:     Converted from USD to Euro at the respective year end exchange rate. Estimated data converted from USD to Euro at an exchange rate of 1.2$/€.
(1)       Based on surveyed manufacturers.

                                                                                                                                                                             14
Solar PV has therefore become the most
competitive source of energy today
                                                                                      Spanish solar LCOE is below forward prices and is expected
  EMEA solar PV LCOE vs. other technologies(1)
                                                                                      to continue decreasing
(€/MWh)                                                                              (€/MWh)

      228
                                                                                                                     63

                                                                                                                                         54
                                                             Solar PV is currently
                                                             the cheapest energy                                                                             50
                                                               source in EMEA                                                                                              49

                                   143

                                                               122

                                                                                                 c.30
                                                  95                      94
                     84

                                                                                                                                LCOE significantly
                                                                                                                                below pool prices
      58
                     52
                                   44             44
                                                                31        29

                                                                                                                          (2)
  Nuclear          CCGT          Wind -        Wind -          Coal    PV - no                 2017A               Spot                 2019E            2020E        2021E
                                offshore      onshore                  tracking
                                                                                                                                  (1)
                                                                                                     Spanish solar LCOE                       Electricity price in Spain
                                           LCOE
Source:   BNEF.                                                                        Source:   Company information, European Power Futures – EEX, Spain.

(1)       Converted from USD to Euro at an exchange rate of 1.2$/€.
(2)       Spot price as of 6 June 2018.

                                                                                                                                                                                15
As a result, solar PV is the fastest growing source
of energy
 Global capacity evolution
(GW)
                                                                                                                                                                             2017A Split
                                                                                                                                                                             2017A Split by
                                                                                                                                                                                         by technology
                                                                                                                                                                                            technology               2040E Split by technology
3,500
                                                 Solar CAGR                                                                                                     3,112                                                        c.13.9TW
3,000
                                                 2018–2040:
2,500                                                   c.   11%
2,000                                                                                                                                                                                 c.7.0TW
                                                                                                                                                                                                                               32%
1,500                                                                                                                                                                                     6%
1,000

  500 334

       0
            2018
                   2019
                          2020
                                 2021
                                        2022
                                               2023
                                                      2024
                                                             2025
                                                                    2026
                                                                           2027
                                                                                  2028
                                                                                         2029
                                                                                                2030
                                                                                                       2031
                                                                                                              2032
                                                                                                                     2033
                                                                                                                            2034
                                                                                                                                   2035
                                                                                                                                          2036
                                                                                                                                                 2037
                                                                                                                                                        2038
                                                                                                                                                               2039
                                                                                                                                                                      2040
                                                                                                                                                                                          2017A                                 2040E

                                                               Solar installed capacity                                                                                      Coal   Gas    Nuclear   Hydro   Solar    Wind   Flexible capacity   Other

          Solar will be the fastest growing technology in the 2018 – 2040 period (c.11% CAGR) driven by:

       − Progressively decreasing global LCOE

       − Scalability and proximity to consumption

       − Global solar capex expected to keep decreasing steeply as incremental improvements are implemented

          Latin America, the Middle East and Southeast Asia are expected to lead the growth of Solar market

          Southern Europe will lead a revolution in terms of change of the energy model

Source: BNEF.

                                                                                                                                                                                                                                                    16
Southern Europe will be one of the leading solar
PV markets based on attractive prices and high
irradiation levels
  European power prices futures (EEX)                                                                                European PV installed capacity evolution
(€/MWh)                                                                                                            (GW)
             60                            58                                                                      80
       56                             54                                 54
                                                                 50                              53
                          47                            46                                 49
                  42                              42                               43                         42   60
                                                                              40                       39
                                                                                                                   40

                                                                                                                   20

                                                                                                                     0
              2018                            2019                       2020                     2021                       2000    2005    2010     2015    2020    2025   2030     2035   2040   2045   2050
                                 Spain         Italy    Germany          France                                                                      Iberia          Italy          France
Source:     European Power Futures – EEX, Spain.                                                                   Source:    European Commission.

  European irradiation level
                                                                                                                             Attractive and stable pricing environment in Southern
                                                                                                                              European markets

                                                                                                                             − Solar PV attractive even on a subsidy free basis

                                                                                                                             Southern Europe expected to be one of the leading places in
                                                                                                                              the world for the development of PV power plants based on:

                                                                                                                             − Very high irradiation levels

                                                                                                                             − High energy demand, increasing with new social changes

                                                                                                                             − Stable and open energy markets, under Euro system
                                                               Average annual sum (April 2004 – March 2010)
 kWh/m2

                                                                                                                                                                                                             17
The Spanish solar PV industry, a future of growth

                                                            Installed capacity evolution by technology(1)
     Solar energy anticipated to cover c.41% of
      the installed capacity by 2040                       (in GW)
                                                               129           132        133              134     132     146       163          191       200

                                                               6%            6%             6%           6%      7%     12%
     Spanish solar capacity factors are                                                                                          21%
                                                                                                                                                36%       41%
      amongst the highest in Europe with one
      of the most attractive irradiation levels, coupled
      with high demand in summer

     The Spanish government auctioned 8.7GW of
      new renewable projects (45% solar PV) in                2014A         2015A      2016A            2017A   2020E   2025E     2030E        2035E     2040E
      2016 and 2017, expected to be in operation by
      2020
                                                            Power production evolution by technology(1)

     All new capacity expected to enter the                                        2017A                                           2040E
      system under pure merchant or PPA
      schemes
                                                                              21%                                                1% 8%    12%
                                                                                                 19%
     These numbers can be even increased with
      the objective of the new Government to reach                                                                                               16%
                                                                       17%        327TWh           4%                     36%     343TWh
      35% of renewable energy by 2030

                                                                                                 17%
                                                                             16%                                                          27%
                                                                                      6%

                                                                      Gas           Hydro              Wind     Coal     Solar       Nuclear           Other

Source: BNEF.
(1)     Data for Iberia

                                                                                                                                                                 18
3. Solaria corporate strategy
3.1. Brownfield strategy
Excellent access to multiple potential brownfield
projects across Southern Europe

    Solaria’s experience in the solar PV market provides an       Track-record of value accretive acquisitions in
                                                                    attractive markets
     ample market knowledge which grants access to
     operational projects (i.e. projects where we have

                                                               
     worked in EPC, O&M or module suppliers)                        Value accretion driven by economies of scale,
                                                                    operational and financial outperformance

    Focus on countries and regulations of the

                                                               
     existing portfolio in order to maximise synergies              Identified opportunities in a number of other
                                                                    markets

    The projects identified can be optimized in terms of
     OPEX and / or financing since they were connected
     several years ago

    Solaria also considers local synergies in terms of
     operation and management

                                                               Focus on stable markets with low counter-party risk

                                                                                                                      21
Brownfield transaction case study
Magacela acquisition

 Asset                                                Magacela

 Location                                        Extremadura (Spain)

 Solaria ownership                                     100%

 Commissioning date                                September 2008

 Type of installation                              Ground mounted

 Installed capacity                                   10.9 MW

 LTM power generation                                16,47 GWh
                                        2037 €47m 3.769% Senior Secured Notes
 Financing
                                                Magacela Solar I, SAU

            Developed & executed (EPC) and sold by Solaria in 2008

             Financed by two banks and generated ~€0.7m of FCF

        Acquired by Solaria and refinanced by Blackrock in 2017, with
         a 2037 €47m 3.769% project bond, increasing FCF to €1.9m

Project bond at Magacela
Post-refinancing equity IRR
                          allows
                             of 29%
                                  reaching a post-refinancing equity IRR of 29%

                                                                                  22
Successful refinancing of existing assets with
project bonds …
                                                                                Focus on financial efficiencies

                                                                     Four bonds issuances in the last 24 months:
    Globasol Villanueva 1, S.A.U.   Planta Solar Puertollano 6,
                                    S.A.U.

    €45.3m
    4.20% Project Bond due 2037
                                    €45.1m
                                    3.75% Senior Secured Notes
                                                                       Allowed to turn almost all recourse debt into non-
                                                                         recourse debt
                                    due 2037

    May 2016                        February 2017
                                                                       Extended maturities
                                                                       Fixed interest rates, avoiding floating rate risk
                                                                       Boosted cash flow generation
    Magacela Solar 1, S.A.U.        Solaria Casiopea, S.A.             Allowed to acquire new capacity
    €47.1m                          €9.2m
    3.769% Senior Secured Notes
    due 2037
                                    4.15% Senior Secured Notes
                                    due 2037
                                                                       Provided new fresh equity to the company
    Fully subscribed by             Fully subscribed by
    BlackRock Real Assets           Rivage Investment
                                                                     Crucial for Solaria’s balance sheet and catalyst of the
    July 2017                       December 2017
                                                                      new growth period

Solaria has become a reference in the renewable project bond market with four issuances in
the last 24 months, subscribed by institutional investors such as Rivage and Blackrock

                                                                                                                                23
… provides a significant boost to the equity IRRs
of the projects
                                      Spanish projects                              Italian projects

                  Magacela                                 Fuenmayor

               29% IRR          (1)                        27% IRR (1)

                        Villanueva Globasol                                 Solaria is currently working on
                             38% IRR          (1)                        replicating the same process for the
                                                                                     Italian assets

(1) Indicates post refinancing equity IRR of the project

                                                                                                                24
3.2. Greenfield strategy
Several competitive advantages allow Solaria to
succeed in the greenfield development

     1   Strong development team in-house – Highly cost effective greenfield

                 15 years of experience in projects development and track record in Spain
         2       and multiple other jurisdictions

                    Close-to-grid project concept – design oriented to achieve the lowest
             3      Total Project Cost

                 Engineering & PV design according to our long IPP experience, looking
         4       for minimal LCOE

     5   In-house permitting process allows for direct control and minimum risk

                                                                                            26
~2,300 MW of greenfield development projects
targeted in well-known and attractive regions

                                                                               Greenfield pipeline

                                                         Solaria’s selection of regions is mostly based on:

                                                            Well known and consolidated solar PV markets

                                                            Regulation & PLAs procedures

                                    France                  Long term opex predictability
                                    100 MW       Italy
                                               200 MW

                                                                    Spain             1,337 MW
  Mexico
  100 MW
                                                                    Portugal             300 MW

                              Portugal                              Italy                200 MW
                              300 MW                                                                           Total
                                      Spain                         France               100 MW             pipeline of
                     Brazil         1,337 MW                                                                c. 2.3 GW
                    100 MW                                          Mexico              100 MW

                                                                    Chile               180 MW

            Chile                                                   Brazil              100 MW
           180 MW

                                                                                                                      27
Recent shift towards unsubsidised, merchant or
      quasi-merchant projects of the Spanish PV market

                                                                                                                          A sizeable amount of the new capacity
quasi-merchant market

                                                                                                                      
                                                                                                                          is being developed without
                                                                                                                          auctions, and is expected to come to
      Merchant /

                                                                                                                          market without public subsidies
                                                                                                                          and instead exposed to pool prices or
                                                                                                                          underpinned by fixed price PPAs

                                                                           Renewable energy auction held
                                                                            in July 2017 where all developers bid at
                                                                            maximum discounts obtaining a
                                                                            remuneration scheme where they
                                                                            receive market price with a floor
                                                                            price in the range of €32-34/MWh
subsidised market

                                                                                                                           Tariff surplus / (Deficit)
   Regulated /

                                                                                                    (€ in billions)
                           Spanish regulatory regime
                            remunerates renewables, since June                   Introduction of
                                                                                   RAB system
                            2014, through a guaranteed return                     together with
                            on deemed investment (RAB model)                     other measures
                            based on Spanish bond plus a spread                    successfully
                                                                                 addressed tariff
                                                                                      deficit
                             −   Revised every 6 years, with the next
                                 review due in 2020

                                                                                                      08A 09A 10A 11A 12A 13A 14A 15A 16A 17A 18E 19E 20E 21E 22E
                                                                                                    Source: CNMC.

                                                                                                                                                                  28
Only in Spain, Solaria has 1.3 GW of ready-to-build
projects to be constructed in the 3 next years
                                                        Spanish greenfield pipeline projects

                                                                   3
                    1   1
    1
                                                                       2                                  250MW to be constructed under
            1
                        3
                            5                            1                                                    auction remuneration
                                        1
                                1
                                                1
        1       3                                            1
                                                                                                          c.1GW to be constructed under
                                    2       1
                                                    1    1                                                   PPAs/merchant schemes
            1

                                    2

                                                                                        Pipeline capacity by region                Pipeline capacity by scheme

                                                                                                  Other
                                                                                                                                   Merchant /
                                                                                                   8%                                                      Auction
                    1                                                                                                                PPA
                                                                                                                                                            19%
                                                                                        Aragón                                       81%
                                                                                         13%

                                                                                                                      Castilla y
                                                                                                                       León
                                                                                                  > 1.3 GW              58%                     > 1.3 GW
                                                                                    Castilla La
                        # projects eligible under the auction remuneration scheme
        1                                                                            Mancha
                        # projects in the merchant / PPA market                       21%

                                                                                                                                                                     29
Greenfield ready-to-build projects overview
Projects under the auction remuneration scheme

                                               Location                                Specific prod.      Connection           Connection
     Project code                                                      Capacity (MW)
                                    Region                Province                      MWh/MWp             type/level         distance (km)

CLM-TAL-I                      Castilla La Mancha          Toledo          11.0            2,073        Distribution voltage        2.0

CLM-TAL-II                     Castilla La Mancha          Toledo           9.0            2,073        Distribution voltage        2.0
EX-CT-I                          Extremadura               Cáceres         20.0            2,083        Distribution voltage        1.5

CYL-TOR-I                        Castilla y León          Valladolid       30.0            1,981        Distribution voltage        4.0

CYL-TOR-II                       Castilla y León          Valladolid       50.0            1,990          Transmission              2.3

CYL-TOR-III                      Castilla y León          Valladolid       30.0            1,990          Transmission              3.1

CYL-SAL-I                        Castilla y León          Salamanca        50.0            2,031          Transmission              1.5

CYL-SAL-II                       Castilla y León          Salamanca        30.0            2,021          Transmission              2.0

CYL-SAL-III                      Castilla y León          Salamanca        30.0            2,011          Transmission              3.0
AR-HUE-I                            Aragón                 Huesca          25.0            2,052        Distribution voltage        2.0

AR-POL-I                            Aragón                 Huesca          30.0            2,042        Distribution voltage        2.8

CLM-HUE-II                     Castilla La Mancha          Cuenca          30.0            2,000          Transmission              2.0

CYL-LAS-I                        Castilla y León           Segovia         30.0            1,939        Distribution voltage        1.0

Total                                                                      375

     A total of 250 MW were awarded in the Spanish auction and have to be built by the end of 2019
     Government allowed for 50% buffer when projects were presented back in April

  Commitment for 250 MW to be constructed in 2018 and 2019 related to Spanish auction
Source: Company information.

                                                                                                                                               30
Greenfield ready-to-build projects overview
Projects in the merchant / PPA market

                                              Location                                 Specific prod.      Connection           Connection
     Project code                                                      Capacity (MW)
                                    Region                Province                      MWh/MWp             type/level         distance (km)

CYL-MED-I                       Castilla y León           Valladolid        30             1,990        Distribution voltage        1.6
CYL-MUD-I                       Castilla y León           Valladolid       100             1,980           Transmission             2.5
CLM-HUE-I                      Castilla La Mancha          Cuenca           50             2,000        Distribution voltage        2.0
CYL-REN-I                       Castilla y León           Valladolid        30             1,990        Distribution voltage        1.5
CLM-AÑO-I                      Castilla La Mancha           Toledo          50             1,980        Distribution voltage        1.5
CYL-LAS-II                      Castilla y León            Segovia          20             1,939        Distribution voltage        1.0
CLM-HIN-I                      Castilla La Mancha        Ciudad Real        50             2,060           Transmission             2.0
CLM-HIN-II                     Castilla La Mancha        Ciudad Real        30             2,060           Transmission             2.0
CYL-GRI-I                       Castilla y León           Palencia         100             1,920           Transmission             2.5
AR-SAR-I                             Aragón                Huesca           25             1,960        Distribution voltage        2.8
CAN-TUI-I                           Canarias             Las Palmas         15             2,250        Distribution voltage        1.0
CYL-VLL-I                       Castilla y León              León           50             1,920           Transmission             2.0
CYL-CIU-I                       Castilla y León          Salamanca         100             1,980           Transmission             1.5
CYL-ZA-I                        Castilla y León            Zamora           50             1,940           Transmission             6.0
CYL-ARR-I                       Castilla y León           Valladolid        25             1,950        Distribution voltage        3.0
CYL-BOH-I                       Castilla y León           Valladolid        25             1,950        Distribution voltage        1.5
GA-XIN-I                              Galicia              Orense           20             1,850        Distribution voltage        2.0
AND-ALC-I                          Andalucía                Sevilla         50             2,170        Distribution voltage        2.5
CLM-ZOR-I                      Castilla La Mancha        Guadalajara        50             1,990        Distribution voltage        1.5
AR-HUE-II                            Aragón                Huesca           20             2,042        Distribution voltage        2.0
AR-HUE-III                           Aragón                Huesca           12             2,042        Distribution voltage        1.5
AR-EGE-I                             Aragón               Zaragoza          30             1,940        Distribution voltage        3.0
AR-ALC-I                             Aragón                 Teruel          30             1,940        Distribution voltage        3.0
Total                                                                      962

  As of June 2018, total greenfield ready-to-build projects in Spain is 1,337 MW (and growing)
Source: Company information.

                                                                                                                                               31
Standard case of a greenfield solar PV project in
Spain of 50 MW

    Asset                       CYL – SAL I

    Location                 Salamanca (Spain)

    Type of installation      Ground mounted

    Installed capacity            50 MW

    LTM power generation        101.6 GWh

    Net equivalent hours           2,031

    Capex                          €26m

    Financing                    70% / 30%

                           European Power Futures
    Power prices
                                   (EEX)

                           Project IRR     >12%      Equity IRR   >25%

Current PV costs and Spanish market forward prices allow reaching excellent returns on
investment for new PV developments

                                                                                         32
Remuneration scheme of auction projects (250 MW)


                                                                                                                                European power futures (EEX) - Spain
        Auction projects have a guaranteed remuneration                     €/MWh

                                                                                                               54.1
        Projects receive at any moment the merchant price                                                                       49.7            48.7           47.9        47.9

        A floor price of €34/MWh is established so it is equivalent to a
                                                                                                                                                                                        Auction floor
         PPA agreement with the electric system                                                                                                                                         34 €/MWh


                                                                                                               2019E            2020E           2021E          2022E        2023E
        Expected merchant price quite above the floor
                                                                                                                                        Spain            Auction floor
                                                                            Source: European Power Futures – EEX, Spain
       This scheme allows to capture the expected merchant prices
        with the security of a minimum prices in case of drop of prices
                                                                                                                             Solaria’s selling price through call options
                                                                                                                90

                                                                             Solaria’s selling price (€/MWh)
                                                                                                                60

                                                                                                                      Floor (€34/MWh)
                                                                                                                30

                                                                                                                 0
                                                                                                                      0                  30                    50                  80
                                                                                                                                                Pool price (€/MWh)
                                                                            Source:                              Company information.

Auction projects have an equivalent remuneration to a PPA with floor price with the electric
system

                                                                                                                                                                                             33
Remuneration scheme of merchant / PPA
projects (>1,000 MW)


                                                                                                     European power futures (EEX) - Spain
        Merchant or PPA                                                     €/MWh

        Projects can sell all or part or the energy to the wholesale                 54.1
                                                                                                          49.7               48.7            47.9    47.9
         market or close a PPA agreement under different cover
         schemes


                                                                                    2019E                 2020E              2021E           2022E   2023E
        Investment grade counterparties
                                                                            Source: European Power Futures – EEX

        Solaria is currently negotiating agreements with investment
         grade counterparties / off-takers                                                                        Increasing price of CO2
                                                                            $/t
        Big players on off takers side are entering into this market
         sector (industrial customers, energy players, new retailers,...)   40.0
         closing its positions on energy generation side
                                                                            20.0                              14.0

                                                                              0.0
                                                                                    2009A 2012A 2015A 2018E 2021E 2024E 2027E 2030E 2033E 2036E 2039E
                                                                                                             Historic Data      Estimation

                                                                            Source:   EUAS - Bloomberg.

Solaria currently in negotiations for PPA agreements with investment grade counterparts

                                                                                                                                                             34
Solaria to present projects in the coming windows
with the objective to reach 300 MW by 2019

       Iberian Electricity market

        Shares power market with Spain

        Competitive opportunities for energy sale to Iberian end customer

       Development platform already ongoing

       Corporate experience can be extrapolated

       Experience & local projects leaders in place

       Grid & Market synergies (REE/REN)

       Grid synergies, nodes opportunities

       Accessibility to grid operators

Target is to have 300 MW of ready-to-build pipeline in 2019

                                                                             35
Identified pipeline in Italy of c.200 MW that can be
developed within the next 18 months

       Italy has the highest energy prices in the forward             Current operating assets of Solaria in Italy
        market
                                                                                                                                         Italy
        Even with more than 17 GW of PV already installed, energy
                                                                                                                                       16.7MW
         prices are the highest in Southern Europe
                                                                                                 1
                                                                                                                          1    Marche        4.9 MW

                                                                                                                          2    Uta           5.8 MW

                                                                                3
        Solaria has been present in this market since 2009                      2 4
                                                                                                                          3    Ollastra      1.7 MW

       Local knowledge is critical to succeed
                                                                                                                          4    Sardinia      4.3 MW

                                                                       European power futures (EEX)
                                                                      (€/MWh)


                                                                                 57.7
                                                                                                                   53.8                   52.9
        Possible auctions to be held

        Some auctions could be deployed in the mid-short term

        Even without auctions, current prices more than justify PV
         developments
                                                                                      2019                          2020                    2021
                                                                                               Spain       Italy   Germany    France
                                                                       Source: European Power Futures – EEX.

Objective to have ready-to-build pipeline in Italy of 200 MW by the end of 2019

                                                                                                                                                      36
Objective in France to develop around 100 MW in
the next 18 months

       Prices provide attractive returns to PV developments

        The prices in France are in the lower range compared with Italy
         or Iberia, but still can provide excellent returns for new PV power
         plants

       Auction scheme in place

        France has a specific auction process in place, tendering around
         500 MW per year

        Government has sated its intention to speed up the deployment          European power futures (EEX)
         of new PV capacity                                                    (€/MWh)

                                                                                                        46.4                          43.1             41.8

                                                                                             2019                            2020               2021
                                                                                                        Spain       Italy   Germany    France
                                                                                Source: European Power Futures – EEX.

Objective to have ready-to-build pipeline in France of 100 MW by the end of 2019

                                                                                                                                                              37
Strong development ability driving cost
optimization

 Solaria’s investment costs well below the industry
 average                                                         Long track record as modules manufacturer,
                                                                  EPC contractor, and plant operator provide
          Solaria’s Capex breakdown for a 50 MW PV plant
                                                                  Solaria a deep knowledge of the PV market to
                                                                  reduce the installation costs
                2%                         PV modules
              7% 2%                        Inverters
            3%                                                   Abilities range from the capacity to split supplies,
                                           Trackers               interevent on supplier selection, development of
                                                                  frame work agreement and supervise execution
      25%                         54%      Civil works

                                           Electric works
                                                                 Greenfield portfolio is developed in-house
                                           SCADA & Security
                 7%                                               which implies, in addition to a “real project focus”,
                                           HS & Other             a significant reduction of the costs

Source: Company information.

                                                                 Solaria origins as manufacturer have been
          Solaria installation costs are                          saved in terms of lean and efficient structure
               currently less than
                               0.52 €/Wp

                                                                                                                          38
Greenfield investment plan will be driven by
continuous reduction in solar PV installation costs

           Greenfield capex 2018E-21E

                                             Greenfield projects typically   70% debt
                                             financed

                                  Debt
    ~70%                          financed   Installation costs currently around
                                             €0.52/Wp

                     Capex

                                                                                        39
4. Financial highlights and operational targets
Financial highlights: strong growth, high margins

 Production              Revenues                                 EBITDA
(GWh)                   (€m)                                     (€m)

                                                                           78%            92%

                 87                                     31                                   29

                                  16
         39                                                                12

        2016A   2017A            2016A              2017A                2016A           2017A
                                                                                 EBITDA Margin

 Net income              Net financial debt                       Tax credits
(€m)                    (€m)                                     (€m)

                                               Non-recourse                         No expiration
                                163                                      153          date
                                                debt
                 15
                                               Fixed interest                       Significant FCF
                                                                                      increases
                                                rates
         8
                                               Long term                            Up to €38m in
                                                                                      potential cash
                                                maturities
                                                                                      savings
        2016A   2017A          1Q 2018                                  2017A

                                                                                                        41
Solaria plans to construct at least 1.3 GW of solar
PV plants in Spain within the next 3 years…

                                          New project execution plan

               Includes 250 MW from
                the Spanish Auction                             650MW      1,300MW

                                450MW

     200MW

       2018E                      2019E                            2020E    Total additional
                                                                           capacity in 2021E

                                                                                               42
… that will translate into significant EBITDA and
FCF growth

         Accumulated                          Total expected           Forward power    Expected EBITDA   Typical FCF
        execution plan                         investment                 prices(1)         margin        conversion
(MW)                                                               (€/MWh)

                        1,300
                                                                      54
                                                                             50   49

              650
                                              ~ €650m                                     > 80%           > 55%

   200

                                            Solaria installation
                                            costs are currently
 2018E      2019E      2020E                less than 0.52 €/Wp     2019E 2020E 2021E

 Solaria minimum target returns : Project IRR >12%; Equity IRR >25%

Note:    FCF conversion = FCF / EBITDA.
(1)      As per the European Power Futures – EEX, Spain.

                                                                                                                        43
On top of the greenfield developments, selected
brownfield capacity will be added

      Track-record of value accretive acquisitions in attractive markets

      Value accretion driven by economies of scale, operational and financial outperformance

      Identified opportunities in a number of stable markets with low counter-party risk

                                                                                                44
5. Closing remarks
Solaria – the Green Energy GrowthCo

     Solaria is the only European pure solar PV player with proven experience across the value chain

               Solaria strategy is based on the development of greenfield projects and selective brownfield
                acquisitions with a focus on delivering generation portfolio, EBITDA and FCF growth

                     Solaria has ~2,300 MW of greenfield development projects targeted in well-known and
                      attractive regions

                     Solaria plans to construct 1.3 GW of solar PV plants in Spain within the next 3 years

               Solaria is well positioned to become the leading solar PV power generation player in Spain

     Solaria continues its successful brownfield strategy with the completion of the acquisition of 4.3 MW in
      Italy while is currently negotiating the refinancing of its entire portfolio in the country (c.€50m)

                                                                                                                 46
Q&A
You can also read