A brand new merchant world - Perspectives and transaction analyses for renewable energy - Deloitte
←
→
Page content transcription
If your browser does not render page correctly, please read the page content below
A brand new
merchant world
Perspectives and transaction analyses
for renewable energy
June 2020
2 | Onshore renewables 2020

The future looks bright
…also commercially!
                    Editorial by Troels E. Lorentzen

                     T      he days of industry reliance on government subsidies have come to an end.
                            The trade-off between economics and sustainable energy has faded. Grid
                            parity and merchant projects are real. Onshore renewables like onshore wind and
                      solar PV have managed to reduce LCOE (levelised cost of electricity) at a remarkable pace.
                      Solar PV in particular (see the Spotlight article on page 8).

                                              In Denmark, fixed project support for solar PV projects ended in
                                              May 2016, and for onshore wind projects in February 2018. The
      Contents                                support schemes were replaced by technology-neutral auctions in
                                              November 2018 and 2019.
   4 FEATURE
                                              Both onshore wind and solar PV projects were awarded support
      BeGreen to build Scandinavia's          at auctions (premiums to spot market prices). At the first auction,
      largest solar park                      the average winning bid was 2.28 øre/kWh (c. EUR 3.06 per MWh)
                                              and in the second auction the average winning bid was 1.54
   8 SPOTLIGHT                                øre/kWh (c. EUR 2.06 per MWh). The latest auction in 2019 was,
                                              in fact, undersubscribed.
      Consequences of cost-
      competitive renewable energy
                                              With Denmark having some of the lowest market prices of
 12 ANALYSIS INTRO                            electricity in the world, this tendency will likely be global.
      Introduction to transaction
      analyses                                Projects have been announced to be built without government
                                              support (see the Feature article on page 4), and it is not likely that
 15 ANALYSIS WIND                             we will see new auctions soon. Project developers and project
                                              owners will need to deal with a merchant world for renewable
      Onshore wind transactions               energy.

 17 ANALYSIS SOLAR

      Solar PV transactions

 19 FINANCIAL ADVISORY

 20 CONTACTS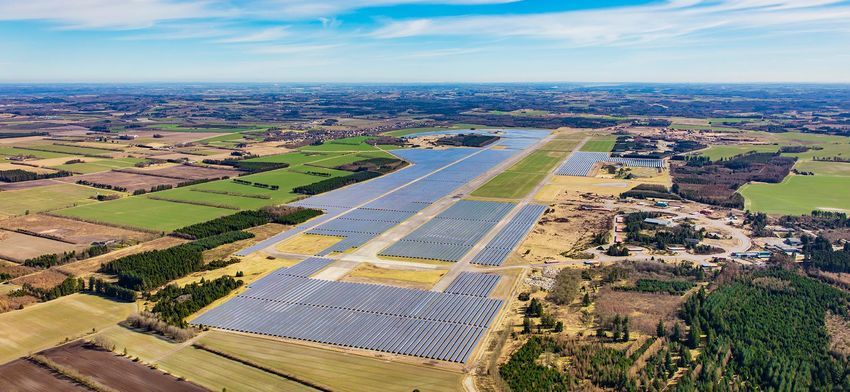
3 | Onshore renewables 2020

The rise of the corporate PPA
In the transition from subsidised to merchant
projects we have seen corporates offering to
offtake power on long-term purchase agreements
(corporate PPAs). This does not only echo the
increased focus on ESG (environmental, social and
corporate governance) but also makes good
economic sense for corporates. And corporate
PPAs allow for project financing to the benefit of
project developers and project owners.
                                                       There is a direct link between project costs and
However, corporate PPA markets are still               LCOE and between project costs and transaction
immature and limited to greenfield projects and        prices. However, there are some time lag effects
large corporates with high credit ratings.             before we see the drop in LCOE in transaction
Corporate PPA markets will need to be simplified       prices.
and standardised to be relevant in the long term.
                                                       Further, the increased merchant exposure, which
In recent years, assumed lifetime has increased by     cannot be offset by corporate PPAs, will leave
10-20 years depending on technology and land           investors requiring an additional risk premium.
lease options. Most corporate PPAs have a 10-year      How this will be estimated, I am not sure, but it
tenor, which is much shorter than most                 will likely be overestimated for the first generation
government support schemes. As a consequence,          of merchant projects. Remember, merchant risk is
all projects will have a higher degree of merchant     fundamentally good. For utilities: this should be
exposure.                                              your DNA, and for financial investors: remember
                                                       electricity prices are uncorrelated with capital
                                                       markets and other investments.
The impact on transaction prices
Our latest analysis finds the average transaction
                                                       What will the future look like?
price of installed onshore wind projects to be EUR
1.6m per MW (see transaction study on page 15).        Grid parity will lead to an increase in renewable
This result is consistent when comparing to our        energy. Great. However, electricity markets are
latest study in 2017 and our first study in 2010. We   not organised to absorb a high degree of non-
find the average price of installed solar PV to be     dispatchable renewable energy or to recover
EUR 1.8m per MW (see transaction study on page         capital expenditure and costs.
17). This is a decrease of EUR 0.4m per MW since
our latest study in 2018 and a decrease of EUR         As the renewable energy sector offers a solution
1.7m per MW since our first study in 2010.             for the energy transition towards carbon neutrality
                                                       by the second half of this century, the future will
                                                       inadvertently make the power sector reorganise to
                                                       solve these problems.

                                                       On the supply side, we will see stronger and more
                                                       connected grids, a better balance of technologies
                                                       and large investments into power-to-X
                                                       technologies. On the demand side, we will see
                                                       electrification and consumer response
                                                       technologies, as the retail market moves towards
                                                       hour-by-hour pricing.

                                                       The future looks bright … also commercially!
4 | Onshore renewables 2020

       FEATURE

       BeGreen to build
       Scandinavia's largest
       solar park
       It will be the first solar park
       in Denmark financed 100%
       free of subsidies
5 | Onshore renewables 2020

           FEATURE

         “W                                                         An important step for the green
                          e will be quite busy for a while, which
                          also applies to a large number of
                                                                    transition
                          manufacturers and sub-suppliers,"
           says the co-founder and chairman of BeGreen,             As the new solar cell project is based on purely
           Anders Dolmer, from his office. Outside, the sun's       commercial terms, there is no longer any excuse
           rays hit the stunning landscape of fields, meadows       for not fostering the green transition in Denmark,
           and lakes. Soon, they will also hit a solar park with    according to Anders Dolmer.
           an area equal to 400 soccer fields further west.
           More specifically, at the decommissioned airport
           in Vandel. Here BeGreen is constructing its new
           solar park, which will be located next to the
                                                                    "When we established
           company's first solar park, which today is the           BeGreen, the ambition was to
           largest solar park in the Nordics.
                                                                    become the first company in
           "We are in the process of breaking our own
           record, and we expect the new park to have a
                                                                    the world to build solar parks
           capacity of 155 MWp“.                                    without any subsidies … We
                                                                    are realising this now”.

                                                                    "It should no longer be an obstacle that tax payers
                                                                    will not pay for power production. In this way, this
                                                                    project is ultimately sustainable, both energy-wise
                                                                    and economically“, he says, stressing that this
                                                                    applies on several parameters.

                                                                    When BeGreen establishes a solar park, the
                                                                    agricultural area is converted into grass, which, in
                                                                    addition to binding carbon and nutrients in the
                                                                    soil, ensures that there can continue to be
                                                                    agricultural production in the area. In the past,
                                                                    BeGreen has used sheep to keep the grass among
Anders Dolmer                                                       the solar cells under control, but going forward
Co-founder and chairman of BeGreen                                  BeGreen is planning to cut the grass, which will be
                                                                    used for animal nutrition with any residual organic
           This will be sufficient to meet the annual energy        waste being used as a feedstock for biogas.
           needs of 34,000 households and reduce annual
           carbon emissions by 135,000 tonnes of CO2 per            "This allows us to recirculate carbon back to the
           year. However, this is not the only milestone            soil. In addition, we will not use pesticides for the
           which Anders Dolmer is proud of. The new solar           40 years that the project is expected to be in
           park will be the first of its kind to be built without   operation, which is good for the groundwater“, he
           any subsidies.                                           said, adding:

           "When we established BeGreen, the ambition was           "As we come from an agricultural background, it
           to become the first company in the world to build        means a world to us to help ensure a sustainable
           solar parks without any subsidies. We are realising      food industry. One thing is to locate some energy
           this now, and of course it means a lot to our            plants on your land; another thing is to continue to
           company that we can show that we are executing           produce food at the same time. Not many people
           on our ambition“.                                        incorporate that part“.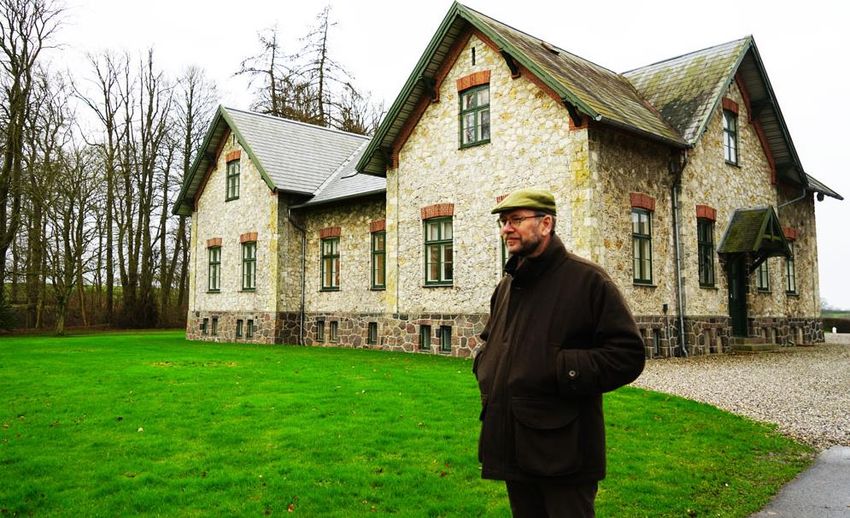
6 | Onshore renewables 2020

FEATURE

                                                       According to Deloitte's expert Troels E. Lorentzen,
                                                       who has followed the development of Danish solar
                                                       parks for a number of years, it will become a game
                      snapshot                         changer for the market that subsidies are no
                                                       longer necessary. He believes that the Danish
BeGreen develops, constructs and operates              market has seen the last round of subsidies,
large-scale solar parks and energy storage             namely the one that took place in December 2019.
solutions with a focus on Denmark, Sweden
                                                       "No more subsidies and auctions within this space.
and Poland.                                            The whole green movement with climate-
To date, BeGreen has 120 MWp installed                 conscious consumers that is taking place in these
                                                       years is pushing companies to deliver economically
capacity and aims to develop and construct
                                                       sustainable solutions“, he says and continues:
an additional 4 GWp by the end of 2025.
                                                       "The diametrical opposite of subsidies is to build
                                                       solar cells and produce at the given spot price.
Commercial terms are a game                            However, there is also a middle course, namely the
changer                                                possibility of selling power on long-term contracts
                                                       funded either through a wholesaler or
Anders Dolmer has not regretted switching from         commercially through a corporate PPA”.
farm work to solar energy production. And as the
new solar park can run on purely commercial
terms, this is indeed an exciting milestone.

"It is one of the most exciting industries you can
possibly deal with. There has been a fantastic
technological development, which has made a
solar cell almost twice as efficient within a few
years measured on one year's production”, he
says.

"At the same time, the price of solar cells has
fallen, giving you high quality at a significantly
lower price. A few years ago, solar projects were
not profitable at all without subsidies, but this is
actually the case now“.

“The diametrical opposite of subsidies is to build solar cells and
produce at the given spot price. However, there is also a middle
course, namely the possibility of selling power on long-term
contracts funded either through a wholesaler or commercially
through a corporate PPA“.
7 | Onshore renewables 2020

            FEATURE

            Great potential – and crucial
            limitations                                              Deloitte’s role in the project
            According to the latest forecasts presented by

                                                                     “
            Energinet, the Danish electricity transmission
            system operator, Denmark can look forward to                   Deloitte has been a cornerstone of the
            more than a doubling of electricity consumption          project since the beginning. Deloitte has
            by 2050. This requires a significant expansion of        made the financial model we have been
            the energy grid, Anders Dolmer points out.
                                                                     working on and has put a lot of efforts into
            "There is no doubt that politicians are aware that       the development. There are continuously new
            our infrastructure needs to be dramatically              things to deal with, and Deloitte has ensured
            expanded to cope with this. It will also be one of       that all these issues have been implemented,
            the most significant constraints on how to develop       validated and, above all, discussed. This is
            the energy industry, whether it is wind, solar or
                                                                     absolutely crucial, as the margins are
            something third”, he says, and adds:
                                                                     relatively small, so a small calculation error
            "The grid and the expansion of the grid are              can have a major impact. And then there is
            absolutely crucial for how this is going to happen.      the entire M&A process, where Deloitte has
            We work to incorporate batteries into our solar
                                                                     been our core financial and tax adviser and
            parks, both for long- and short-term storage of

                                                                                                           “
            energy. This will be absolutely crucial to utilise the   made sure that we achieved our goal.
            existing grid and will be a big part of the solution“.
                                                                     Anders Dolmer
            The solar park is expected to start construction in      Co-founder and Chairman of BeGreen
            2020 and produce its first power in 2021. BeGreen
            has several similar projects in the pipeline.

BeGreen’s solar park, Vandel
8 | Onshore renewables 2020

SPOTLIGHT

Consequences of cost-competitive
renewable energy
After years of continuous decline, the cost of renewable energy
is now at a level where it can challenge the cheapest
conventional power sources. As a result, new renewable
projects are being commissioned without any subsidy support.
However, subsidy independence comes with new obstacles for
renewable project developers. The future leaders of power
production will be the ones that manage to mitigate merchant
risk, market volatility and profit cannibalisation.

A
         fter almost a decade of continuous                                           the average power price that a project should
         improvements in cost-competitiveness,                                        realise to be value-creating. It considers the
         onshore renewables are now consistently                                      expected production and costs of a given project
cheaper than conventional power sources and                                           over its entire lifetime, while also accounting for
moving into all-merchant territory. Improvements                                      the cost of capital. The LCOE of onshore wind has
in cost-competitiveness have come from both                                           been within the fuel cost range1 since IRENA
overall cost reductions and better energy yield.                                      started collecting data in 2010, and solar PV since
Onshore wind projects are achieving larger rotor                                      2014.
diameters and turbine sizes, resulting in improved
capacity factors. For solar PV, dramatic decreases                                    For 2019, IRENA estimated the average LCOEs of
in the price of PV modules have driven an average                                     onshore wind and solar PV at 47 EUR/MWh and 61
reduction in costs of 17% per year from 2010 to                                       EUR/MWh. Both estimates are close to the lower
2018.                                                                                 end of IRENA’s fuel cost range, which spans from
                                                                                      44 to 155 EUR/MWh. Auction data indicates that
Cost-competitiveness is measured using levelized                                      by 2021, onshore wind and solar PV is consistently
cost of electricity (LCOE), a standardised concept                                    undercutting the cheapest conventional power
developed to benchmark all electricity generation                                     sources with prices of 35 EUR/MWh and 38
technologies against each other. LCOE represents                                      EUR/MWh, respectively.

1) The fuel cost range represents the cost of power generation for fossil-fuelled power sources. According to IRENA (2020), the cheapest fossil-fuelled power
source is coal.
9 | Onshore renewables 2020

SPOTLIGHT

Figure 1: Solar PV and onshore wind LCOE
EUR/MWh (2019)

                                                             112
                                                                           102

                                                                                         82
     77       74           74          73                                                       70
                                                  68                                                                                Low end of fuel cost range
                                                             61             59                          61
                                                                                                                                    Solar PV - LCOE
                                                                                                                                    Solar PV - Auctions
                                                                                  57                           42
44                                                                                                                     38
                                                                                                52                                  Onshore wind - LCOE
                                                                                                        47
                                                                                                               39                   Onshore wind - Auctions
                                                                                                                       35
                    Cost-competitiveness against coal-fired power plants

  2010       2011         2012       2013        2014       2015           2016   2017         2018    2019   2020    2021

Sources: Renewable Power Generation Costs In 2018 and 2019, IRENA (2019 and 2020)

According to IRENA, this is cheaper than the                                                  For European plants, emission costs are tied to
marginal cost of around 800 GW of already                                                     European Emission Allowances (EUAs). The
operational coal-fired power plants2. This means                                              pre-announced supply stop in 20194 caused EUA
that the LCOE of onshore renewables can compete                                               prices to triple during 2018 and 2019. Following
with the marginal production costs of a coal-fired                                            the spread of COVID-19, EUA prices took a 36%
power plant, even after including fixed costs such                                            drop in 10 days in March 20205.
as depreciation and overhead costs in the LCOE
calculation.                                                                                  We have yet to see the long-term impact of these
                                                                                              fluctuations on power prices, LCOEs and the
                                                                                              profitability of renewable projects. Either way,
The LCOE represents the average                                                               increasing demand for renewables positions them
                                                                                              to continue their cost reductions and challenge
power price that a project                                                                    conventional power sources. While this still leaves
should realise to be value-                                                                   the issue of intermittent production for
                                                                                              renewables, the CEO of Nextera, a leading North
creating, considering expected                                                                American energy company, predicts that battery-
lifetime production and costs                                                                 backed wind and solar will be cheaper than gas-
                                                                                              and coal-fired plants by 20256.
while also accounting for its cost
of capital.                                                                                   Merchant price risk:
                                                                                              The rise of the corporate PPA
In other words, it will in some cases be cheaper to                                           Parallel with reductions in LCOEs, subsidy regimes
build a new onshore wind farm than to use already                                             are being phased out, which forces developers to
built coal-fired power plants to produce electricity.                                         focus on projects that depend entirely on
                                                                                              merchant revenue. We are also seeing the end of
Since IRENA’s fuel cost range was calculated, the                                             subsidy support for some existing projects that will
individual cost parameters for fossil fuel                                                    now have to rely on merchant revenue. The
technologies have fluctuated. The prices of oil, gas                                          volatility of wholesale power prices includes a
and coal have all declined since late 2018. Most                                              much higher revenue risk than the steady and
notably, the 2020 oil price war pushed Brent crude                                            predictable prices in subsidy regimes.
oil prices down by 72% in the first quarter of                                                Consequently, project developers are looking for
20203.                                                                                        ways to reduce the market exposure in all-
                                                                                              merchant projects.

2) Renewable Power Generation Costs In 2019, IRENA (2020); 3) Europe Brent Spot Price FOB, U.S. Energy Information Administration (2020); 4) In 2019, the
EU Market Stability Reserve started tightening supply of emission allowances by absorbing new allowances into a reserve instead of auctioning them into the
market; 5) EEX EUA Primary Auction Spot Report 2020; 6) NextEra CEO: “Near-firm renewables cheaper than fossil-fuel power by 2025”, Recharge (2020)
10 | Onshore renewables 2020

           SPOTLIGHT

                                                                                             market research and negotiation. This is weighed
       Power purchase agreements                                                             against the convenience of trading electricity and
                                                                                             certificates through the well-established power
                                                                                             exchanges that can already provide hedging
                                kWh                                                          options and renewable energy certificates for
                                                                                             corporates, although on shorter terms and to a
                                                                                             lesser extent. Existing examples of corporate PPAs
                                                                                             are therefore most predominantly seen among
Supplier                        PPA                             Buyer                        data-intensive tech companies that have the
                                                                                             electricity consumption, the CSR focus and the
                                                                                             market insight to outweigh transaction costs7.

                             Payment

           Part of the solution is the corporate power
           purchase agreement (corporate PPA), a supply
           contract with a guaranteed fixed price for
           renewable electricity. Renewable energy
           producers are offering PPAs to corporates with the
           value proposition of long-term cost certainty and
           better ESG scores in the form of renewable energy
           certificates. In return, developers are able to
           secure prices for 10 to 20 years, achieving the
           same low risk as subsidies (assuming a similar
           counterparty risk). This can provide the last piece
           of the puzzle for project developers looking to
           secure project financing with a lender or investor
           that demands low revenue risk.
                                                                                             Large utility companies are best positioned to
           In practice, the corporate PPA is a concept under                                 drive the standardisation and market development
           refinement. There is no standardised public                                       of corporate PPAs in the short term. Firstly, their
           market for corporate PPAs, and corporates will                                    existing market contact and branding give them a
           therefore have to invest time and resources into                                  natural position to push corporate PPAs in the
                                                                                             market. Secondly, supplying corporate PPAs
                                                                                             requires the balance sheet to solve the balancing
           “ … With expected                                                                 issues of matching supply and demand between
           standardisation and declining                                                     supplier and off-taker. Utilities have the portfolio
                                                                                             size and diversity of assets to mitigate the risk of
           transaction costs, the                                                            supply shortages on their own side and
                                                                                             cancellation or default from the off-takers side.
           corporate PPA market will                                                         Finally, utilities have the corporate setup and
           become more open to all                                                           market insight necessary to navigate the currently
                                                                                             complex market of corporate PPAs.
           suppliers over time and
                                                                                             With expected standardisation and declining
           perhaps convince corporates                                                       transaction costs, the corporate PPA market will
           to leave the convenience of                                                       become more open to all suppliers over time and
                                                                                             perhaps convince corporates to leave the
           the electricity spot market“.                                                     convenience of the electricity spot market.

           7) “Analysis of the Potential for Corporate Power Purchasing Agreements for Renewable Energy Production in Denmark”, Danish Energy Agency (2019)
11 | Onshore renewables 2020
SPOTLIGHT
Renewables are increasing volatility However, stronger grids will not alone solve the
and cannibalising own profits problems that renewables bring. In an ‘all-other-
things-held-constant’ scenario, increasing
Despite successful hedging of market risks, project renewable penetration will decrease the power
developers will still be faced with increased price. This is due to the auction design in the
market volatility. As market penetration for electricity spot market. Renewable technologies
renewable energy is expected to increase, enter the merit order9 at the bottom with a
volatility is expected to increase due to the marginal cost of zero. At the top of the merit
intermittent production of renewable power order, high-cost fossil-fuel technologies like oil and
sources. gas are pushed out of the supply curve, resulting in
a lower wholesale price of electricity.
The increasing volatility can partly be offset by Consequently, renewable energy will continuously
improved electricity grids. Interconnectors undercut all other technologies and cannibalise its
between countries can distribute supply and own profits.
demand across a larger geographical area to even
out market volatility when renewable energy If no new market-ready technologies emerge, the
sources collectively are at either standstill or peak expectation is a race to the bottom. To avoid this,
production. The EU is setting targets for individual market players will have to come up with
member states to reach a certain level of technologies that can store electricity for longer
integration8, prompting them to build and durations, convert electricity into other energy
strengthen interconnectors across borders. This is forms and strengthen demand-side responses to
specifically done to integrate a growing share of market volatility. Future leaders of energy are
renewables into the grid and ensure security of companies that invest in the technology that
supply. achieves market-readiness first.
Figure 2: The merit order effect illustrated
Old supply New supply
Price per curve curve
unit
energy
New market The power supply
capacity driven curve has shifted to Some conventional
by renewables the right high-marginal cost
Pold producers are
being replaced
Merit order
effect
Pnew
Renewables Nuclear Hydro Coal Natural gas Oil
Low marginal costs High marginal costs Power
source
8) Towards a sustainable and integrated Europe (2017), European Commission Expert Group on electricity interconnection targets
9) In the electricity spot market, each producer bids for demand based on its marginal cost. Producers are then brought online to meet demand starting
from the lowest marginal cost until all demand is covered. Producers with the highest marginal cost are therefore less likely to be brought online than
producers with the lowest marginal costANALYSIS INTRO Transaction analyses Our 2020 study finds that transaction multiples for installed onshore wind assets have remained relatively stable, while prices of installed solar PV assets have increased slightly in recent years, following a large decline between 2015 and 2016
13 | Onshore renewables 2020

ANALYSIS INTRO

Introduction
Since the release of our latest transaction analyses1, we have
added 111 transactions of onshore wind farms and 70
transactions of solar PV farms to our dataset.

                                                                                        change in market pricing, across time and

O
        ver the past decade, Deloitte has tracked
        transaction pricing developments in the                                         development stage.
        global onshore renewables industry,
publishing results on an approximately annual                                           The results in this publication are based on a
basis, with our latest publications on onshore wind                                     sample of 439 onshore wind and 349 solar PV
being in 2017 and on solar PV in 2018.                                                  transactions from 2005 to 2020. We note that
                                                                                        transaction prices depend on a wide variety of
In the same way that many M&A practitioners                                             factors, such as local weather conditions,
value companies using price multiples on earnings                                       operating efficiency, power price agreements,
and book values, renewables can be valued using a                                       local tax rules, subsidies, financing and other
price multiple per MW. Although an EV/MW                                                synergies – most of which are country-dependent.
multiple cannot compete with the level of detail
that a DCF analysis provides, it serves as a good                                       The quality of the analysis is critically dependent
starting point for a renewable asset valuation and                                      on the quality of the underlying dataset. We have
a time-efficient sanity check in a transaction                                          only included transactions where the transaction
process.                                                                                enterprise value (EV), the total capacity of the
                                                                                        target’s assets and the project stage of each asset
Based on a large quantity of publicly available                                         have been clearly disclosed and verified.
transaction data, and using our industry
experience and insights, we calculate                                                   In the following two sections we present the
representative transaction multiples (EV/MW2                                            results of our onshore wind and solar PV
multiples) for both types of onshore renewable                                          transaction analyses. To account for the continued
assets across development stages. See figure 3                                          improvements in cost-competitiveness, for solar
below for details on the various project                                                PV in particular, we perform both a regression on
development stages.                                                                     the entire sample and a rolling regression on the
                                                                                        60 most recent transactions.
We review each publicly available transaction with
pricing data and make relevant adjustments as
appropriate before adding to our dataset. This
dataset provides the basis on which we calculate                                           Access the full dataset!
price multiples3. Please note that these multiples
may not represent the exact prices that                                                    Further information on geographical effects and
transactions have been executed at (only publicly                                          other sub-analyses is available on request (see
available information has been used, and we have                                           page 20 for contact details). Full access to our
not had access to detailed financials on each                                              dataset can also be purchased via our website.
transaction), but the multiples illustrate the overall

1) “A Market Approach for Valuing Onshore Wind Farm Assets (2017)” and “A Market Approach for Valuing Solar PV Farm Assets (2018);
2) Enterprise value/megawatt of capacity; 3) Specifically, we perform a regression analysis on the pricing data after adjusting for certain variables, such
as transaction stake, currency and stage
14 | Onshore renewables 2020
ANALYSIS INTRO
Figure 3: Onshore renewables development stages
Wind/solar PV project development stages Analysis stages
• Project rights
• Geological study Feasibility
• Initial wind/solar study studies
• Preliminary business case
• Project design
• Environmental impact study
Design & EIA4
• Community engagement
Project development • Updated business case analysis
• Landowner agreements Project development
• Building application/consent
• Grid connection/consent Agreements &
• Potential consent appeal consent
• Updated business case analysis
• IID5/tender award
• Detailed wind/solar study
• Detailed design
• Procurement and reservation contracts
• Updated business case analysis
• Final consent
Maturation • FID6
• Construction
• Commissioning
• Updated business case analysis
• COD7
Construction Construction
• Construction
• Commissioning
• Updated business case analysis
• COD7
Installed Installed
4) Environmental Impact Assessment; 5) Initial Investment Decision; 6) Final Investment Decision; 7) Commissioning Date15 | Onshore renewables 2020
ANALYSIS WIND
Onshore wind farm
transactions
The cost per MW of onshore wind power has
been steady since 2015 with an increasing
uniformity in our dataset
O
ur analysis of 439 onshore wind farm Figure 4: Illustrative lifecycle/value creation
transactions finds that the EV/MW for onshore wind farm assets
multiples for development stage, under
construction and installed capacity are EUR 0.2m, Development Construction Installed
EUR 0.9m and EUR 1.6m, respectively. They are
EV/MW 1.6
illustrated in figure 4 with 95% confidence EURm
intervals. 1.5
1.0
0.7
Onshore wind transaction
multiples (EV/MW) 0.3
0.1 Approved and ready Assets in
for construction operation
Development 0.2m
projects EUR
European transactions make up by far the largest
share of the sample with 276 transactions (63% of
Under 0.9m the dataset), and it appears that European onshore
construction EUR wind assets trade at a minor premium compared
to the rest of the world.
Installed 1.6m Similarly, onshore wind assets in Australia & New
projects EUR Zealand trade at a premium, while Asia, North
America and Central & South America trade at a
discount1.
1) The results for North America and Central & South America are not statistically significant16 | Onshore renewables 2020
ANALYSIS WIND
Figure 5: Enterprise value per installed MW, EURm
Average of 60 most
recent transactions
2.5
Average of entire
sample
2.0
1.5
1.0
0.5
2009 2010 2011 2012 2013 2014 2015 2016 2017 2018 2019
Sources: Deloitte analysis and Clean Energy Pipeline
A rolling regression based on the 60 most recent Concluding remarks
transactions (figure 5) shows that installed
Cost declines, improved yield and the emergence
capacity multiples have been stable during the
of subsidy-free renewable projects do not seem to
entire period analysed. In the sample, volatility has
have had a noticeable impact on the price per MW
decreased, and results have become slightly more
of onshore wind power. Since 2015, the price has
significant, suggesting more uniformity in pricing.
remained steady and become increasingly uniform
This development is consistent with the stable
across our sample. The following years will show
development in LCOE shown on page 9.
whether the challenge of increased market
volatility will affect the business case for onshore
wind power.17 | Onshore renewables 2020
ANALYSIS SOLAR
Solar PV
transactions
Despite decreasing solar PV panel prices, our EV/MW
estimates have increased. The reasons are an increasing
number of brownfield transactions and geographical
shifts in the data.
O
ur analysis of solar PV assets results in Figure 6: Illustrative lifecycle/value creation
EV/MW multiple estimates for for solar PV assets
development stage, under construction
and installed capacity of EUR 0.04m, EUR 0.2m Development Construction Installed
and EUR 1.8m, respectively. 1.9
EV/MW
EURm
These estimates are based on the full sample 1.7
0.3
representing transactions from 2005 to 2020. If we
look at a rolling average of the past 60 transactions 0.2
(figure 7), there has been an increase in the price
multiples for installed and under construction 0.3
solar PV assets since 2015. 0.0 Approved and ready Assets in
for construction operation
Solar PV transaction The increase seems counter-intuitive considering
multiples (EV/MW) the significant decrease in LCOE in the same
period. We believe the increase can be explained
by three factors.
Development 0.04m
projects EUR Firstly, European and especially Southern
European solar PV farms trade at a premium
compared to the rest of the world. European
Under 0.20m transactions make up almost 50% of newly added
construction EUR transactions, and the data shows that the
European premium has increased significantly
since our latest analysis.
Installed 1.80m
projects EUR18 | Onshore renewables 2020
ANALYSIS SOLAR
Figure 7: Enterprise value per installed MW, EURm
Average of 60 most
recent transactions
3.5
3.0 Average of entire
sample
2.5
2.0
1.5
1.0
0.5
2013 2014 2015 2016 2017 2018 2019
Sources: Deloitte analysis and Clean Energy Pipeline
Secondly, the average age of installed capacity in A rolling regression based on the 60 most recent
the sample has increased. This suggests that the observations shows that installed capacity
sample includes more brownfield projects, which multiples have remained at a level of around EUR
may realise higher prices due to proven financials 1.7m since 2017. Incidentally, this result is quite
and more favourable subsidy schemes. As the close to the regression results from the full
expected lifetime of solar PV assets has been sample.
increasing in recent years, the valuation of these
assets may not be affected by an assumption of a
Concluding remarks
shorter remaining lifetime compared to when they
were first transacted. As the LCOE of solar PV assets continue to decline
towards onshore wind assets, we expect to see
Finally, solar PV transactions in Asia were installed solar PV multiples converge towards
previously subject to a discount compared to the multiples on installed onshore wind. We even
rest of the world. The most recent data shows that expect a future where solar PV is cheaper than
this discount is diminishing. onshore wind.19 | Onshore renewables 2020 FINANCIAL ADVISORY Deloitte Financial Advisory Deloitte Financial Advisory is the only financial audit, risk advisory, tax & legal and business consulting adviser who offers a full suite of services with – both globally and locally. This enables us to match In-house access to subject matter experts within our clients' needs in a professional and efficient way. Deloitte Financial Advisory has a global presence with about 8,400 employees with diverse experience from investment banking, law, venture capital, private equity, consulting, accounting and the industrial sector. Areas of expertise Geographical presence 3,300 employees in Corporate Finance 2,800 employees in North and South America 2,600 employees in M&A 3.500 employees across EMEA 1,300 employees in Valuation Services 2,100 employees in Asia and Australasia 1,200 employees in Restructuring Services
20 | Onshore renewables 2020

CONTACTS

Deloitte Denmark
Weidekampsgade 6
2300 Copenhagen S
+45 36 10 20 30
windandsolar@deloitte.dk

                    Troels E. Lorentzen                                           Peter M. Lildholdt
                    Partner                                                       Vice President
                    +45 30 93 56 90                                               +45 40 35 25 36
                    tlorentzen@deloitte.dk                                        plildholdt@deloitte.dk

                   Mathias V. Therkildsen                                         Claes B. Rasmussen
                   Senior Associate                                               Senior Associate
                   +45 40 28 47 12                                                +45 30 93 47 40
                   mtherkildsen@deloitte.dk                                       clrasmussen@deloitte.dk

                   Lars C. Riddell
                   Associate
                   +45 30 93 46 48
                   lriddell@deloitte.dk

Terms and conditions:

This article and all of its content are property of Deloitte Statsautoriseret Revisionspartnerselskab (”Deloitte”)
and protected by DK and International property rights and laws. You may not publish, distribute or otherwise
disclose the article or any of its content to any third party to use for commercial purposes any material or
results therein.

Deloitte has not verified the information referred to in the article (or the information gathered with connection
to those transactions included in the datasets and models).

While every care has been taken in the compilation of the article and the analyses and results therein and every
attempt has been made to present up-to-date and accurate information, we cannot guarantee that inaccuracies
do not occur.

Deloitte takes no responsibility for any direct or indirect losses, damages, costs or expenses which arise from or
in any connection with the use of the article, including but not limited to investment decisions and financial
decisions based on the article.

Deloitte Statsautoriseret Revisionspartnerselskab is a member of the DTTL network which refers to Deloitte
Touche Tohmatsu Limited, a UK private company limited by guarantee, and its network of member firms and
their affiliates, predecessors, successors and representatives as well as partners, managements, members,
owners, directors, managers, employees, subcontractors and agents of all such entities operating under the
names of “Deloitte”, “Deloitte Touche”, “Deloitte Touche Tohmatsu” or other related names. The member firms
are legally separate and independent entities and have no liability for each other’s acts or omissions.
This communication contains general information only, and none of Deloitte Touche Tohmatsu Limited (“DTTL”), its global network of member firms or their related entities (collectively, the “Deloitte organization”) is, by means of this communication, rendering professional advice or services. Before making any decision or taking any action that may affect your finances or your business, you should consult a qualified professional adviser. No representations, warranties or undertakings (express or implied) are given as to the accuracy or completeness of the information in this communication, and none of DTTL, its member firms, related entities, employees or agents shall be liable or responsible for any loss or damage whatsoever arising directly or indirectly in connection with any person relying on this communication. DTTL and each of its member firms, and their related entities, are legally separate and independent entities. About Deloitte Deloitte is a leading global provider of audit and assurance, consulting, financial advisory, risk advisory, tax and related services. Our global network of member firms and related entities in more than 150 countries and territories (collectively, the “Deloitte organization”) serves four out of five Fortune Global 500® companies. Learn how Deloitte’s approximately 312,000 people make an impact that matters at www.deloitte.com. Deloitte Touche Tohmatsu Limited Deloitte refers to one or more of Deloitte Touche Tohmatsu Limited (“DTTL”), its global network of member firms, and their related entities (collectively, the “Deloitte organization”). DTTL (also referred to as “Deloitte Global”) and each of its member firms and related entities are legally separate and independent entities, which cannot obligate or bind each other in respect of third parties. DTTL and each DTTL member firm and related entity is liable only for its own acts and omissions, and not those of each other. DTTL does not provide services to clients. Please seewww.deloitte.com/about to learn more. © 2020 Deloitte Statsautoriseret Revisionspartnerselskab. Member of Deloitte Touche Tohmatsu Limited.
You can also read