Impacts of urbanization on precipitation patterns in the greater Beijing-Tianjin-Hebei metropolitan region in northern China - IOPscience
←
→
Page content transcription
If your browser does not render page correctly, please read the page content below
LETTER • OPEN ACCESS

Impacts of urbanization on precipitation patterns in the greater
Beijing–Tianjin–Hebei metropolitan region in northern China
To cite this article: Xiaomeng Song et al 2021 Environ. Res. Lett. 16 014042

View the article online for updates and enhancements.

                               This content was downloaded from IP address 46.4.80.155 on 13/03/2021 at 18:53
Environ. Res. Lett. 16 (2021) 014042 https://doi.org/10.1088/1748-9326/abd212
LETTER
Impacts of urbanization on precipitation patterns in the greater
OPEN ACCESS
Beijing–Tianjin–Hebei metropolitan region in northern China
RECEIVED
17 March 2020 Xiaomeng Song1,2,3, Yuchen Mo1, Yunqing Xuan4, Quan J Wang3, Wenyan Wu3, Jianyun Zhang2
REVISED
19 November 2020
and Xianju Zou1
1
ACCEPTED FOR PUBLICATION School of Resources and Geosciences, China University of Mining and Technology, Xuzhou 221116, People’s Republic of China
2
9 December 2020 State Key Laboratory of Hydrology-Water Resources and Hydraulic Engineering, Nanjing Hydraulic Research Institute, Nanjing 210029,
PUBLISHED
People’s Republic of China
3
8 January 2021 Department of Infrastructure Engineering, The University of Melbourne, Melbourne VIC 3000, Australia
4
College of Engineering, Swansea University, Swansea SA1 8EN, United Kingdom
Original content from E-mail: xmsong@cumt.edu.cn
this work may be used
under the terms of the Keywords: precipitation pattern, urbanization contribution, Beijing–Tianjin–Hebei region
Creative Commons
Attribution 4.0 licence. Supplementary material for this article is available online
Any further distribution
of this work must
maintain attribution to
the author(s) and the title
Abstract
of the work, journal We present a statistical method to quantify the contribution of urbanization to precipitation
citation and DOI.
changes during 1958–2017 across the greater Beijing–Tianjin–Hebei metropolitan region in
northern China. We find distinct trends in precipitation in the past six decades: decreasing in
annual and summer while increasing in other seasons. The spatial patterns of precipitation show
discernible terrain-induced characteristics with high values in the buffer zones of plain and
mountain areas and low values in the northwestern mountainous regions. Our results indicate that
although urbanization has limited impacts on the trends and spatial patterns of precipitation, it has
a positive contribution to the changes in precipitation for about 80% of the comparisons
conducted, especially in autumn (100%), with the negative contribution being dominant in
summer (66.67%). In addition, these results are sensitive to the classifications of urban and rural
stations, suggesting that how to classify urban/rural areas is a crucial step to estimate the potential
contribution of urbanization to precipitation changes. These findings also support that
urbanization can diversify and enhance the variations in precipitation, with urban areas becoming
a secondary center along with more increasing or less decreasing trends in precipitation.
1. Introduction intensity, and duration of precipitation or alter its
trajectory (Han and Baik 2008, Shem and Shepherd
Urbanization is one of the essential human-induced 2009, Yang et al 2016, Zhang et al 2018, Manola et al
changes in land use (Kalnay and Cai 2003, Zhou et al 2020). However, the mechanism of urbanization-
2004, Li et al 2019), having profoundly influenced induced precipitation is not well understood because
the local environment and climate conditions. A well- of the difficulty in investigating the compound influ-
known consequence of urbanization is the changes ences of causative factors coming from climate con-
in precipitation patterns over urban areas due to the ditions, geographical settings of cities, and size of
dynamical environmental factors related to aerosol cities (Fu et al 2019). As a result, contradicting con-
emissions (Jin et al 2005), surface and boundary layer clusions have been drawn in previous studies using
feedbacks, and thermodynamic conditions (Shepherd different data sets, spatial scales, analysis methods.
et al 2002). Generally, the causative factors linked to For example, Wang et al (2012) found that urbaniza-
the urbanization-induced precipitation include the tion in the Beijing–Tianjin–Hebei (BTH) region had
urban heat island phenomenon, large surface rough- caused an increase in precipitation amount based on
ness and higher aerosol concentration (Lowry 1998, model simulations. In contrast, in an alternative study
Shepherd 2005, Han et al 2014, Song et al 2014, by Jiang and Li (2014), the authors concluded that
Freitag et al 2018, Lu et al 2019). Any changes in no significant change in precipitation was found in
these factors could inhibit or enhance the formation, observed records in the same region. Therefore, there
© 2021 The Author(s). Published by IOP Publishing Ltd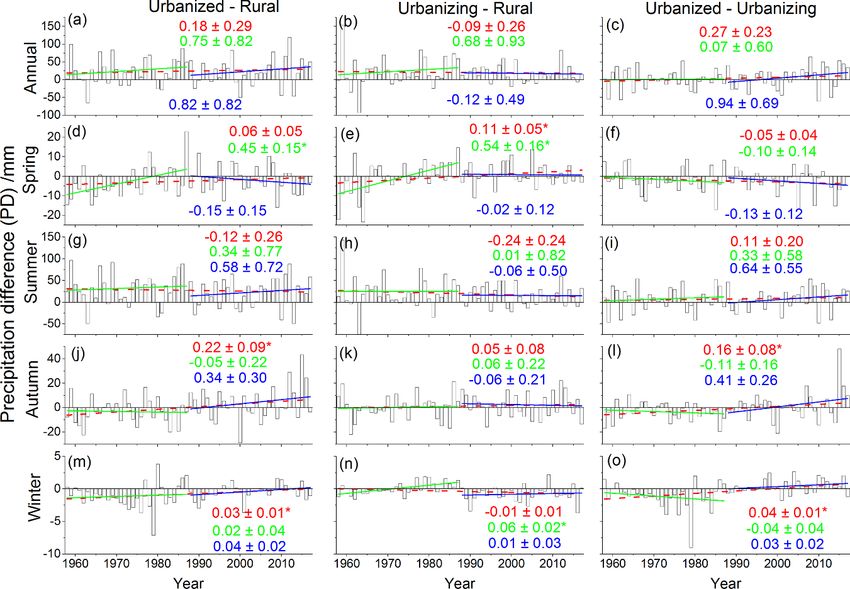
Environ. Res. Lett. 16 (2021) 014042 X Song et al
is an urgent need to understand better the changes because of the effects of early urbanization, but cur-
in precipitation patterns and how they are related to rent high urban development conditions caused no
urbanization. significant increase in rainfall. However, questions
Empirical and analytical approaches have been remain to be addressed regarding the contribution of
used to investigate how different the characteristics of urbanization to precipitation changes.
precipitation are from neighboring regions with vari- Using the BTH metropolitan in northern China as
ous levels of urbanization (Shepherd 2005, Kaufmann a case study, this paper attempts to answer the follow-
et al 2007, Mishra et al 2012, Pathirana et al 2014, ing questions: (a) what is the magnitude of the impact
Song et al 2019b). A significant advantage of these of urbanization on annual and seasonal precipitation
analytical approaches is that they are handy to apply at a regional scale; (b) what is the relative contribu-
at a coarser temporal scale (e.g. annual or decadal), tion of urbanization to the changes in precipitation
which is often enough for assessing the long-term patterns; (c) what is the impact of urban and rural
urbanization impact on precipitation changes. Gen- classification on the estimated contribution of urb-
erally, for these analytical approaches, the possible anization to precipitation changes?
effects of urbanization on precipitation are estimated
by comparing observed records in urban stations with 2. Data and methods
those in their surrounding rural stations. However,
such results largely depend on how rural versus urban 2.1. Data
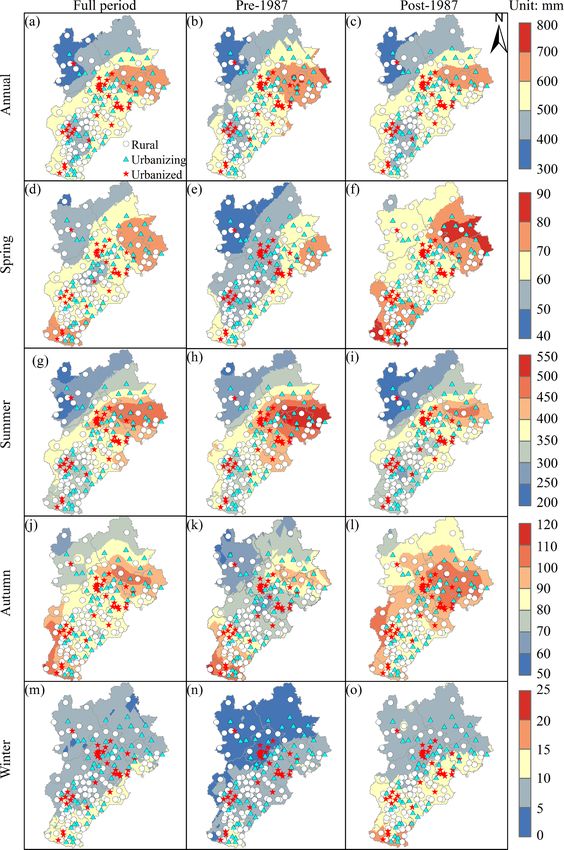
stations are classified; that is, an existential challenge We collected daily precipitation records from 174
is that these approaches may be sensitive to urban- gauges across BTH from China Meteorological
rural classification. For that matter, several previous Administration (CMA) (www.data.cma.cn). Overall,
studies used the area-specific information of popula- the data quality is validated by the CMA accord-
tion, satellite-observed nighttime light intensity, and ing to the Guidelines on the Quality Control of
land cover to identify the urban areas (Lin et al 2018, Surface Climatological Data (Ren et al 2012, Cao
Gu et al 2019a) and to estimate the impacts of urb- et al 2016). However, larger uncertainty may still
anization on precipitation (Fu et al 2019, Zhao et al arise in regions with relatively sparse gauges in the
2019). Generally, the selection of the urban and rural early 1950s (figure S1, which is available online at
stations may bring biases into such studies (Zhao et stacks.iop.org/ERL/16/014042/mmedia). We ana-
al 2006, Wang and Shu 2019). Furthermore, previous lyzed urbanization’s effect on precipitation using the
studies have paid little attention to the uncertainties daily records from 1958 to 2017, divided into two
from the urban-rural classifications due to different 30 year periods: the pre-1987 period (1958–1987)
datasets used, especially for those urban clusters or and the post-1987 period (1988–2017). The pre-1987
metropolitan areas experiencing rapid urbanization. period is recognized as the time with low-level urb-
China has experienced rapid urbanization since anization expansion compared with the post-1987
its reform process started in 1978. Recently, urban period when rapid urbanization expansion came into
clustering has become a notable feature of urbaniz- force (i.e. high-level) (figure S2).
ation in China, e.g. the BTH, the Yangtze River Delta, In this work, we used land use, population and
and the Pearl River Delta (Fang and Yu 2017). The nighttime light data to identify the urban and rural
impacts from the development of urban clusters on areas in BTH. We obtained both population and land
precipitation can be very different from those coming use data (spatial resolution: ∼1 km) in 1990 and
from a single city (Li et al 2009, Sang et al 2013, Chen 2015 from the Data Center for Resources and Envir-
et al 2015, Zhao et al 2019, Song et al 2019a). Sev- onmental Sciences, Chinese Academy of Sciences
eral studies have analyzed the effects of urban clusters (www.resdc.cn). We also obtained the nighttime light
on the regional climate under different climatic con- data in 1992 and 2013 from the Defense Meteoro-
ditions (Wang et al 2012, Jiang and Li 2014, Fu et al logical Satellite Program’s Operational Linescan Sys-
2019, Gao et al 2019). Specifically, some of these stud- tem (National Centers for Environmental Informa-
ies investigated the possible relationships between tion (NCEI) 2019).
urban development and precipitation changes for the
BTH region. For example, Zhang et al (2015) have 2.2. Methods
investigated the impact of urbanization on summer 2.2.1. Classification of urban and rural stations
rainfall in the BTH region using the Weather Research The land use, population and nighttime light data
and Forecasting (WRF) model coupled with urban are used to classify the urban or rural stations. Two
canopy model. It was found that the precipitation criteria are used to identify an urban station in this
in the Beijing–Tianjin–Tangshan metropolitan area process: if the proportion of built-up area (calculated
decreased while increasing in the downwind area. based on land use data) is greater than 33% within
Wang et al (2015) investigated how different degrees the 2 km buffer zone surrounding the station under
of urbanization affect local and regional precipita- investigation (Liao et al 2018); or the station is loc-
tion using the WRF model. Precipitation increased ated in the area which is already classified as urban
significantly over the downwind Beijing metropolis using population density and/or the nighttime light
2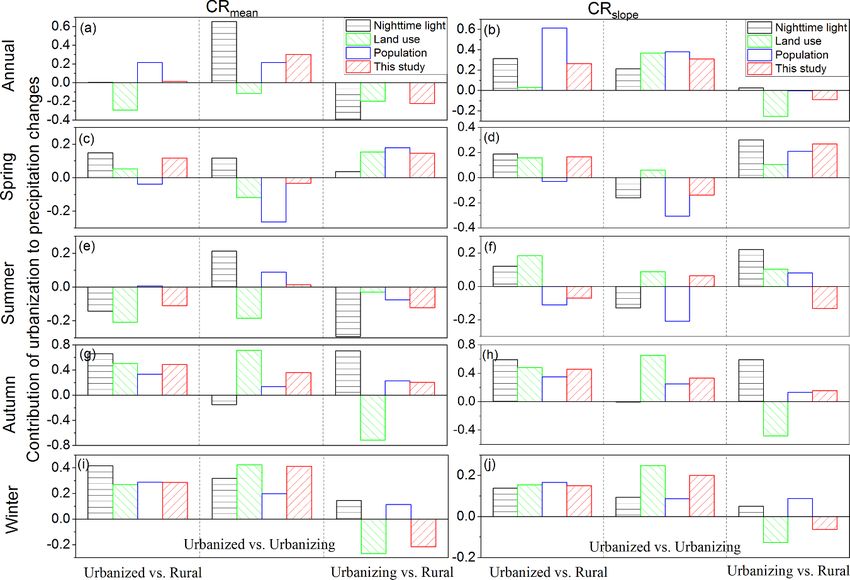
Environ. Res. Lett. 16 (2021) 014042 X Song et al
rCPurbanized −rCPrural
data. For the latter criterion, an area with a population
× 100% Scenario I
|rCPurbanized |
density larger than 1000 persons km−2 or the value of
rCPurbanizing −rCPrural
nighttime light higher than 50 is defined as an urban CRmean = × 100% Scenario II
rCPurbanizing
area (Fu et al 2019, Wu et al 2019). Overall, a station
rCPurbanized −rCPurbanizing
is deemed to be an urban station if one or more of the × 100% Scenario III
|rCPurbanized |
above criteria are met. (1)
This classification procedure is applied to all the
stations over the two periods, i.e. the pre- and post- P̄urbanized_post − P̄urbanized_pre
rCPurbanized = × 100%
1987 periods, to represent urbanization’s dynamic P̄urbanized_pre
process. Limited by data availability, however, the P̄urbanizing_post − P̄urbanizing_pre
pre-1987 urban areas are identified using only the rCPurbanizing = × 100%
P̄urbanizing_pre
data at the end of the 1980s/the beginning of 1990s;
P̄rural_post − P̄rural_pre
and the post-1987 urban areas are identified using rCPrural = × 100% (2)
only the data of 2013 (nighttime light) or 2015 (land P̄rural_pre
use or population). We further classify the stations
where P̄ is the mean value of annual precipitation for
into three sub-categories: (a) urbanized stations with
different areas and periods, with the subscripts pre
their locations in the urban areas for both pre-1987
and post meaning the corresponding values in the
and post-1987, (b) urbanizing stations with their loc-
pre- and post-urbanization periods, and urbanized,
ations in the urban areas in the second period only,
urbanizing and rural for station types, respectively.
and (c) rural stations with their locations in the rural
The r CP is a standardized index to represent the rate
areas in both periods, as shown in figure 1.
of change in precipitation between the pre- and post-
urbanization periods, which is used to remove the
2.2.2. Estimating the contribution of urbanization
impact of the absolute precipitation amount. Here,
to precipitation changes
CRmean < 0 (CRmean > 0) means the negative (pos-
It is essential to recognize that control experiments are
itive) contribution of urbanization to precipitation
needed to quantify urbanization impacts on precip-
changes.
itation changes in both observational and modeling
The second index CRslope , is defined as the ratio of
studies (Liu and Niyogi 2019). Typically, to analyze
the slope from the trends in the urban-rural precipit-
the possible effects of urbanization on precipitation,
ation difference (PD) series to those of urban precip-
a control group would need to be set up for the area
itation series, which can be seen as a measure in the
without urban landscape in the same location. How-
urbanization contribution to precipitation changes
ever, for observational studies, it is impossible to set
and be estimated by equation (3):
twin experiments with identical settings. Usually, a
neighboring non-urban area is considered as the con- bPD
trol group (Changnon et al 1971, Huff and Changnon CRslope = × 100% (3)
|burban |
1973, Kaufmann et al 2007); that is, a comparison
between the precipitation in urban and surround- where burban and bPD are the slopes of urban precip-
ing rural areas is undertaken. With this method, an itation and PD time series. In this study, burban is the
assumption is made that the change of precipitation slope of precipitation trends in urbanized (Scenario I
in rural areas is mainly caused by natural variability or and Scenario III) and urbanizing (Scenario II) areas,
climate changes, whereas the change in urban areas respectively. Both trends of urban series and PD series
is likely affected by the compound effects involving during the study periods are estimated using linear
the role of urbanization. Thus, we propose that the regression. The index bPD can be used to represent
urban-rural differences in the precipitation changes the urbanization effect (Zhao et al 2019), with bPD > 0
are only caused by the urbanization effects, which indicating a positive effect, and conversely bPD < 0 a
can be defined as an indicator to assess the long-term negative effect. Evidently, |CRslope | = 100% denotes
urbanization contribution to precipitation changes. that the urban-rural differences in precipitation are
Here, we use two indices (CRmean and CRslope ) to entirely caused by urbanization. |CRslope | > 100%
quantify the contribution of urbanization to precip- means that an extra trend from other factors may not
itation changes from the three events (i.e. Scenario be considered and detected in this study.
I: Urbanized vs. Rural; Scenario II: Urbanizing vs.
Rural; and Scenario III: Urbanized vs. Urbanizing) 3. Results and discussion
according to the classification of stations.
The first index CRmean , is defined as the con- 3.1. Impact of urbanization on spatial patterns of
tribution ratio of urbanization from the mean val- precipitation
ues, indicating the difference between the mean Figure 2 shows the spatial distribution of annual
precipitation from the urban and rural areas. The and seasonal mean precipitation over 1958–2017.
CRmean can be estimated by equations (1) and (2): The precipitation shows several remarkable NE-SW
3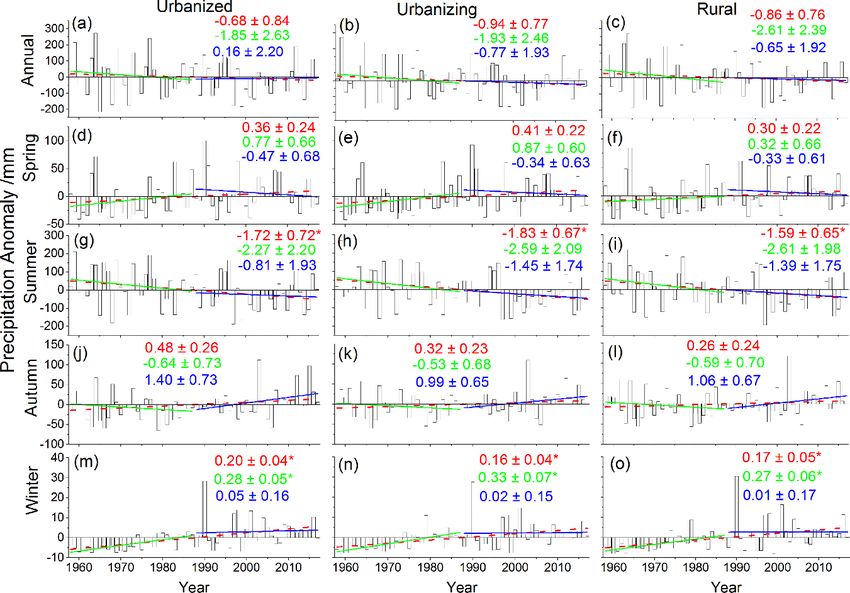
Environ. Res. Lett. 16 (2021) 014042                                                                                             X Song et al

   Figure 1. Classification of urbanized (red star), urbanizing (cyan triangle) and rural (open circle) meteorological stations in BTH:
   (a) the terrain elevation and classification results of meteorological stations used in this study; (b)–(d) the classification resulting
   from the land use data (1990 and 2015), nighttime light data (1992 and 2013) and population data (1990 and 2015), respectively.
   The pie chart shows the ratio of urbanized, urbanizing and rural stations in all the stations.

bands, with high values located in southeastern BTH                     elevation (table S1 and figure S3) and influenced by
and low in the northwest, which is consistent with                      the topographical features of BTH, with the highest
previous work by Song et al (2019a) and Zhao et al                      values located in the buffer zones between the plain
(2018). Overall, the spatial distribution of the mean                   and the mountain areas in the northeastern BTH.
precipitation is strongly correlated with the ground                    However, urbanization also influences precipitation

                                                         4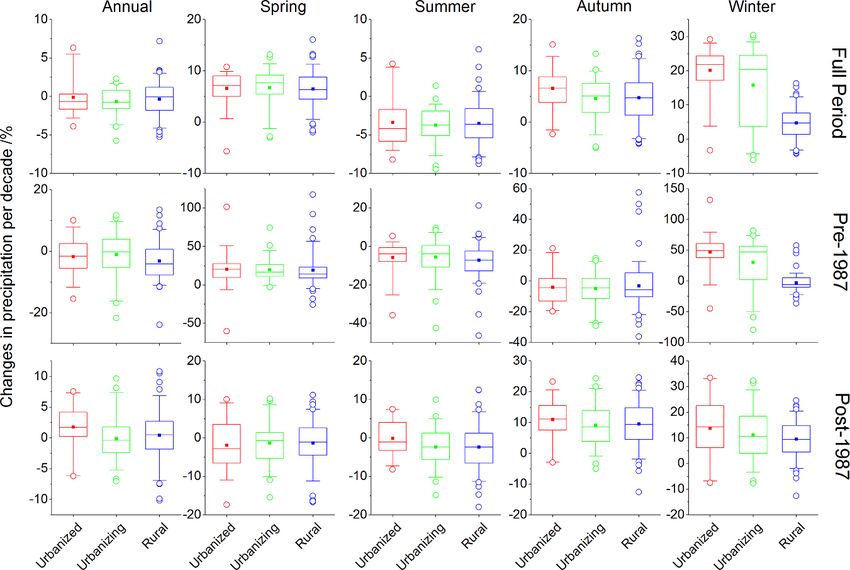
Environ. Res. Lett. 16 (2021) 014042                                                                                      X Song et al

   Figure 2. Spatial distribution of annual and seasonal mean precipitation over BTH during the periods of 1958–2017 (full period),
   1958–1987 (pre-1987) and 1988–2017 (post-1987). The ordinary Kriging method is used to perform the spatial interpolation of
   precipitation based on ArcGIS® 10.2 software.

                                                      5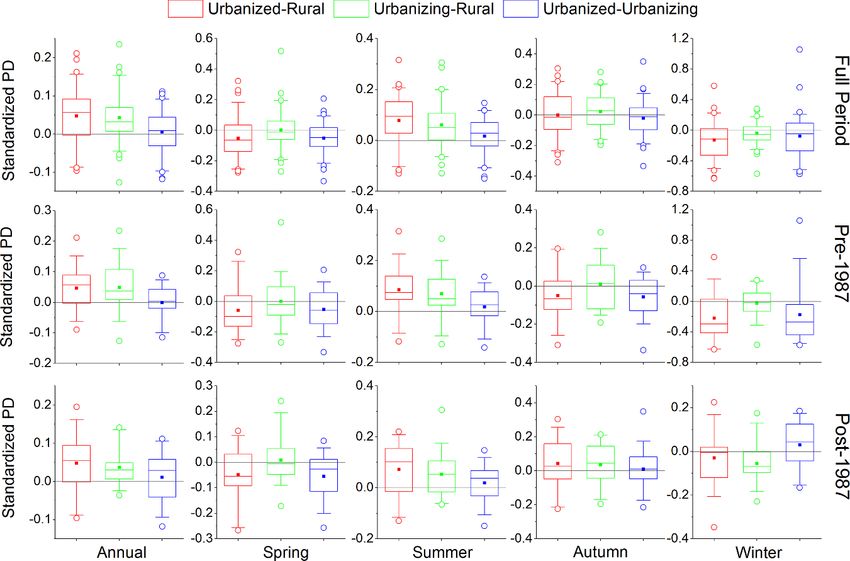
Environ. Res. Lett. 16 (2021) 014042                                                                                         X Song et al

   Figure 3. Statistical results of annual and seasonal precipitation for urbanized, urbanizing and rural stations over BTH during the
   study period. In each boxplot, top whisker, top box, median line, bottom box, and bottom whisker are for 95th, 75th, 50th, 25th,
   and 5th percentiles. The solid squares are the mean values for each group, and the open circles are the outliers for each group.

changes along with the terrain changes (figure S4),                   to 2017 in urbanized, urbanizing and rural areas.
with urbanized regions having the least decreas-                      All regions are found to have decreasing trends
ing magnitude or higher increase in precipitation                     in both annual and summer precipitation for the
following the increase in terrain elevation compared                  entire period while increasing trends are observed in
with those in urbanizing and rural areas.                             other seasons. Among these changes, summer comes
    Figure 2 also shows that the precipitation pat-                   with significant decreasing trends (figures 4(g)–(i)),
terns of both pre- and post-1987 are very similar, with               and winter experiences a significant increasing trend
increase of precipitation from northwest to south-                    (figures 4(m)–(o)). These results indicate that the sig-
east. Figure 3 summarizes the annual/seasonal pre-                    nificantly decreasing trends in summer may dominate
cipitation characteristics for the urbanized, urban-                  the decrease in annual precipitation, which are mainly
izing and rural stations over BTH during the study                    caused by the weakening east Asian summer mon-
period. Overall, except for winter, the mean and the                  soon since the 1970s (Ding and Chan 2005, Song et al
median of precipitation at urban stations are higher                  2019a). When both pre- and post-1987 periods are
than those at rural stations, with the highest values                 considered, similar changes are found in annual and
being in urbanized stations for annual and summer,                    seasonal precipitation, except for spring and autumn.
and urbanizing stations for spring and autumn. These                  Both spring (figures 4(d)–(f)) and autumn (figures
results suggest that urbanization may have a limited                  4(j)–(l)) demonstrate a reversed trend in the post-
effect on the regional distribution of precipitation,                 1987 period, but in different directions. Overall, all
but it may diversify the local precipitation pattern                  three areas show the same trends for both annual
accompanied by other factors (e.g. terrain).                          and seasonal scales, implying that urbanization may
                                                                      have a limited effect on the long-term precipitation
3.2. Impact of urbanization on temporal changes                       trends. However, our results also show that urbaniz-
of regional mean precipitation                                        ation may have contributed oppositely by mitigating
3.2.1. Changes in annual and seasonal precipitation                   the reduction or enhancing the ascension in precip-
This section introduces the temporal changes in                       itation with a steeper slope, especially for the urban-
annual and seasonal precipitation over the period of                  ized areas. Similar results can be concluded from the
1958–2017. Figure 4 shows the temporal trends of                      annual and seasonal precipitation changes per decade
annual/seasonal precipitation anomalies from 1958                     for each station, as shown in figures 5 and S5.

                                                       6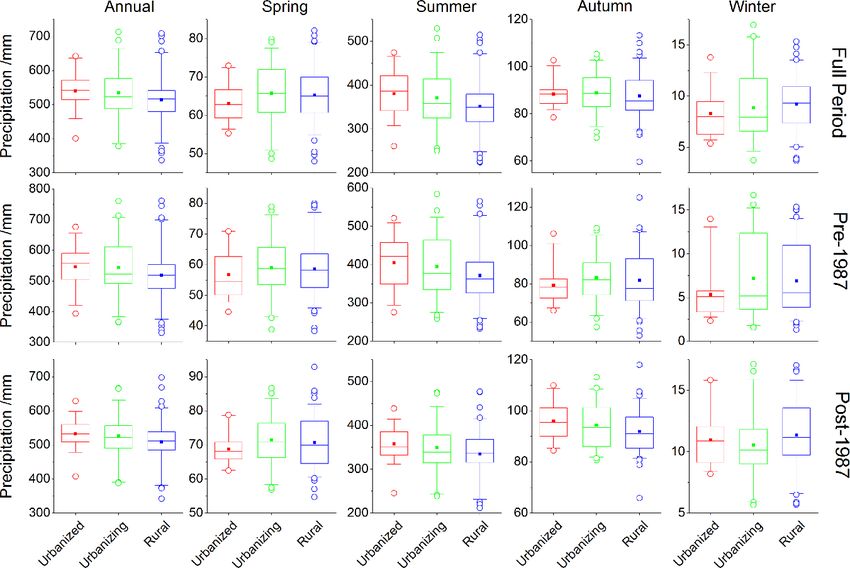
Environ. Res. Lett. 16 (2021) 014042                                                                                             X Song et al

   Figure 4. Trends of spatially averaged annual and seasonal precipitation anomalies for urbanized (left column), urbanizing
   (middle column), and rural (right column) areas during the periods of 1958–2017 (red dashed lines), pre-1987 (green solid lines)
   and post-1987 (blue solid lines). The red, green and blue values are the slopes ± standard errors of linear trends for the three
   periods, respectively. The sign ‘∗ ’ means the statistically significant trend at a level of α = 0.05. The precipitation anomaly series
   are estimated from the precipitation series subtracting the mean value of precipitation series from 1958 to 2017.

   Figure 5. Statistical results of changes in annual/seasonal precipitation per decade (%) for urbanized, urbanizing and rural
   stations over BTH during the study period. In each boxplot, top whisker and box, median line, bottom box and whisker are for
   95th, 75th, 50th, 25th, and 5th percentiles. The solid squares are the mean values for each group, and the open circles are the
   outliers for each group.

                                                         7
Environ. Res. Lett. 16 (2021) 014042 X Song et al
Figure 6. Trends of annual and seasonal PD series among urbanized, urbanizing and rural areas during the periods of 1958–2017
(red dashed lines), pre-1987 (green solid lines) and post-1987 (blue solid lines). The red, green and blue numbers mean the
slopes ± standard errors of trends for PD series in the three periods, respectively. The sign ‘∗ ’ means the statistically significant
trend at a level of α = 0.05.
3.2.2. Changes of PD between urban and rural areas demonstrate that the magnitude of urbanization’s
Here, the urban-rural PD time series are used to positive effects on precipitation weakens. In contrast,
investigate the possible impacts of urbanization on the increasing trends of PD series for other seasons
precipitation changes. Figure 6 shows the trends of indicate that the adverse effects are weakened and
the annual/seasonal PD series from the three types even reversed to a positive effect (e.g. the PD series
of areas. Overall, most of the cases show an increas- between urbanized and rural in autumn, see figures 6
ing trend during the study period. As expected, the and 7). In conclusion, the urbanization effects
rising trends of PD indicate that urbanization may are indeed non-uniform for different seasons and
bring in more precipitation and enhance the urban- periods.
rural differences in precipitation. Certainly, the dis-
tinct trends also suggest that the response of precipita- 3.2.3. Contribution of urbanization to precipitation
tion changes to urbanization is complex; thus, it is still changes
hard to conclude whether the enhanced effect is evid- Table 1 summarizes the urbanization’s contribution
ent as only a few cases are of statistical significance in to precipitation changes in BTH as measured by the
trends. CRmean and CRslope . Overall, both indices show that
To eliminate the influences of the absolute mag- urbanization at a higher level has a positive contri-
nitude of precipitation variations, the standardized bution to precipitation for about 80% of the cases
PD series is introduced here to represent the ratio of (Scenario I and Scenario III), while lower-level urb-
the PD series against the precipitation series in the anization has a negative contribution for about 60%
paired ‘rural’ areas. Figure 7 shows the standardized of the cases (Scenario II). Similar results are found
PD series for each type of stations during the study regarding the index CRslope from further analyses
period. The mean and median values of standardized concerning the two periods, on the basic hypothesis
PD series for annual and summer are higher than that rapid urbanization happens in post-1987 and
zero, but they are usually lower than zero for other low-level urbanization in pre-1987. In comparison
seasons, which implies that urbanization may have to the CRslope value in pre-1987, we find significant
diverse effects on precipitation changes, with posit- increases in CRslope in the second period for Scen-
ive effects on annual and summer precipitation, and ario I and Scenario III. These results imply that the
negative ones in other seasons. Besides, the decreas- contribution of urbanization may be related to the
ing trends of the PD series in summer (figure 6) urbanization levels. Indeed, the tremendous values
8Environ. Res. Lett. 16 (2021) 014042 X Song et al
Figure 7. Boxplot of the standardized PD series among the urbanized, urbanizing and rural areas during the study period. In each
boxplot, top whisker and box, median line, bottom box and whisker are for 95th, 75th, 50th, 25th, and 5th percentiles. The solid
square is the mean value, while the open circle represents the outlier.
(e.g. 513% and 588%) of CRslope indicate that the shows the stupendous discrepancies for the urbaniz-
precipitation changes are also affected by other local ation contribution when choosing different criteria.
factors (e.g. terrain) that are not yet identified in this For example, the contribution in autumn ranges from
work. Besides, we find that there are distinct results −71.81% (using nighttime light) to 70.36% (using
from the seasons and different periods. These results land use) for Scenario II (figure 8(g)). These results
also suggest that the urbanization effects on precipit- confirm that the way of classifying urban and rural
ation may be related to many factors, such as climate stations may directly influence the process of assess-
conditions, urbanization levels. However, their phys- ing the urbanization effects on precipitation changes.
ical relationship is not clear due to the lack of enough Thus, a reliable approach to identify urban and rural
evidence, which should be paid more attention to in areas is of crucial importance to determine the con-
the future. tribution of urbanization to precipitation changes.
3.3. Uncertainty in assessing impact of 3.4. Discussion
urbanization on precipitation changes Despite the growing knowledge about the effects of
As mentioned above, the classification of urban/rural urbanization on precipitation, there has been a lack
stations can be made using various criteria, which of quantitative assessment and analysis because the
may bring uncertainties in the process of assessing same urban area can yield different outcomes (Liu
the contribution of urbanization. Thus, we analyze and Niyogi 2019). The present study indicates that
the possible differences in urbanization contribu- the precipitation can be either enhanced or reduced
tions to precipitation changes using different classi- by urbanization over the BTH region. However, urb-
fications (figure 1). Following the different criteria anization has limited effects on precipitation changes,
used, figure 8 shows contradicting results, account- with most of the contribution rates being less than
ing for about 63.33% of all the cases. It is worth not- 50% (table 1), consistent with other previous stud-
ing that the results inferred from using CRmean are not ies in different regions (Fu et al 2019, Gu et al 2019b).
entirely consistent with that from CRslope based on The possible mechanisms and underlying reasons are
a single factor (e.g. land use, population, nighttime discussed below.
light). However, similar results can be obtained from As previous mentioned, the effects of urban-
CRmean and CRslope when using combined classifica- ization on precipitation is complex, and they can
tion factors in this study, suggesting that the results be associated with many factors, such as the geo-
obtained in this way are more reliable for identifying graphical and climatic contexts, spatial and temporal
the contribution of urbanization. Our analysis also scales, precipitation types. In this work, we solely
9Environ. Res. Lett. 16 (2021) 014042 X Song et al
Table 1. Contribution of urbanization to changes in annual and seasonal precipitation over BTH.
CRslope (%)
Contribution rate CRmean (%) Full period Pre-1987 Post-1987
Scenario I Annual 1.23 26.47 40.54 513
Spring 11.76 16.67 58.44∗ −31.91
Summer −10.89 −6.98 14.98 71.60
Autumn 48.99 45.83∗ −7.81 24.29∗
Winter 28.50 15.00∗ 7.14 80.00∗
Scenario II Annual −22.24 −9.57 — −15.38
Spring 14.60 26.83∗ — −5.88
Summer −12.08 −13.11 — −4.14
Autumn 20.42 15.63 — −6.06
Winter −21.61 −6.25 — 50.00
Scenario III Annual 30.18 39.71 3.78 588
Spring −3.32 −13.89 −12.99 −27.66
Summer 1.35 6.40 14.54 79.01
Autumn 35.90 33.33 −17.19 29.29
Winter 41.21 20.00 −14.29 60.00
Note: The contribution of urbanization is not estimated for Scenario II in pre-1987 because the urbanizing stations are also identified as
rural stations in this period. The asterisk symbol means that the slope of the PD series is significant at a level of 0.05.
Figure 8. Uncertainty of urbanization contribution to precipitation changes for different selection criteria of urbanized,
urbanizing and rural stations.
investigated the possible linkage of annual and sea- resolution, which may influence the contribution of
sonal precipitation to the urbanization over the BTH urbanization to precipitation changes. Although this
region. The weighted-average process may weaken quantitative assessment helps us to understand the
the contributions from different urbanization levels urbanization signature to precipitation changes, it
over the BTH region, as compared with a single should be noted that the statistical analyses are unable
city (e.g. greater Beijing metropolitan area). Fur- to clarify the physical processes of urban-induced pre-
thermore, the precipitation types (e.g. convective or cipitation changes. Meanwhile, we assume that the
frontal precipitation) and different areas of cover- urban-rural contrasts in precipitation are caused by
age (e.g. upwind or downwind areas), were not dis- urbanization only, which may exaggerate or underes-
tinguished in this work due to the coarse temporal timate the contribution of urbanization.
10Environ. Res. Lett. 16 (2021) 014042 X Song et al
Terrain effects are also crucial to the local circu- 4. Conclusions
lations (Li et al 2017) and play an important role in
spatial distribution of precipitation (Fu et al 2019). Investigating the urbanization effects on regional
Our results indicate that the spatial pattern of annu- climate change is vital for acquiring a better under-
al/seasonal precipitation is mainly influenced by the standing of the impact of landscape changes on local
terrain features. Although urbanization has no signi- and regional climate. In this study, we investigate
ficant influence on the spatial patterns of precipita- the influence of urbanization on precipitation pat-
tion, it may reinforce the terrain effects, for example, terns using the daily precipitation observation records
as demonstrated by the secondary centers of precipit- across the BTH region in northern China from 1958
ation appearing in or near the urban areas (figure 2). to 2017. Firstly, we integrate the classification of
Meanwhile, it should be noted that some more com- urban and rural stations based on the various criteria
plex spatial patterns of precipitation are found when and data (e.g. land use, population and nighttime
comparing the results in post-1987 versus that in pre- light). Then, we derive two indices to assess the con-
1987, especially for seasonal precipitation, suggesting tribution of urbanization via quantifying the urban-
that urbanization may principally influence the local rural differences in precipitation changes for differ-
pattern of precipitation. ent types of stations and periods. Results show that
Besides, we find notable differences in the contri- urbanization can alter the local variations in precipit-
bution estimated based on the different classification ation but have a limited effect on the spatial patterns
of urban and rural areas (figures 8 and S6), indicat- of annual/seasonal precipitation. The urbanized, urb-
ing the classification has a significant influence on the anizing and rural areas experience similar trends of
overall analytical results when assessing the urbaniza- precipitation during 1958–2017, with an increase in
tion contribution to precipitation changes. Although spring, autumn and winter, and a decrease in sum-
prior work has highlighted that the impacts of urb- mer, which leads to the reduction of annual precipit-
anization on temperature significantly differ depend- ation in the same period. The distinct trends in annual
ing on the classification of urban and rural areas and seasonal precipitation in both pre- and post-1987
(Hansen et al 2001), very few studies have paid atten- periods indicate that the urban signature in precipita-
tion to this matter regarding precipitation changes tion may not alter the trends that are mainly induced
(Jiang and Li 2014). These studies found that the dif- by climate change or variability. Both negative and
ference in precipitation between urban and rural sta- positive contributions of urbanization to precipita-
tions is sensitive to the urban-rural classification in tion changes are found to exist, suggesting that the
the early urbanization (1960–1979), but is not liable contribution may be related to seasons. The contri-
in the rapid urbanization (1980–2009). For the first bution of urbanization to annual and seasonal pre-
time, we provide evidence-based information regard- cipitation is not consistent with the level of urbaniz-
ing the uncertainty in the contribution of urbaniza- ation. Yet, most cases show positive contributions or
tion to precipitation changes associated with various higher impacts for high-level urbanization compared
criteria used for urban-rural classification. Indeed, with low-level urbanization, indicating that the res-
the difficulty in determining the justifiable threshold ults may also be correlated with the levels of urban-
for identifying urban areas from the different data ization. Certainly, the effect of urbanization feedback
(Zhao et al 2019), such as nighttime light, population, on precipitation is evolving because the precipitation
may cause even larger uncertainty, which needs fur- changes are dynamic and complex, associated with
ther study in this direction. several other factors. Therefore, our results should be
Indeed, the statistical analyses may be affected by interpreted as illustrative rather than definitive. This
sampling, and as such a bootstrapping approach is article is a first step in the development of quantitat-
applied to estimate the differences (figure S7). The ive analysis for assessing the contribution of urbaniz-
results of CRmean do not significantly change after ation to precipitation changes, which draws attention
applying the bootstrapping samples, but those of to an important issue that requires further investig-
CRslope do. That is, the CRmean is more sensitive to ation in the future with the help of high-resolution
the selected samples than CRslope . Nevertheless, sim- observations and physical-based dynamic modeling.
ilar results of CRmean and CRslope (table 1) also indic-
ate the conclusions from the two indices are still cred- Data availability statement
ible. As previous studies have revealed, it is still a
huge challenge to estimate the effects of urbanization The data that support the findings of this study are
on precipitation because of the dynamic and com- available upon reasonable request from the authors.
plex processes influenced by various factors and their
interactions (Freitag et al 2018, Liu and Niyogi 2019, Acknowledgments
Gu et al 2019b). The proposed method needs to be
elaborated in future work with the help of physical- This work was supported by the National Key
based numerical experiments and/or high-resolution Research & Development Program of China
observation records. (2017YFC1502701), the National Natural Science
11Environ. Res. Lett. 16 (2021) 014042 X Song et al
Foundation of China (51979271, 51609242), the Hansen J, Ruedy R, Sato M, Imhoff M, Lawrence W, Easterling D,
Fundamental Research Funds for the Central Uni- Peterson T and Karl T 2001 A closer look at United States
and global surface temperature change J. Geophys. Res.
versities (2015XKMS034), the China Postdoctoral
Atmos. 106 23947–63
Science Foundation (2018M632333). This project Huff F A and Changnon S A 1973 Precipitation modification by
was also funded by the Priority Academic Program major urban areas Bull. Am. Meteorol. Soc. 54 1220–33
Development (PAPD) of Jiangsu Higher Education Jiang Z and Li Y 2014 Impact of urbanization in different regions
of eastern China on precipitation and its uncertainty
Institutions. The first author is also grateful for sup-
J. Tropical Meteorol. 30 601–11
port from China Scholarship Council. YX’s contri- Jin M L, Shepherd J M and King M D 2005 Urban aerosols and
bution is supported by the Royal Academy of Engin- their variations with clouds and rainfall: a case study for
eering Newton Fund (Grant Ref: UUFIP\10021). New York and Houston J. Geophys. Res. Atmos. 110 1–12
Kalnay E and Cai M 2003 Impact of urbanization and land-use
We are grateful to Dr. Feng Kong (School of Public
change on climate Nature 423 528–31
Policy and Management, Tsinghua University) for his Kaufmann R K, Seto K C, Schneider A, Liu Z T, Zhou L M and
support for the rainfall data collection. Wang W L 2007 Climate response to rapid urban growth:
evidence of a human-induced precipitation deficit J. Clim.
20 2299–306
Conflict of interest Li D, Liao W L, Rigden A J, Liu X P, Wang D G, Malyshev S and
Shevliakova E 2019 Urban heat island: aerodynamics or
The authors declare that they have no conflict of imperviousness? Sci. Adv. 5 1–4
interest. Li M M, Wang T J, Xie M, Zhuang B L, Li S, Han Y and Cheng N L
2017 Modeling of urban heat island and its impacts on
thermal circulations in the Beijing-Tianjin-Hebei region,
ORCID iDs China Theor. Appl. Climatol. 128 999–1013
Li W, Du Y, Wang G, Wu M and Xu Y 2009 Urbanization effects
Xiaomeng Song https://orcid.org/0000-0003- on precipitation over the Pearl River Delta based on satellite
0504-5972 data Chin. J. Atmos. Sci. 33 1259–66
Liao W L et al 2018 Stronger contributions of urbanization to heat
Yunqing Xuan https://orcid.org/0000-0003-2736- wave trends in wet climates Geophys. Res. Lett.
8625 45 11310–7
Wenyan Wu https://orcid.org/0000-0003-3907- Lin L J, Ge E J, Liu X P, Liao W L and Luo M 2018 Urbanization
1570 effects on heat waves in Fujian Province, Southeast China
Atmos. Res. 210 123–32
Liu J and Niyogi D 2019 Meta-analysis of urbanization impact on
References rainfall modification Sci. Rep. 9 1–14
Lowry W P 1998 Urban effects on precipitation amount Prog.
Cao L J, Zhu Y N, Tang G L, Yuan F and Yan Z W 2016 Climatic Phys. Geogr. 22 477–520
warming in China according to a homogenized dataset from Lu M, Xu Y P, Shan N, Wang Q, Yuan J and Wang J 2019 Effect of
2419 stations Int. J. Climatol. 36 4384–92 urbanisation on extreme precipitation based on
Changnon S A, Huff F A and Semonin R G 1971 METROMEX: an nonstationary models in the Yangtze River Delta
investigation of inadvertent weather modification Bull. Am. metropolitan region Sci. Total Environ. 673 64–73
Meteorol. Soc. 52 958–68 Manola I, Steeneveld G J, Uijlenhoet R and Holtslag A A M 2020
Chen S, Li W, Du Y D, Mao C Y and Zhang L 2015 Urbanization Analysis of urban rainfall from hourly to seasonal scales
effect on precipitation over the Pearl River Delta based on using high-resolution radar observations in the Netherlands
CMORPH data Adv. Clim. Change Res. 6 16–22 Int. J. Climatol. 40 822–40
Ding Y H and Chan J C L 2005 The east Asian summer monsoon: Mishra V, Dominguez F and Lettenmaier D P 2012 Urban
an overview Meteorol. Atmos. Phys. 89 117–42 precipitation extremes: how reliable are regional climate
Fang C L and Yu D L 2017 Urban agglomeration: an evolving models? Geophys. Res. Lett. 39 1–8
concept of an emerging phenomenon Landsc. Urban Plan. National Centers for Environmental Information (NCEI) 2019
162 126–36 Version 4 DMSP-OLS Nighttime Lights Time Series (available
Freitag B M, Nair U S and Niyogi D 2018 Urban modification of at: https://ngdc.noaa.gov/eog/dmsp/downloadV4
convection and rainfall in complex terrain Geophys. Res. composites.html) (Accessed 20 January 2020)
Lett. 45 2507–15 Pathirana A, Denekew H B, Veerbeek W, Zevenbergen C and
Fu X S, Yang X Q and Sun X G 2019 Spatial and diurnal variations Banda A T 2014 Impact of urban growth-driven landuse
of summer hourly rainfall over three super city clusters in change on microclimate and extreme precipitation—a
eastern China and their possible link to the urbanization sensitivity study Atmos. Res. 138 59–72
J. Geophys. Res. Atmos. 124 5445–62 Ren Z H, Yu Y, Zou F L and Xu Y 2012 Quality detection of
Gao Z, Hou Y and Chen W P 2019 Enhanced sensitivity of the surface historical basic meteorological data J. Appl. Meteorol.
urban heat island effect to summer temperatures induced by Sci. 23 739–47
urban expansion Environ. Res. Lett. 14 094005 Sang Y F, Wang Z G, Li Z L, Liu C M and Liu X J 2013
Gu X H, Zhang Q, Li J F, Singh V P and Sun P 2019a Impact of Investigation into the daily precipitation variability in the
urbanization on nonstationarity of annual and seasonal Yangtze River Delta, China Hydrol. Process. 27 175–85
precipitation extremes in China J. Hydrol. 575 638–55 Shem W and Shepherd M 2009 On the impact of urbanization on
Gu X H, Zhang Q, Singh V P, Song C Q, Sun P and Li J F 2019b summertime thunderstorms in Atlanta: two numerical
Potential contributions of climate change and urbanization model case studies Atmos. Res. 92 172–89
to precipitation trends across China at national, regional Shepherd J M 2005 A review of current investigations of
and local scales Int. J. Climatol. 39 2998–3012 urban-induced rainfall and recommendations for the future
Han J Y and Baik J J 2008 A theoretical and numerical study of Earth Interact. 9 1–27
urban heat island-induced circulation and convection Shepherd J M, Pierce H and Negri A J 2002 Rainfall modification
J. Atmos. Sci. 65 1859–77 by major urban areas: observations from spaceborne rain
Han J Y, Baik J J and Lee H 2014 Urban impacts on precipitation radar on the TRMM satellite J. Appl. Meteorol.
Asia-Pacific J. Atmos. Sci. 50 17–30 41 689–701
12Environ. Res. Lett. 16 (2021) 014042 X Song et al
Song X M, Zhang J Y, Aghakouchak A, Sen Roy S, Xuan Y Q, coastal South China J. Appl. Meteorol. Climatol.
Wang G Q, He R M, Wang X J and Liu C S 2014 Rapid 58 1799–819
urbanization and changes in spatiotemporal characteristics Yang X, Li Z, Liu L, Zhou L, Cribb M and Zhang F 2016 Distinct
of precipitation in Beijing metropolitan area J. Geophys. Res. weekly cycles of thunderstorms and a potential connection
Atmos. 119 11250–71 with aerosol type in China Geophys. Res. Lett. 43 8760–8
Song X M, Zhang J Y, Zhang C H and Zou X J 2019b A Zhang S, Huang G, Wang J, Liu Y, Jia G S and Ren G S 2015 Impact
comprehensive analysis of the changes in precipitation of urban surface characteristics on summer rainfall in the
patterns over Beijing during 1960–2012 Adv. Meteorol. Beijing-Tianjin-Hebei area Chin. J. Atmos. Sci. 39 911–25
2019 1–22 Zhang W, Villarini G, Vecchi G A and Smith J A 2018
Song X, Zou X, Zhang C, Zhang J and Kong F 2019a Multiscale Urbanization exacerbated the rainfall and flooding caused
spatiotemporal changes of precipitation extremes in by hurricane Harvey in Houston Nature 563 384–8
Beijing-Tianjin-Hebei region, China during 1958–2017 Zhao N, Jiao Y M, Ma T, Zhao M M, Fan Z M, Yin X Z, Liu Y and
Atmosphere 10 1–29 Yue T X 2019 Estimating the effect of urbanization on
Wang J, Feng J M and Yan Z W 2015 Potential sensitivity of warm extreme climate events in the Beijing-Tianjin-Hebei region,
season precipitation to urbanization extents: modeling study China Sci. Total Environ. 688 1005–15
in Beijing-Tianjin-Hebei urban agglomeration in China J. Zhao N, Yue T X, Li H, Zhang L L, Yin X Z and Liu Y 2018
Geophys. Res. Atmos. 120 9408–25 Spatio-temporal changes in precipitation over
Wang J, Feng J M, Yan Z W, Hu Y H and Jia G S 2012 Nested Beijing-Tianjin-Hebei region, China Atmos. Res. 202 156–68
high-resolution modeling of the impact of urbanization on Zhao S Q, Da L J, Tang Z Y, Fang H J, Song K and Fang J Y 2006
regional climate in three vast urban agglomerations in Ecological consequences of rapid urban expansion:
China J. Geophys. Res. Atmos. 117 1–18 Shanghai, China Front Ecol. Environ. 4 341–6
Wang W and Shu J 2019 Urban renewal can mitigate urban heat Zhou L M, Dickinson R E, Tian Y H, Fang J Y, Li Q X,
islands Geophys. Res. Lett. 47 1–10 Kaufmann R K, Tucker C J and Myneni R B 2004. Evidence
Wu M W, Luo Y L, Chen F and Wong W K 2019 Observed link of for a significant urbanization effect on climate in China
extreme hourly precipitation changes to urbanization over Proc. Natl Acad. Sci. USA 101 9540–4
13You can also read