18F-XTRA PET for Enhanced Imaging of the Extrathalamic a4b2 Nicotinic Acetylcholine Receptor - SNMMI
←
→
Page content transcription
If your browser does not render page correctly, please read the page content below

Downloaded from jnm.snmjournals.org by SNMMI headquarters on October 4, 2018. For personal use only.

                                                                  FEATURED ARTICLE OF THE MONTH

18F-XTRA  PET for Enhanced Imaging of the Extrathalamic
a4b2 Nicotinic Acetylcholine Receptor
Jennifer M. Coughlin1,2*, Stephanie Slania3*, Yong Du2*, Hailey B. Rosenthal2, Wojciech G. Lesniak2, Il Minn2,
Gwenn S. Smith1,2, Robert F. Dannals2, Hiroto Kuwabara2, Dean F. Wong1,2,4,5, Yuchuan Wang2, Andrew G. Horti2,
and Martin G. Pomper1–3
1Department  of Psychiatry and Behavioral Sciences, Johns Hopkins Medical Institutions, Baltimore, Maryland; 2Russell H. Morgan
Department of Radiology and Radiological Science, Johns Hopkins Medical Institutions, Baltimore, Maryland; 3Department of
Biomedical Engineering, Johns Hopkins Medical Institutions, Baltimore, Maryland; 4Department of Neuroscience, Johns Hopkins
Medical Institutions, Baltimore, Maryland; and 5Department of Neurology, Johns Hopkins Medical Institutions, Baltimore, Maryland

Reduced density of the α4β2 nicotinic acetylcholine receptor (α4β2-
nAChR) in the cortex and hippocampus of the human brain has
been reported in aging and patients with neurodegenerative dis-
                                                                               N      icotinic acetylcholine receptors (nAChRs) are pentameric ligand–
                                                                               gated ion channels, of which the a4b2 and a7 are the most abundant
ease. This study assessed the pharmacokinetic behavior of 18F-                 subtypes in the human brain. The loss of activity of even a small quan-
(−)-JHU86428 (18F-XTRA), a new radiotracer for in vivo PET imaging             tity of neuronal nAChRs can have wide-ranging effects on neu-
of the α4β2-nAChR, particularly in extrathalamic regions of interest           rotransmission across neural circuits (1). Altered density of the
in which the α4β2-nAChR is less densely expressed than in thala-               a4b2-nAChR is linked to several neurodegenerative disorders (2–5).
mus. 18F-XTRA was also used to evaluate the α4β2-nAChR in the                  Additionally, postmortem work using 3H-epibatidine (6) and some
hippocampus in human aging. Methods: Seventeen healthy non-                    in vivo human imaging, including that using 2-18F-fluoro-A-85380
smoker adults (11 men, 6 women; age, 30–82 y) underwent PET
                                                                               (2-18F-FA) with PET (5,7), suggest diminished availability of the
neuroimaging over 90 or 180 min in a high-resolution research
tomograph after bolus injection of 18F-XTRA. Methods to quantify
                                                                               a4b2-nAChR in human aging. The binding of 2-18F-FA in the
binding of 18F-XTRA to the α4β2-nAChR in the human brain were                  hippocampus and thalamus inversely correlated with performance
compared, and the relationship between age and binding in the                  on a cognitive task of processing speed in a cohort of elderly healthy
hippocampus was tested. Results: 18F-XTRA rapidly entered the                  participants (8).
brain, and time–activity curves peaked within 10 min after injection              There is need for a4b2-nAChR–targeting radiotracers with
for extrathalamic regions and at approximately 70 min in the thala-            faster pharmacokinetics and high specific uptake in brain tissue
mus. The 2-tissue-compartment model (2TCM) predicted the regional              outside the thalamus (extrathalamic regions such as the cortex and
time–activity curves better than the 1-tissue-compartment model,               striatum) (9,10), in which the a4b2-nAChR is less densely expressed
and total distribution volume (VT) was well identified by the 2TCM in          (11). 18F-(2)-JHU86428 (18F-XTRA) (12,13) is among such recently
all ROIs. VT values estimated using Logan analysis with metabolite-
                                                                               developed radioligands (13–15) and has promising in vitro binding
corrected arterial input were highly correlated with those from the
2TCM in all regions, and values from 90-min scan duration were on
                                                                               characteristics, including subnanomolar binding affinity (Ki 5 0.06 nM)
average within 5% of those values from 180 min of data. Parametric             and improved lipophilicity (LogD7.4 5 0.67) over that of 2-18F-FA (13).
                                                                               18F-XTRA also showed stable, high binding estimates in extrathalamic
images of VT were consistent with the known distribution of the α4β2-
nAChR across the brain. Finally, an inverse correlation between VT in          regions of the baboon brain in vivo (12).
the hippocampus and age was observed. Conclusion: Our results                     This study assessed use of 18F-XTRA with PET imaging in the
extend support for use of 18F-XTRA with 90 min of emission scanning            human brain, particularly in extrathalamic regions of interest (ROIs).
in quantitative human neuroimaging of the extrathalamic α4β2-                  Estimates of total distribution volume (VT) generated using kinetic
nAChR, including in studies of aging.                                          modeling methods with arterial input function and using alternative
Key Words: 18F-XTRA; PET imaging; nicotinic acetylcholine receptor;            scan durations were compared. Finally, we investigated the correlation
healthy aging                                                                  between age and VT in the hippocampus, a region in which low
J Nucl Med 2018; 59:1603–1608                                                  availability of the a4b2-nAChR may be linked to subtle deficits in
DOI: 10.2967/jnumed.117.205492                                                 cognition even in otherwise healthy older individuals (8).

                                                                               MATERIALS AND METHODS
                                                                               Human Subjects
                                                                                  This prospective study was approved by a Johns Hopkins Institu-
                                                                               tional Review Board, and all subjects provided written informed consent.
                                                                               Seventeen healthy adult ($18 y) participants were recruited through
  Received Nov. 19, 2017; revision accepted Feb. 3, 2018.
  For correspondence or reprints contact: Martin G. Pomper, 601 N. Caroline    local advertising. Each subject completed a screening interview and
St., JHOC 3223, Baltimore, MD 21287.                                           laboratory testing (blood counts, metabolic panel, coagulation stud-
  E-mail: mpomper@jhmi.edu                                                     ies), electrocardiogram, and urine toxicology. Eligible participants had
  *Contributed equally to this work.
  Published online Mar. 1, 2018.                                               stable health with no clinical abnormality on the screening assessment
  COPYRIGHT © 2018 by the Society of Nuclear Medicine and Molecular Imaging.   and structural MRI. Exclusion criteria included nicotine use in the past

                                                                       18F-XTRA      HUMAN NEUROIMAGING • Coughlin et al.                       1603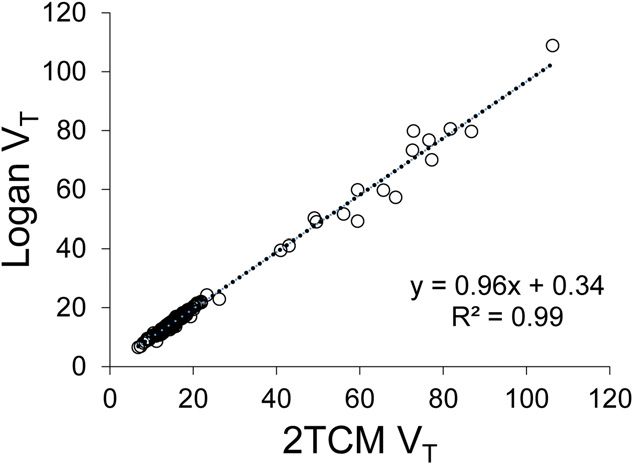
Downloaded from jnm.snmjournals.org by SNMMI headquarters on October 4, 2018. For personal use only.

year, past psychiatric or neurologic illness, history of substance abuse     FreeSurfer for generating regional volume ratio values (ROI volume
including marijuana (assessed by self-report and urine toxicology),          normalized to total intracranial volume).
medication known to affect acetylcholine signaling, current psycho-             Derivation of Rate Constants and VTs. VT (22) for each ROI was
tropic medication use, contraindication to MRI, or contraindication          derived using the metabolite-corrected arterial input function and com-
to PET imaging with arterial line.                                           partmental modeling (1-tissue-compartment model with 3 parameters
   All older ($50 y) participants were also assessed with neuropsycho-       [1TCM]; 2-tissue-compartment model with 5 parameters [2TCM]) or
logic testing that included the Clinical Dementia Rating scale (16) to       Logan graphical analysis (23). In compartmental modeling, nonlinear
ensure a global Clinical Dementia Rating of 0, consistent with normal        least-squares analysis was performed, with the Marquardt algorithm for
cognition. Since the apolipoprotein e4 (APOE e4) allele may play a role      parameter estimation (24). Logan-derived VT values were determined
in aberrant cholinergic signaling (17) that may be linked to altered         using ordinary least squares after transformation of the PET data with
a4b2-nAChR availability (18), older participants were assessed for           t* 5 45 min. The contribution of cerebral blood volume was set at 5%
APOE e4 carrier status using methods described previously (19).              of brain volume. As in other recent PET imaging of this target (12,25),
                                                                             reference-tissue models were not applied because there is no clearly
Human Brain Imaging                                                          identified human brain region devoid of the a4b2-nAChR.
   Synthesis of 18F-XTRA. 18F-XTRA was synthesized as previously
described (12). Radiochemical purity was greater than 99%, with high         Statistics
specific radioactivity (1,586 6 937 GBq/mmol) at the time of injec-              Compartmental model fitting was assessed by visual inspection
tion. The mean administered mass and radioactivity of 18F-XTRA               of the model fit to the time–activity curves and by relative goodness of
were 0.08 6 0.04 mg (range, 0.03–0.17 mg) and 335 6 38.3 MBq                 fit using the Akaike information criterion (26). The standard errors of
(range, 235–387 MBq), respectively. There were no adverse or clini-          nonlinear least-square estimates of rate constants and VT from mod-
cally detectable pharmacologic effects, and no significant changes in        eling were computed from the covariance matrix in PMOD and
vital signs, laboratory results, or electrocardiograms were observed.        expressed as the coefficient of variation (% COV) (27). Regional VT
   Brain PET Image Acquisition. All participants wore a thermoplastic        estimates from variable scan durations were evaluated using the 180-
facemask to minimize head movement and underwent both radial arterial        min acquisition as the reference for comparison of VT values from
line and antecubital venous catheter insertion. PET scans were acquired      data shortening (shortened to 90 min). For each duration, denoted X,
using a High-Resolution Research Tomograph (Siemens Healthcare) with         relative bias values were expressed as jVTX – VT 180 minj/VT 180 min.
2.5-mm reconstructed image resolution (20). Each emission scan started at        The relationship between VT in the hippocampus and age was tested
the time of bolus intravenous injection of 18F-XTRA, with continuous list-   using Spearman rank-order correlation analysis because age was not
mode data collection for 90 (n 5 10) or 180 (n 5 7) min. Imaging data        normally distributed across the study population. Secondary analyses
were reconstructed using methods described in the supplemental materials     testing the relationship between age and VT in the other 9 ROIs were
(available at http://jnm.snmjournals.org).                                   also explored.
   Plasma Sampling. Measurement of the arterial plasma input function            Statistical analyses were performed using SPSS Statistics (version
was conducted through collection of 35–50 blood samples (1 mL),              23.0; IBM Corp.). Data were checked for outliers (28), and descriptive
obtained after injection using the previously published protocol (19).       statistics were obtained. Normality of the data was assessed using the
Samples from 120 to 180 min after injection were collected every             Shapiro–Wilk test. Data are presented as mean 6 SD, and significance
10 min. Plasma was immediately isolated from whole blood using               was set to a P value less than 0.05 unless otherwise noted.
centrifugation. Radioactivity was counted in a cross-calibrated g-well-
counter. The fraction of parent radioligand in plasma was determined by      RESULTS
high-performance liquid chromatography (HPLC) with blood sampling
                                                                             Human Subjects
as previously described (19), with additional blood sampling at 105,
                                                                             Seventeen healthy nonsmokers (11 men, 6 women; age, 30–82 y;
120, 150, and 180 min after injection for 180-min scans.
   The modified column-switching HPLC method (21) used a Waters
                                                                             median age, 60 y; interquartile range, 37 y) underwent PET neuro-
reverse phase XBridge BEH C18 5 mM 4.6 · 150 mm analytic col-                imaging with 18F-XTRA (Table 1). All older participants (n 5 10)
umn, with an analytic mobile phase (45% acetonitrile and 55% aque-           had a global Clinical Dementia Rating of 0, and none of the par-
ous solution of 0.1% ammonium hydroxide) at 2 mL/min. The HPLC               ticipants was an APOE e4 carrier. ROI volumes and volume ratios
system was standardized using nonradioactive XTRA and 18F-XTRA               from the study population are presented in Supplemental Table 1.
before analysis of plasma samples, which were spiked with 10 mL of
                                                                             Plasma Analysis
XTRA (1 mg/mL) for each run. Metabolite-corrected plasma time–
                                                                                Plasma activity peaked within 90 s after injection and decreased to
activity curves were obtained by applying percentage parent ligand
time profiles, generated by HPLC analysis, to the total plasma time–
                                                                             less than 5% of the peak by 20 min (Fig. 1A). HPLC easily isolated
                                                                             18F-XTRA (retention time, 7.5 min) from its radiolabeled metabolites,
activity curves after linear interpolation in PMOD (version 3.7;
PMOD Technologies Ltd.).
   MRI Acquisition. T1-weighted brain MRI at 3 T was acquired for each
participant using methods identical to those as previously described (19),                          TABLE 1
to obtain a 0.8 · 0.8 · 0.8 mm 3-dimensional image with a magnetization-       Clinical and Demographic Characteristics of 17 Healthy
prepared rapid gradient-echo sequence.                                                          Human Participants
   PET Image Analysis and Volumes of Interest. PET image process-
ing, including motion correction and kinetic analysis, was conducted                           Characteristic                  Mean or number
using PMOD as previously described (19). PET time–activity curves
were generated for 10 ROIs that were segmented from each MR image               Mean age ± SD (y)                                 56.7 ± 19.6
using the FreeSurfer image analysis suite (http://surfer.nmr.mgh.har-           Sex (male/female)                                     11/6
vard.edu/). ROIs included the thalamus, striatum, hippocampus, corpus           Race (Caucasian/African American/Asian)              9/7/1
callosum, as well as cerebellar, temporal, occipital, cingulate, frontal,
                                                                                Mean body mass index ± SD                         26.3 ± 3.2
and parietal cortices. Total intracranial volume was also defined using

1604        THE JOURNAL      OF   NUCLEAR MEDICINE • Vol. 59 • No. 10 • October 2018
Downloaded from jnm.snmjournals.org by SNMMI headquarters on October 4, 2018. For personal use only.
which were more polar and well resolved from the parent compound.
18F-XTRA represented 21.8% 6 10.7% of total plasma activity by
90 min (Supplemental Fig. 1) and 15.2% 6 10.5% by 180 min.
Determination of VT
18F-XTRA readily entered the brain and, for extrathalamic
ROIs, activity peaked within 10 min after injection and then declined
over the remaining 90- or 180-min scan duration (Fig. 1B). Highest
peak uptake occurred in the thalamus at approximately 70 min after
injection except in 1 individual (a 76-y-old Caucasian man) whose
thalamic activity peaked just before the end of the 90-min emission
scan. Activity in the thalamus washed out gradually after the peak.
The lowest uptake was observed in the corpus callosum.
Across the entire population, the kinetic behavior of 18F-XTRA
over the 90-min scan in each ROI yielded a visually better fit using
the 2TCM compared with the 1TCM (Fig. 1C for representative
data) except for within the thalamus of the aforementioned indi-
vidual who had unusually late, 90-min peak thalamic activity that
did not converge for either compartmental model. Those outlier
data were excluded from further analyses, and when all other
90 min of continuous data were used, the Akaike information
criterion favored the 2TCM in all 10 ROIs (Supplemental Table 2).
The 2TCM identified VT well (COV , 5%) for all ROIs except
for the thalamus, which had a COV of 5.4% (Table 2). K1 was also
identified well (COV , 5%) using the 2TCM. The other rate con-
stants from the 2TCM were identified with COV values of approx-
imately 8%–22% for k2 and 9%–24% for k3/k4 across all 10 ROIs.
All VT estimates (compartmental modeling, Logan) using 90-min
emission data were highest in the thalamus and were more homo-
geneous across regions of the striatum, hippocampus, and cortical
ROIs. VT was lowest in the corpus callosum.
When 90-min data were used, values of regional VT from Logan
analysis correlated well with those of the 2TCM (Fig. 2). Regional
VT values generated using Logan analysis from the 90-min con-
tinuous scans were also within 5% of the VT values obtained using
180 min of continuous data from the same 7 individuals (Fig. 3;
Supplemental Table 3). Parametric images of VT derived using
Logan analysis from 90-min emission scans demonstrated binding
of 18F-XTRA throughout the brain (Fig. 4).
Correlation Between Age and VT in Hippocampus
An inverse correlation between age and 18F-XTRA VT in hip-
pocampus (rho 5 20.589, P 5 0.014) was found (Supplemental
Fig. 2). Secondary analyses revealed no significant correlation
between age and VT in other ROIs after applying correction for
multiple comparisons (P , 0.005 after Bonferroni adjustment for
all 10 ROIs). There was also no correlation between body mass
index and VT in any of the ROIs. One-way ANOVA analysis
revealed no effect of sex or race on VT. There was no correlation
between age and volume or volume ratio for any of the 10 ROIs.
DISCUSSION
PET imaging using newly developed radiotracers that have
superior specificity for the a4b2-nAChR and faster brain kinetics
FIGURE 1. Time–activity curves from 18F-XTRA imaging in a represen- shown. Time–activity curves are shown as percentages of injected dose
tative subject who underwent 180 min of continuous emission imaging. per cm3 tissue normalized to body weight in grams (SUV%). (C) The
(A) Radioactivity curves in total plasma and in the portion of unmetab- 2TCM showed better fit to observed tissue time–activity curves than
olized 18F-XTRA parent are shown with activity shown as percentages the 1TCM in all ROIs. Observed activity (data in shapes) and model
of injected dose per mL plasma normalized to body weight in grams curves (solid curve, 2TCM; dotted curve, 1TCM) over 90 min from thal-
(SUV%). (B) Radioactivity curves spanning 180 min in 10 ROIs are amus, frontal cortex, and corpus callosum are shown. CTX 5 cortex.
18F-XTRA HUMAN NEUROIMAGING • Coughlin et al. 1605TABLE 2
Kinetic Parameters and Total Distribution Volume (VT) Values Estimated with 2TCM, Along with VT Values Estimated Using 1TCM and Logan Analysis
1606
for 18F-XTRA PET Imaging in Humans (n 5 17)
2TCM
ROI K1 (mL cm−3 min−1) k2 (min −1) k3/k4 (unitless) VT (mL cm−3) 1TCM, VT (mL cm−3) Logan, VT (mL cm−3)
Thalamus* 0.61 ± 0.10 (2.9 ± 1.6) 0.15 ± 0.11 (22.2 ± 12.0) 13.0 ± 8.1 (21.8 ± 11.2) 66.6 ± 17.4 (5.4 ± 9.7) 57.7 ± 13.4 (3.5 ± 1.1) 64.1 ± 18.4 (2.6 ± 1.0)
THE JOURNAL
Striatum 0.52 ± 0.09 (1.8 ± 1.0) 0.07 ± 0.02 (9.6 ± 5.9) 1.29 ± 0.50 (13.6 ± 7.9) 17.3 ± 3.4 (4.6 ± 4.0) 14.5 ± 1.9 (2.6 ± 0.5) 16.7 ± 2.9 (1.1 ± 0.6)
OF
Hippocampus 0.48 ± 0.07 (2.5 ± 1.3) 0.12 ± 0.05 (11.8 ± 5.9) 2.92 ± 1.22 (12.1 ± 5.9) 15.6 ± 1.9 (3.6 ± 2.6) 12.9 ± 1.5 (3.8 ± 0.6) 15.6 ± 2.0 (1.8 ± 0.5)
Cerebellar cortex 0.52 ± 0.07 (1.6 ± 0.9) 0.08 ± 0.03 (10.4 ± 5.2) 1.80 ± 0.53 (13.3 ± 6.5) 17.6 ± 3.0 (2.3 ± 2.9) 15.8 ± 2.3 (2.4 ± 0.5) 17.7 ± 3.1 (0.6 ± 0.3)
Temporal cortex 0.49 ± 0.08 (1.8 ± 1.3) 0.10 ± 0.05 (10.1 ± 7.6) 1.66 ± 1.01 (12.6 ± 8.1) 13.7 ± 2.2 (2.4 ± 2.5) 12.2 ± 1.9 (2.6 ± 0.5) 13.6 ± 2.3 (0.7 ± 0.3)
Occipital cortex 0.56 ± 0.08 (1.7 ± 1.3) 0.11 ± 0.04 (7.7 ± 6.0) 1.60 ± 0.80 (9.4 ± 6.4) 13.4 ± 2.1 (2.5 ± 2.3) 11.5 ± 1.9 3.2 ± 0.6) 13.2 ± 2.3 (0.7 ± 0.3)
Cingulate cortex 0.59 ± 0.09 (2.5 ± 1.6) 0.13 ± 0.08 (12.5 ± 7.8) 2.35 ± 1.56 (13.9 ± 7.1) 15.7 ± 2.9 (2.4 ± 2.3) 14.0 ± 2.4 (3.0 ± 0.5) 15.8 ± 3.1 (0.7 ± 0.3)
Frontal cortex 0.56 ± 0.08 (2.1 ± 1.5) 0.12 ± 0.07 (10.5 ± 7.9) 2.30 ± 1.65 (12.0 ± 7.2) 15.8 ± 3.1 (2.5 ± 2.4) 13.8 ± 2.5 (2.9 ± 0.5) 15.6 ± 3.3 (0.8 ± 0.5)
Parietal cortex 0.57 ± 0.09 (1.8 ± 1.2) 0.11 ± 0.05 (9.1 ± 6.2) 1.94 ± 1.07 (10.9 ± 6.1) 15.1 ± 2.7 (2.5 ± 2.4) 13.1 ± 2.3 (3.1 ± 0.6) 15.0 ± 3.0 (0.7 ± 0.3)
Corpus callosum 0.30 ± 0.06 (4.1 ± 1.8) 0.12 ± 0.06 (21.0 ± 8.5) 3.15 ± 2.12 (23.5 ± 9.9) 10.1 ± 1.7 (4.7 ± 4.5) 8.8 ± 1.5 (3.4 ± 0.7) 9.8 ± 1.6 (3.5 ± 2.0)
*One individual had poor fit for data from thalamus using all models tested, and these outlier data from thalamus of this individual were excluded. Regional VT values were generated using metabolite-
corrected arterial input function and 90-min dynamic data.
Data are mean ± SD, with %COV for each estimated parameter in parentheses.
in vivo (12) characteristics.
NUCLEAR MEDICINE • Vol. 59 • No. 10 • October 2018
are plotted for each of the 10 ROIs. CTX 5 cortex.
Downloaded from jnm.snmjournals.org by SNMMI headquarters on October 4, 2018. For personal use only.
(by 5-min intervals down to 90 min) scan duration. Data from 7 healthy
individuals. After exclusion of outlier thalamic data from 1 individual,
was in the thalamus, with relatively lower uptake in the striatum,
decline (30). Here we present the first human neuroimaging data using
2TCM and Logan graphical analysis using 90-min data from 17 healthy
FIGURE 2. Comparison between 18F-XTRA regional VT values using
thalamic activity peaked toward the end of the 90-min scan, VT
(2). After exclusion of thalamic data from 1 individual in whom
all of whom underwent PET for 90 or 180 min. The highest uptake
18F-XTRA readily accessed the brain in 17 healthy participants,
PET and 18F-XTRA, a radiotracer with promising physical (13) and
secondary regression analysis are also shown. VT is in units of mL cm−3.
the Logan method (Spearman rho 5 0.986, P 5 0.000). Results from
regional VT values from 2TCM were highly correlated with those from
losum, consistent with direct assessment in postmortem tissue
hippocampus, and cortex and lowest uptake in the corpus cal-
VT values from 180 min of data and VT values from shortened scan duration
ues from 180 min of data compared with values produced from truncated
ing of changes in cholinergic activity over the course of cognitive
timates are in units of mL cm−3. Percentage of absolute difference between
over previously used radioligands (29) may further our understand-
individuals who underwent 180-min emission scans were included. VT es-
FIGURE 3. Assessment of relative stability in 18F-XTRA regional VT val-Downloaded from jnm.snmjournals.org by SNMMI headquarters on October 4, 2018. For personal use only.
human thalamus may use longer 18F-XTRA
scan duration (180 min) or use an alternative
radiotracer that has not shown outlier thalamic
pharmacokinetics, such as 18F-AZAN (34).
CONCLUSION
18F-XTRAis a promising new radio-
FIGURE 4. Parametric images of VT of 18F-XTRA, estimated using Logan graphical analysis with tracer for measuring the human cerebral
metabolite-corrected arterial input function and 90-min data from 1 representative healthy par- a4b2-nAChR in vivo. Analysis by the 2TCM
ticipant. Transaxial views of PET/MR images demonstrate high VT values in thalamus and lower using 18F-XTRA data from 90-min scan dura-
VT values in other cortical and subcortical regions. There is no apparent region without binding of tion is sufficient to estimate V T in extra-
18F-XTRA.
thalamic ROIs, such as the cerebral cortex,
hippocampus, and striatum. 18F-XTRA PET
values were well estimated using the 2TCM and 90-min acquisi- is also a promising tool for further study of the effect of aging on
tion, especially in extrathalamic regions. The 2TCM was favored the availability of the a4b2-nAChR, particularly in the hippocam-
over the 1TCM by goodness of fit and Akaike information criterion. pus of the human brain in vivo.
The 2TCM VT and K1 values were well identified (COV , 5%) in
all extrathalamic regions and reasonably identified (COV 5 5.4%) DISCLOSURE
in the thalamus. K1 was also high (K1 . 0.48 mL cm23 min21 in all
cortical and subcortical ROIs; K1 5 0.30 mL cm23 min21 in corpus This work was supported by the Henry N. Wagner, Jr. Endowment
callosum), consistent with high radiotracer delivery. Overall, the (Martin G. Pomper), a Johns Hopkins Doris Duke Early Clinician
observed high uptake into the brain, fast pharmacokinetics, and Investigator Award (Jennifer M. Coughlin), the Alexander Wilson
ability to estimate VT in extrathalamic regions with a 90-min scan Schweizer Fellowship (Jennifer M. Coughlin), and the National
supports further use of 18F-XTRA in clinical research. Institutes of Health (R33AG037298 [Andrew G. Horti and Martin
This initial evaluation of 18F-XTRA in healthy humans revealed G. Pomper], AG038893 [Gwenn S. Smith], AG041633 [Gwenn S.
a negative correlation between age and VT in the hippocampus. Smith], Shared Instrument Grants S10RR023623 [Dean F. Wong],
Since amyloid plaque may negatively influence expression of this S10RR017219 [Dean F. Wong]). No other potential conflict of
receptor (18), all elderly ($50-y-old) participants were evaluated interest relevant to this article was reported.
for APOE e4 carrier status. Those older individuals lacked even 1
APOE e4 allele and were therefore at relatively low risk for having ACKNOWLEDGMENTS
high amyloid burden. There was also no correlation between age
and hippocampal volume or volume ratio among these partici- We thank the Johns Hopkins PET Center for expert provision of
18F-XTRA (Daniel P. Holt, Robert C. Smoot, Jack C. Brown), with
pants. Together, our results suggest that 18F-XTRA PET may be
special thanks to Alimamy Kargbo for aid in the PET metabolite
sufficiently sensitive to measure the hypothesized loss of a4b2-
analyses.
nAChR availability over aging in extrathalamic regions (5–7),
particularly the hippocampus, in which reduced expression of
the b2 subunit may account for the lower a4b2-nAChR binding REFERENCES
in the elderly (31). This aging effect was not found using 18F- 1. Dani JA. Overview of nicotinic receptors and their roles in the central nervous
nifene with PET, but this study population consisted of only 8 system. Biol Psychiatry. 2001;49:166–174.
subjects (age, 21–69 y) (32). 2. Pimlott SL, Piggott M, Owens J, et al. Nicotinic acetylcholine receptor distri-
18F-XTRA V estimates were higher in most human extrathala- bution in Alzheimer’s disease, dementia with Lewy bodies, Parkinson’s disease,
T and vascular dementia: in vitro binding study using 5-[(125)i]-a-85380. Neuro-
mic brain regions than VT values from bolus injection of other psychopharmacology. 2004;29:108–116.
recently developed radiotracers with fast pharmacokinetics, such 3. Court J, Martin-Ruiz C, Piggott M, Spurden D, Griffiths M, Perry E. Nicotinic
as (2)-18F-flubatine (25,33) and 18F-AZAN (34). Since VT repre- receptor abnormalities in Alzheimer’s disease. Biol Psychiatry. 2001;49:175–184.
4. Sabri O, Kendziorra K, Wolf H, Gertz HJ, Brust P. Acetylcholine receptors in
sents the sum of both specific binding and nondisplaceable uptake
dementia and mild cognitive impairment. Eur J Nucl Med Mol Imaging. 2008;
(22), we note the limitation that a displacement study, such as 35(suppl 1):S30–S45.
using nicotine, is needed to compare specific binding patterns 5. Meyer PM, Strecker K, Kendziorra K, et al. Reduced alpha4beta2*-nicotinic
between recently developed radiotracers. Limited blocking studies acetylcholine receptor binding and its relationship to mild cognitive and depres-
sive symptoms in parkinson disease. Arch Gen Psychiatry. 2009;66:866–877.
in baboons using 18F-XTRA PET after subcutaneous administra-
6. Marutle A, Warpman U, Bogdanovic N, Nordberg A. Regional distribution of
tion of cytisine, a selective partial agonist at the a4b2-nAChR, subtypes of nicotinic receptors in human brain and effect of aging studied by
support the specificity of this radiotracer for its target (12). Al- (1/2)-3H-epibatidine. Brain Res. 1998;801:143–149.
though 18F-XTRA also has high affinity for the a6 nicotinic re- 7. Mitsis EM, Cosgrove KP, Staley JK, et al. Age-related decline in nicotinic receptor
ceptor subunit (13), central receptors containing the a6 subunit are availability with 123I-5-IA-85380 SPECT. Neurobiol Aging. 2009;30:1490–1497.
8. Sultzer DL, Melrose RJ, Riskin-Jones H, et al. Cholinergic receptor binding in
relatively limited in distribution (retina, catecholaminergic nuclei) Alzheimer disease and healthy aging: assessment in vivo with positron emission
compared with the widespread, higher density of the a4b2- tomography imaging. Am J Geriatr Psychiatry. 2017;25:342–353.
nAChR (35). We also note that thalamic data from 1 individual 9. Horti AG, Villemagne VL. The quest for Eldorado: development of radioligands
among the 17 participants did not peak until close to the end of the for in vivo imaging of nicotinic acetylcholine receptors in human brain. Curr
Pharm Des. 2006;12:3877–3900.
90-min scan, rather than peaking at approximately 70 min. Since 10. Horti AG, Kuwabara H, Holt DP, Dannals RF, Wong DF. Recent PET radio-
we saw a similar, late peak in thalamic data in 1 of 5 baboons (12), ligands with optimal brain kinetics for imaging nicotinic acetylcholine receptors.
a conservative approach for studying the a4b2-nAChR in the J Labelled Comp Radiopharm. 2013;56:159–166.
18F-XTRA HUMAN NEUROIMAGING • Coughlin et al. 1607Downloaded from jnm.snmjournals.org by SNMMI headquarters on October 4, 2018. For personal use only.
11. Paterson D, Nordberg A. Neuronal nicotinic receptors in the human brain. Prog 23. Logan J, Fowler JS, Volkow ND, et al. Graphical analysis of reversible radioligand
Neurobiol. 2000;61:75–111. binding from time-activity measurements applied to [N-11C-methyl]-(-)-cocaine
12. Kuwabara H, Gao Y, Stabin M, et al. Imaging alpha4beta2 nicotinic acetylcholine PET studies in human subjects. J Cereb Blood Flow Metab. 1990;10:740–747.
receptors (nAChRs) in baboons with 18F-XTRA, a radioligand with improved 24. Bevington PR, Robinson DK. Data Reduction and Error Analysis for the Phys-
specific binding in extra-thalamic regions. Mol Imaging Biol. 2017;19:280–288. ical Sciences. 3rd ed. New York, NY: McGraw-Hill; 2003.
13. Gao Y, Kuwabara H, Spivak CE, et al. Discovery of (-)-7-methyl-2-exo-[39- 25. Hillmer AT, Esterlis I, Gallezot JD, et al. Imaging of cerebral alpha4beta2*
(6-18F-fluoropyridin-2-yl)-59-pyridinyl]-7-azabicyclo[2.2. 1]heptane, a radiolabeled nicotinic acetylcholine receptors with (-)-18F-flubatine PET: implementation of
antagonist for cerebral nicotinic acetylcholine receptor (alpha4beta2-nAChR) bolus plus constant infusion and sensitivity to acetylcholine in human brain.
with optimal positron emission tomography imaging properties. J Med Chem. Neuroimage. 2016;141:71–80.
2008;51:4751–4764. 26. Akaike H. A new look at the statistical model identification. IEEE Trans Automat
14. Pichika R, Easwaramoorthy B, Collins D, et al. Nicotinic alpha4beta2 receptor Contr. 1974;19:716–723.
imaging agents: part II. Synthesis and biological evaluation of 2-18F-fluoro-3-[2- 27. Carson RE. Parameter estimation in positron emission tomography. In: Phelps
((S)-3-pyrrolinyl)methoxy]pyridine (18F-nifene) in rodents and imaging by PET ME, Mazziotta JC, Schelbert HR, eds. Positron Emission Tomography and Auto-
in nonhuman primate. Nucl Med Biol. 2006;33:295–304. radiography: Principles and Applications for the Brain and Heart. New York, NY:
15. Smits R, Fischer S, Hiller A, et al. Synthesis and biological evaluation of both enan- Raven Press; 1986:347–390.
tiomers of 18F-flubatine, promising radiotracers with fast kinetics for the imaging of 28. Hoaglin DC, Iglewicz B. Fine-tuning some resistant rules for outlier labeling.
alpha4beta2-nicotinic acetylcholine receptors. Bioorg Med Chem. 2014;22:804–812. J Am Stat Assoc. 1987;82:1147–1149.
16. Hughes CP, Berg L, Danziger WL, Coben LA, Martin RL. A new clinical scale 29. Horti AG, Wong DF. Clinical perspective and recent development of PET radioligands
for the staging of dementia. Br J Psychiatry. 1982;140:566–572. for imaging cerebral nicotinic acetylcholine receptors. PET Clin. 2009;4:89–100.
17. Poirier J, Delisle MC, Quirion R, et al. Apolipoprotein E4 allele as a predictor of 30. Volkow ND, Ding YS, Fowler JS, Gatley SJ. Imaging brain cholinergic activity
cholinergic deficits and treatment outcome in alzheimer disease. Proc Natl Acad with positron emission tomography: its role in the evaluation of cholinergic
Sci USA. 1995;92:12260–12264. treatments in alzheimer’s dementia. Biol Psychiatry. 2001;49:211–220.
18. Wevers A, Burghaus L, Moser N, et al. Expression of nicotinic acetylcholine 31. Court JA, Martin-Ruiz C, Graham A, Perry E. Nicotinic receptors in human
receptors in Alzheimer’s disease: postmortem investigations and experimental brain: topography and pathology. J Chem Neuroanat. 2000;20:281–298.
approaches. Behav Brain Res. 2000;113:207–215. 32. Mukherjee J, Lao PJ, Betthauser TJ, et al. Human brain imaging of nicotinic
19. Coughlin JM, Du Y, Rosenthal HB, et al. The distribution of the alpha7 nicotinic acetylcholine alpha4beta2* receptors using 18F-nifene: selectivity, functional
acetylcholine receptor in healthy aging: an in vivo positron emission tomography activity, toxicity, aging effects, gender effects, and extrathalamic pathways.
study with 18F-ASEM. Neuroimage. 2018;165:118–124. J Comp Neurol. 2018;526:80–95.
20. Sossi V, de Jong HWAM, Barker WC, et al. The second generation HRRT: a 33. Sabri O, Becker GA, Meyer PM, et al. First-in-human PET quantification study
multi-centre scanner performance investigation. IEEE Nucl Sci Symp Conf Rec. of cerebral alpha4beta2* nicotinic acetylcholine receptors using the novel spe-
2005;4:2195–2199. cific radioligand (-)-18F-flubatine. Neuroimage. 2015;118:199–208.
21. Hilton J, Yokoi F, Dannals RF, Ravert HT, Szabo Z, Wong DF. Column-switch- 34. Wong DF, Kuwabara H, Kim J, et al. PET imaging of high-affinity alpha4beta2
ing HPLC for the analysis of plasma in PET imaging studies. Nucl Med Biol. nicotinic acetylcholine receptors in humans with 18F-AZAN, a radioligand with
2000;27:627–630. optimal brain kinetics. J Nucl Med. 2013;54:1308–1314.
22. Innis RB, Cunningham VJ, Delforge J, et al. Consensus nomenclature for in vivo 35. Quik M, Perez XA, Grady SR. Role of alpha6 nicotinic receptors in CNS dopa-
imaging of reversibly binding radioligands. J Cereb Blood Flow Metab. 2007;27: minergic function: relevance to addiction and neurological disorders. Biochem
1533–1539. Pharmacol. 2011;82:873–882.
1608 THE JOURNAL OF NUCLEAR MEDICINE • Vol. 59 • No. 10 • October 2018Downloaded from jnm.snmjournals.org by SNMMI headquarters on October 4, 2018. For personal use only. 18F-XTRA PET for Enhanced Imaging of the Extrathalamic α4β2 Nicotinic Acetylcholine Receptor Jennifer M. Coughlin, Stephanie Slania, Yong Du, Hailey B. Rosenthal, Wojciech G. Lesniak, Il Minn, Gwenn S. Smith, Robert F. Dannals, Hiroto Kuwabara, Dean F. Wong, Yuchuan Wang, Andrew G. Horti and Martin G. Pomper J Nucl Med. 2018;59:1603-1608. Published online: March 1, 2018. Doi: 10.2967/jnumed.117.205492 This article and updated information are available at: http://jnm.snmjournals.org/content/59/10/1603 Information about reproducing figures, tables, or other portions of this article can be found online at: http://jnm.snmjournals.org/site/misc/permission.xhtml Information about subscriptions to JNM can be found at: http://jnm.snmjournals.org/site/subscriptions/online.xhtml The Journal of Nuclear Medicine is published monthly. SNMMI | Society of Nuclear Medicine and Molecular Imaging 1850 Samuel Morse Drive, Reston, VA 20190. (Print ISSN: 0161-5505, Online ISSN: 2159-662X) © Copyright 2018 SNMMI; all rights reserved.
You can also read