Clinical performance of long axial field of view PET/CT: a head-to-head intra-individual comparison of the Biograph Vision Quadra with the ...
←
→
Page content transcription
If your browser does not render page correctly, please read the page content below
European Journal of Nuclear Medicine and Molecular Imaging
https://doi.org/10.1007/s00259-021-05282-7
ORIGINAL ARTICLE
Clinical performance of long axial field of view PET/CT:
a head-to-head intra-individual comparison of the Biograph Vision
Quadra with the Biograph Vision PET/CT
Ian Alberts 1 & Jan-Niklas Hünermund 1 & George Prenosil 1 & Clemens Mingels 1 & Karl Peter Bohn 1 & Marco Viscione 1 &
Hasan Sari 1,2 & Bernd Vollnberg 1 & Kuangyu Shi 1 & Ali Afshar-Oromieh 1 & Axel Rominger 1
Received: 25 January 2021 / Accepted: 23 February 2021
# The Author(s) 2021
Abstract
Purpose To investigate the performance of the new long axial field-of-view (LAFOV) Biograph Vision Quadra PET/CT and a
standard axial field-of-view (SAFOV) Biograph Vision 600 PET/CT (both: Siemens Healthineers) system using an intra-patient
comparison.
Methods Forty-four patients undergoing routine oncological PET/CT were prospectively included and underwent a same-day
dual-scanning protocol following a single administration of either 18F-FDG (n = 20), 18F-PSMA-1007 (n = 16) or 68Ga-DOTA-
TOC (n = 8). Half the patients first received a clinically routine examination on the SAFOV (FOVaxial 26.3 cm) in continuous bed
motion and then immediately afterwards on the LAFOV system (10-min acquisition in list mode, FOVaxial 106 cm); the second
half underwent scanning in the reverse order. Comparisons between the LAFOV at different emulated scan times (by rebinning
list mode data) and the SAFOV were made for target lesion integral activity, signal to noise (SNR), target lesion to background
ratio (TBR) and visual image quality.
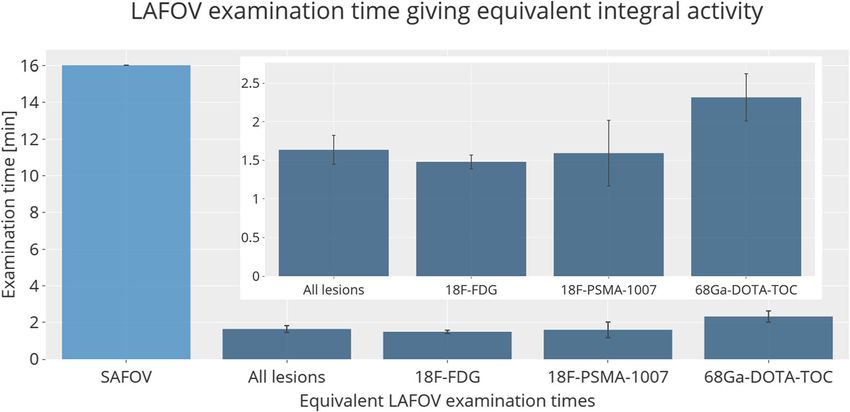
Results Equivalent target lesion integral activity to the SAFOV acquisitions (16-min duration for a 106 cm FOV) were obtained
on the LAFOV in 1.63 ± 0.19 min (mean ± standard error). Equivalent SNR was obtained by 1.82 ± 1.00 min LAFOV acqui-
sitions. No statistically significant differences (p > 0.05) in TBR were observed even for 0.5 min LAFOV examinations.
Subjective image quality rated by two physicians confirmed the 10 min LAFOV to be of the highest quality, with equivalence
between the LAFOV and the SAFOV at 1.8 ± 0.85 min. By analogy, if the LAFOV scans were maintained at 10 min, propor-
tional reductions in applied radiopharmaceutical could obtain equivalent lesion integral activity for activities under 40 MBq and
equivalent doses for the PET component ofEur J Nucl Med Mol Imaging
photomultiplier tubes. Such fully digital PET/CT systems Materials and methods
offer a number of technical and clinical advantages [2,
3], with corresponding improvements in image quality Study design
and lesion detection [3–9]. Although such systems have
included longer axial coverage compared to previous This prospective, non-randomised, dual-arm crossover, com-
generation systems, typically less than an eighth of the parative imaging study aims to compare the subjective imag-
body can be examined in the field of view (FOV) at a ing quality by an intra-individual comparison of scans obtain-
given time. As a result, less than 1% of all emitted ed on a SAFOV and a LAFOV system. The primary objective
coincidence photons can be detected, placing inherent is to estimate the scan time on the LAFOV system (0.5 to
physical limits on the detection efficiency and sensitiv- 10 min) giving equivalent count statistics to routine clinical
ity of such systems [10]. examinations on the SAFOV system, and thereby quantifying
Most recently, long axial field-of-view (LAFOV) the benefit of LAFOV systems in terms of lesion quantifica-
scanners with SiPM detection systems have been intro- tion in a clinical setting. The secondary objectives are to com-
duced, with Badawi et al. reporting the first clinical pare image quality in terms of image signal-to-noise ratio
experiences with a 194-cm FOV scanner (uExplorer, (SNR), subjective image quality as rated by clinicians and
United Imaging Healthcare Co, Shanghai, China) [11], target lesion signal to background noise ratios (TBR). The
which provided substantially improved count density study hypothesis was that, with a LAFOV system, one can
when compared with previous-generation standard axial achieve superior lesion quantification in terms of integral mea-
field-of-view (SAFOV) systems. The signal-to-noise ra- sured activity compared to a standard-of-care acquisition on a
tio (SNR) of a PET system is given by the well-known SAFOV. The endpoint of the study was the exposure time on
relationship, where k is a constant (which also include a the LAFOV yielding target lesion integral measured activity
gain factor due to the use of time-of-flight), S is the equivalent to the SAFOV.
sensitivity of the scanner, AR is the applied radiophar- We assume a minimum effect size of ±1 min equivalent
maceutical activity and Ta the total acquisition time: scan time and a pragmatic estimate for the standard deviation
of ±1 min. For a two tailed α = 0.05 and a study power of
pffiffiffiffiffiffiffiffiffiffiffiffiffiffiffiffiffiffiffiffiffiffiffiffiffi
SNR≈k S AR T a 85%, a target sample size of n > 40 individuals based on the
t-statistic and non-centrality parameter was calculated.
Inclusion criteria were individuals over the age of 18 willing
As such, the improved sensitivity can improve SNR, or to undergo a second examination and with at least one positive
allow for reductions in applied radiopharmaceutical activ- target lesion in the first examination. Exclusion criteria were
ities or shorter duration acquisitions while providing lack of target lesions in the first PET/CT, inability to provide
equivalent image quality. Although the performance of informed consent, claustrophobia or inability to undergo a
the pioneering uEXPLORER LAFOV system has been second examination. One patient undergoing 18F-FDG-PET/
extensively characterised by phantom measurements CT was excluded from the study owing to significant motion
[12], the performance and utility of such LAFOV systems artefact during the second examination; all other patients were
have been less well evaluated in clinical settings so far. included in the analysis. The study flowchart is in Fig. 1. This
The first Biograph Vision Quadra PET/CT LAFOV sys- prospective study was approved by the regional ethics com-
tem worldwide (“Quadra”, Siemens Healthineers, mittee (KEK 2020/01413) and performed in accordance with
Knoxville, TN, USA) with a FOV of 106 cm was installed the declaration of Helsinki and all relevant national
in October 2020 at the Department for Nuclear Medicine, legislation.
Inselspital, University Hospital Bern, in Switzerland.
Preliminary assessments of this scanner’s characteristics Patient population
reveal a sensitivity of 174 cps/kBq and a time of flight
(TOF) resolution of 219 ps in ultra-high sensitivity mode Target recruitment was met with recruitment of 44 individuals
[13]. The aim of this study is to provide an intra- undergoing clinically routine oncological PET/CT at the
individual comparison of this novel LAFOV system with University Hospital Bern (n = 20 with 18F-FDG, n = 16 18F-
the clinically well-established Biograph Vision 600 PSMA-1007, n = 8 68Ga-DOTA-TOC) between 10 and 12/
(Siemens Healthineers, Knoxville, TN, USA) SAFOV 2020. Patients undergoing 18F-FDG studies were selected to
system, with a standard axial FOV of 26.3 cm. To the provide a broad and balanced selection of tumour entities, and
best of our knowledge, this study represents the first patients undergoing 18F-PSMA-1007 and 68Ga-DOTA-TOC
intra-individual head-to-head comparison of an LAFOV were referred for examination of known prostate cancer (n =
with a SAFOV in a clinical setting as well as the first 13 biochemical recurrence and n = 1 histologically confirmed
clinical experiences with this new LAFOV system. primary prostate cancer) or histologically confirmed SSTR-2Eur J Nucl Med Mol Imaging
Fig. 1 Study flowchart showing N=45 patients recruited and received
patient recruitment, total patients same day dual scans following single
included and excluded radiopharmaceutical dose
N=2118F-FDG N=1618F-PSMA-1007 N=8 68Ga-DOTA-TOC
N=1 patient
excluded
(motion artefact)
N=44 patients included for analysis
positive neuroendocrine tumours respectively. All patients (bp) (https://www.siemens-healthineers.com/molecular-
provide written informed consent for inclusion in this study, imaging/options-and-upgrades/software-applications/
which was approved by the regional ethics committee. flowmotion-technology). Consequently, an effective
examination time of 16.06 min would be required to capture
Imaging routines an equivalent 106 cm FOV in CBM at a velocity of 1.1 mm/s,
where the 2 min/bp includes table overlap. Images were ac-
As per clinical routine, we required patients referred for 18F- quired on the LAFOV in one bed position for a total acquisi-
FDG studies to have fasted for >6 h prior to scanning and a tion of 10 min. PET-data for the LAFOV were sampled to
venous blood glucose ofEur J Nucl Med Mol Imaging ml (where activities were decay corrected to time of injection) scale, MIP images and axial slices for LAFOV and SAFOV and TLM is the acquisition duration in seconds (s), where scan images were ranked in order of quality (from highest to low- acquisition duration is given by the time/bp). This lesion inte- est). Where images were of equal quality, this was noted, and gral activity can be considered a measure of the count statistic where the SAFOV scanner was ranked as intermediate be- or count density (counts/ml) [16]. A linear regression model tween two scan times (e.g. as between a 1 and 2 min scan was used for the LAFOV integral activity as a function of total time) then the intermediate value was interpolated. In this acquisition duration, to calculate an equivalent scan time to way, the emulated scan time for the LAFOV giving equiva- yield equal integral lesion activity on the SAFOV, i.e. the time lency in terms of subjective image quality to the SAFOV on the LAFOV giving equal count statistics to the SAFOV. could be obtained. By analogy, images equivalent to the By maintaining the LAFOV examination at 10 min, instead LAFOV scan could be obtained by maintaining the same of reduction in acquisition time, emulated reduction in radio- LAFOV examination time (10 min) and proportional reduc- pharmaceutical activities could be calculated for images of tion in applied radiopharmaceutical activities (MBq), and the equivalent quality/count statistic to the SAFOV. The corre- estimated effective radiation dose associated with this analo- sponding radiopharmaceutical dose equivalents were as fol- gous scan (mSv). lows: 0.019 mSv/MBq for 18F-FDG [17], 0.022 mSv/MBq for 18 F-PSMA-1007 [18] and 0.023 mSv/MBq for 68Ga-DOTA- Statistical analysis TOC [19]. The background was measured by the placement of a Statistical analyses and production of graphs were performed 14 cm3 volume-of-interest (VOI) in healthy liver tissue in using Excel (Microsoft, Redmond, Washington) and R (ver- the right liver lobe as previously described [17]. VOIs were sion 4.0.3). Data are presented as mean ± standard error unless copied and pasted between different images obtained from otherwise stated, with differences assessed by the paired different (list mode) frame durations, ensuring that the same Student’s t test. Linear regression analysis was used to obtain VOI was analysed for each acquisition which was confirmed an equivalent scan time for the LAFOV giving equivalent by comparison of the metabolic tumour volume (MTV). A integral activity or SNR to the SAFOV. Correlation between SNR was defined as the reciprocal coefficient of variation scan time and subjective image quality ranking for the (COV) for the liver background (μ/σ), where σ = standard LAFOV were compared by Spearman’s rank correlation co- deviation of the background VOI and μ = background efficient. p values
Eur J Nucl Med Mol Imaging

Table 1 Patient characteristics; N number of patients and by tumour      radiopharmaceutical activity applied (MBq); ±SD standard deviation;
type (HCC hepatocellular cancers, ORL head and neck cancers, Colon ca    age (years); mean delay (time window between start of the first examina-
colorectal cancers); mSv equivalent dose PET component; mean             tion and the start of the second examination)

Radiotracer         N, tumour type                               mSV Mean activity           Mean activity      Age      Mean Delay
                                                                     (MBq)                   SD                 (a)      (hh:mm:ss)
18
 F-FDG        N=20 (lung=6, lymphoma 3, ORL 3, breast 2, 5.0            265.6                65.8               67.9     00:47:08
               thyroid 2, melanoma 2, HCC 1, Colon Ca 1
18
  F-PSMA-1007 N=16 (14 biochemical recurrence, 2 primary) 5.4           243.9                14.0               75.5     00:57:21
68
  Ga-DOTA-TOC N=8 (SSTR expressing neuroendcrine          3.5           154.1                12.0               65.3     01:15:21
               tumours)

Sub-group analysis by radiotracer is as follows: 18F-FDG                 Image quality
1.41 ± 1.01 min; 18F-PSMA-1007 1.59 ± 0.42 min; 68Ga-
DOTA-TOC 2.32 ± 0.30 min (Fig. 2). The highest integral                  All MIP and axial images (10, 4, 2, 1, 0.5 min LAFOV and
activities were obtained by the 10 min LAFOV scans, with                 full acquisition SAFOV) were ranked at blinded assess-
data for all radiotracers at different emulated exposure times           ment in order of quality. The readers were unaware of the
for the LAFOV shown in Fig. 3, visual inspection of which                scanner type, scan order or clinical details and had not
confirms the integral lesion activity on the SAFOV as being              previously seen these cases. The reference SAFOV images
intermediate between the LAFOV 1 and 2 min acquisitions.                 were consistently ranked as of inferior quality, with a me-
                                                                         dian ranking of 4th worst (range 3–5), and were largely
                                                                         evaluated as intermediate between the 2 and 0.5 min
Signal-to-noise ratio                                                    LAFOV images. Overall image quality on the LAFOV
                                                                         correlated with length of acquisition, with the 10 min being
The SNR (inverse coefficient of variation) was highest for
                                                                         ranked as highest quality in 100% of the cases. The aver-
long-duration LAFOV images (10 min). Equivalency between
                                                                         age scan times for the LAFOV ranked as equivalent to the
the LAFOV and SAFOV was seen at 1.83 ± 1.00 min. The
                                                                         SAFOV reference acquisitions were as follows: 18F-FDG
results are shown in Fig. 4.
                                                                         1.95 ± 0.86 min, 1 8 F-PSMA-1007 1.95 ± 0.86 min,
                                                                         68
                                                                            Ga-DOTA-TOC 1.50 ± 0.48 min. Image quality for the
Target lesion-to-background ratio                                        LAFOV correlated perfectly with length of acquisition
                                                                         time for all radiotracers (Pearson’s rank coefficient 0.997
Improved TBR was seen on the LAFOV at 10 min (mean                       for 18 F-FDG, 1 for 18F-PSMA-1007 and 68 Ga-DOTA-
2.27 ± 0.02) compared to the SAFOV (mean 2.06 ± 0.02).                   TOC). Example images are presented in Fig. 6.
However, no statistically significant differences were ob-                   Finally, while of consistently lower quality compared to the
served for any LAFOV acquisition, even at 0.5 min, p =                   SAFOV reference images, the 0.5 min acquisitions on the
0.47), suggesting adequate lesion-to-background contrast                 LAFOV system provided visualisation of all target lesions
even for short acquisitions. The results are shown in Fig. 5.            and were of acceptable quality.

Fig. 2 Scan times (min) for the
LAFOV delivering equivalent le-
sion integral activity to the
SAFOV standard examination
(16.06 min). In the inset tile, a
zoomed graph showing only
LAFOV data is available to aid
comparison. Error bars show the
standard error
Eur J Nucl Med Mol Imaging
Fig. 3 Violin plots showing
lesion integral activity (all
radiotracers) for the SAFOV
(blue) and for various scan times
(0.5 to 10 min) on the LAFOV
(red). The measured integral ac-
tivity on the SAFOV scanner was
equivalent to between 1- and 2-
min scans obtained on the
LAFOV. The violin plots repre-
sent data density and distribution
Lesion quantification and time window between is equal). The calculated equivalent activities and resultant
scans radiation doses for each radiotracer are shown in Table 2.
The potential for the time between scans/imaging sequence to
affect lesion quantification was considered. No statistically
significant correlation was observed between difference in Discussion
scan starting time and absolute difference in lesion peak inte-
gral activity between scan one and scan two (r = 0.17, p = This present study represents the first published clinical expe-
0.15) or for SNR (r = 0.39, p = 0.08). riences with the Siemens Biograph Vision Quadra PET/CT
system, and the first intra-individual comparative imaging
study comparing a long axial FOV PET/CT scanner and a
Equivalent low activity scan and equivalent radiation standard FOV, clinically established PET/CT system.
dose Previously published pioneering studies using LAFOV
systems report increased detection efficiency, the potential
Equivalent lesion measured integral activity compared to the for ultra-short or low-dose examination protocols and in-
SAFOV reference (15 min total scanning time in CBM) was creased dynamic range of the scanners affording later image
achieved on the LAFOV with an average 1.63 min scan time acquisitions [10, 11]. However, much of the hitherto pub-
with the whole FOV captured in one bed position (e.g. lished literature on LAFOV is limited to case studies as initial
16.06÷1.63 = 9.9x reduction in effective examination time). clinical experiences [11] or phantom studies [12]. Most re-
Alternatively, LAFOV examinations could be maintained at cently, a dual-armed study with two cohorts randomised to
10 min with proportional (e.g. 10÷1.63 = 6.1x) reduction in either full (SAFOV) or half-dose scanning using a LAFOV
the injected radiopharmaceutical activity (where the product system was published in a cohort of patients with lung cancer
of applied radiopharmaceutical activity × acquisition time/bp [21], and low-dose protocols have been examined in healthy
Fig. 4 Boxplots showing signal-
to-noise ratio (SNR) for the liver
background, which is the recip-
rocal of the coefficient of varia-
tion. The measured SNR for
SAFOV scanner (blue) was
equivalent to between 1- and 2-
min scans obtained on the
LAFOV (red)Eur J Nucl Med Mol Imaging Fig. 5 Tumour-to-background ratios (TBR) for the SAFOV (left, blue) and LAFOV (right, red). No statistically significant differences were observed between the SAFOV and LAFOV acquisi- tions, even at short (0.5 min) scan times volunteers [22]. However, the full potential of LAFOV sys- factor of 9.9x faster for equivalent count statistics. Such im- tems is yet to be characterised in a clinical setting. ages were not at the detriment of image quality, with equiva- In this present study, we compared LAFOV images to a lence in image SNR being obtained at 1.82 ± 1.00 min. This standard-of-care acquisition on a SAFOV scanner. The correlates well with the subjective visual analysis by two phy- SAFOV acquisitions were obtained in CBM at a table velocity sicians blinded to scanner type, scan order or patient details, of 1.1 mm/s. For a SAFOV including overlap in bed positions who rated the SAFOV acquisitions as being equivalent to to account for the loss of sensitivity at the extremes of the LAFOV 1.8 ± 0.85 min acquisitions and demonstrates the FOV [23], this table velocity is equivalent to a 2 min/bp ex- clinical acceptability of such scans. As such, we are able to posure (https://www.siemens-healthineers.com/molecular- demonstrate a significantly improved sensitivity for a LAFOV imaging/options-and-upgrades/software-applications/ system beyond a factor four which could be expected due to flowmotion-technology). An effective examination time of the simple extension of the FOV (106 cm vs 26.3 cm FOV). 16.06 min can be computed to obtain a FOV of 106 cm The combination of this improved sensitivity profile for the (“eyes to thighs”), which can be achieved in one bed LAFOV across a larger portion of the FOV [12] and improved position on the LAFOV. In this study, we demonstrate that photon detection efficiency as a result of better scanner geom- equivalent lesion activity to the standard-of-care SAFOV ac- etry [10] means that examinations with equivalent integral quisition is obtained by the LAFOV in 1.63 ± 0.19 min, i.e. a activity and SNR can be obtained in under 2 min. We Fig. 6 Example maximum intensity projection (MIP, top row) and axial acquisitions on the left (blue margin) and the LAFOV for 10-, 4-, 2-, 1- PET images (bottom row) images for a 57-year-old female with non- and 0.5-min acquisitions (right, red margin). For reference, the PET win- small cell lung cancer, presented are images for the regular SAFOV dow is set to 0 to 8.5 SUV
Eur J Nucl Med Mol Imaging

Table 2 Equivalent acquisition times for equivalent target lesion       radiation dose (mSv) giving equivalent target lesion integral activity for
integral activities obtained for the SAFOV (Vision) and LAFOV           examination times on the LAFOV equalling the SAFOV are given
(Quadra) systems. Activities (MBq) and corresponding equivalent

                          Examination time (min)                    Equivalent activity (MBq)                    Equivalent dose (mSv)

Radiotracer               SAFOV             LAVFOV                  SAFOV                 LAFOV                  SAFOV                 LAFOV
18
  F-FDG                   16.06             1.48                    265.6                 39.3                   5.04                  0.75
18
  F-PSMA-1007             16.06             1.59                    243.9                 38.8                   5.37                  0.85
68
  Ga-DOTA-TOC             16.06             2.32                    154.1                 35.7                   3.54                  0.82

highlight that these results are obtained using MRD of 85 and           circumstances, e.g. for paediatric examinations, and could
there is even further potential to reduce imaging time and/or           simplify clinical routines involving anaesthesia, poorly com-
injected activity once the ultra-high sensitivity mode with a           pliant patients or those suffering from claustrophobia.
MRD of 322 is clinically available.                                     Furthermore, although not the focus of this study, with equiv-
    By analogy, the effective acquisition time on the LAFOV             alent examination doses for the PET component under
could be maintained at the full 10 min, which remains shorter           0.9 mSv, this raises the notion that PET/CT could gain popu-
that the 16.06 min for the standard-of-care SAFOV acquisi-              larity as a screening tool with lower radiation burden com-
tions. Instead of reducing examination time, one could reduce           pared to some conventional screening modalities, coupled
injected radiopharmaceutical dose by a factor of up to 6.1x,            with the additional diagnostic gain of molecular imaging data.
yielding equivalent examination parameters as described                     Finally, the routine 10 min LAFOV acquisitions were of
above with radiopharmaceutical doses of under 40 MBq and                exquisite visual quality, confirmed by a blinded assessment by
equivalent radiation dose for the PET component of under                two experienced readers. Equivalent count densities would
0.9 mSv can be reached (see Table 2). The reader is reminded            not be feasible on a current generation SAFOV scanner, and
that the effective examination time remains longer on the               would require an impossibly slow theoretical table velocity of
SAFOV scanner, where bed-position overlap is required,                  0.11 mm/s (i.e. 9.9x slower compared to the standard 1.1 mm/
whereas the LAFOV offers a single position capture of the               s) and an impracticable effective examination time of 160 min.
head to the thighs for the average adult, explaining the differ-        This serves to demonstrate that LAFOV scanners enable pre-
ence in factors between effective examination time (examina-            viously unachievable levels of image quality and quantifica-
tion duration) and dose or acquisition time for the single bed          tion, even when compared to a state-of-the-art, fully digital
position acquisition on the LAFOV.                                      SAFOV PET/CT system. Further improvements in imaging
    Whereas previous studies report the clinical acceptability          quality may be expected once the ultra-high sensitivity mode
of “half-dose” protocols in LAFOV PET/CT [21], our data                 with a higher MRD is available. Our data suggest that LAFOV
suggest that further and more significant activity reductions           scanners can be used flexibly; according to clinical question
are feasible and confirm previous proof-of-concept studies              and patient factors, ultra-low dose, ultra-fast or ultra-high-
showing the practicability of “low dose” protocols for                  fidelity images can be obtained using a variety of tailored
LAFOV [11, 22]. In contrast to previously reported low-                 protocols.
activity protocols proposed for digital SAFOV [24], such                    One strength of this study lies in the comparison between
LAFOV protocols, are not at the cost of imaging quantifica-             the Siemens Biograph Vision 600 SAFOV PET/CT system
tion or missed target lesions, where such protocols may raise           and the Siemens Biograph Vision Quadra LAFOV PET/CT
concerns about potential for clinical detriment [25]. Although          system, which both utilise the same detector technology, iden-
EARL-compliant protocols to determine the minimum activ-                tical crystal size and identical reconstruction parameters. The
ity for lesion quantification have been published [26], the             Biograph Vision is already demonstrated to have excellent
possibility for reduced radiopharmaceutical dose for PSMA-              performance in terms of TOF sensitivity gain, equivalent to
or DOTA-radioligand imaging needs to be considered, and                 a noise reduction in the image [27], with further gains in sen-
further studies in this regard with novel LAFOV scanners                sitivity for the Quadra owing to the large FOV. Therefore,
are required.                                                           differences in dynamic lesion uptake notwithstanding, any
    In addition, while of lower visual quality compared to a            resultant differences in imaging quality or lesion quantifica-
standard of care SAFOV acquisition, 0.5 min LAFOV acqui-                tion arise predominantly as a result of the difference in scanner
sitions delivered no detriment in terms of reduced target               design, namely the FOV length, geometry and the sensitivity
lesion-to-background ratio (TBR) or reduced lesion detect-              profile. By including the head, torso and upper thighs in the
ability. Such ultra-fast scans may be indicated in some                 entire FOV as well as an improved axial sensitivity profile
Eur J Nucl Med Mol Imaging
throughout the scanner compared to the SAFOV system [28], doses under 40 MBq, yielding equivalent radiation doses of
LAFOV systems demonstrate more favourable geometries under 1 mSv. As such, we demonstrate in a clinical setting that
compared to SAFOV systems. LAFOV can be used flexibly to deliver high-quality, ultra-fast
The main limitation of our study is our small sample size, or ultra-low dose examinations depending on the clinical con-
and this study represents the initial clinical experiences world- text. The possibility for substantial reduction in minimum ac-
wide with this scanner. Although the sample size was deter- tivities for high-sensitivity LAFOV scanners will need to be
mined in advance of the study which was adequately powered considered by future studies.
to test its hypothesis, we recognise that the sample size of 44
patients does not exclude particular clinical scenarios in which
an ultra-low dose scan could result in inferior diagnostic qual- Funding Open Access funding provided by Universität Bern.
ity and potentially impact patient management. Future studies
with larger patient cohorts are required to confirm our findings Declarations
and investigate other factors contributing to the total radiation
Conflict of interest HS is a full-time employee of Siemens Healthcare
exposure.
AG, Switzerland. AR has received research support and speaker hono-
Head-to-head comparison studies inherently have an un- raria from Siemens. All other authors have no conflicts of interest to
avoidable delay between images acquired on one scanner report.
and the next. The mean time difference between the start of
the first and the second scans we report represents the time to Ethical approval The cantonal ethics committee approved this prospec-
tive study (KEK 2020-01413). All patients provided written informed
acquire the first image, confirm the presence of target lesions,
consent for inclusion in this study. The study was performed in accor-
move the patient from one scanner to another and commence dance with the declaration of Helsinki.
acquisition of the subsequent image; they are as short as the
clinical service of a busy nuclear medicine clinic allows. The Open Access This article is licensed under a Creative Commons
Attribution 4.0 International License, which permits use, sharing, adap-
time between starting the first examination and the second of tation, distribution and reproduction in any medium or format, as long as
47 min for 18F-FDG, 57 min for 18F-PSMA-1007 and 55 min you give appropriate credit to the original author(s) and the source, pro-
for 68Ga-DOTA-TOC was as short as practicable, and scan vide a link to the Creative Commons licence, and indicate if changes were
delay as a covariate showed no relationship with lesion inte- made. The images or other third party material in this article are included
in the article's Creative Commons licence, unless indicated otherwise in a
gral activity or SNR. Nevertheless, continued accumulation or credit line to the material. If material is not included in the article's
washout of the radiotracer during this time cannot be exclud- Creative Commons licence and your intended use is not permitted by
ed. For this reason, patients were divided into two equally statutory regulation or exceeds the permitted use, you will need to obtain
sized groups undergoing the first scan on the LAFOV and permission directly from the copyright holder. To view a copy of this
licence, visit http://creativecommons.org/licenses/by/4.0/.
SAFOV scanner respectively, minimizing any resultant bias.
Our study did not systematically test for any improved
lesion detection with LAFOV systems and we highlight that
all target lesions were identifiable in all LAFOV and SAFOV
images. Previous studies confirm improved lesion quantifica-
References
tion in state-of-the-art digital SAFOV systems [29] resulting
in higher lesion detection [3, 7] and improved diagnostic cer- 1. Beyer T, Townsend DW, Brun T, Kinahan PE, Charron M, Roddy
tainty and inter-reader reliability [9] which may be the case for R, et al. A combined PET/CT scanner for clinical oncology. J Nucl
LAFOV scanners and for which further studies are warranted. Med. 2000;41:1369–79.
2. van Sluis JJ, de Jong J, Schaar J, Noordzij W, van Snick P, Dierckx
R, et al. Performance characteristics of the digital biograph vision
PET/CT system. J Nucl Med. 2019. https://doi.org/10.2967/
Conclusion jnumed.118.215418.
3. Surti S, Viswanath V, Daube-Witherspoom ME, Conti M, Casey
In an intra-individual comparison in 44 patients using three ME, Karp JS. Benefit of improved performance with state-of-the art
common radiotracers, we are able to confirm the increased digital PET/CT for lesion detection in oncology. J Nucl Med. 2020.
https://doi.org/10.2967/jnumed.120.242305.
sensitivity of LAFOV scanners, both in terms of lesion quan- 4. Nguyen NC, Vercher-Conejero JL, Sattar A, Miller MA,
tification, image noise and subjective imaging quality. We Maniawski PJ, Jordan DW, et al. Image quality and diagnostic
find that such improved sensitivity means that images of performance of a digital PET prototype in patients with oncologic
equivalent quality to a state-of-the-art standard FOV digital diseases: initial experience and comparison with analog PET. J
Nucl Med. 2015;56:1378–85. https://doi.org/10.2967/jnumed.
PET/CT system can be achieved with examinations in under
114.148338.
2 min. By analogy, where examination time is maintained as 5. Lopez-Mora DA, Flotats A, Fuentes-Ocampo F, Camacho V,
standard, reductions in applied radiopharmaceutical dose can Fernandez A, Ruiz A, et al. Comparison of image quality and lesion
yield images with equivalent parameters as described and detection between digital and analog PET/CT. Eur J Nucl Med MolEur J Nucl Med Mol Imaging
Imaging. 2019;46:1383–90. https://doi.org/10.1007/s00259-019- 18. Giesel FL, Hadaschik B, Cardinale J, Radtke J, Vinsensia M,
4260-z. Lehnert W, et al. F-18 labelled PSMA-1007: biodistribution, radi-
6. Fuentes-Ocampo F, Lopez-Mora DA, Flotats A, Paillahueque G, ation dosimetry and histopathological validation of tumor lesions in
Camacho V, Duch J, et al. Digital vs analog PET/CT: intra-subject prostate cancer patients. Eur J Nucl Med Mol Imaging. 2017;44:
comparison of the SUVmax in target lesions and reference regions. 678–88. https://doi.org/10.1007/s00259-016-3573-4.
Eur J Nucl Med Mol Imaging. 2019. https://doi.org/10.1007/ 19. Sandström M, Velikyan I, Garske-Román U, Sörensen J, Eriksson
s00259-018-4256-0. B, Granberg D, et al. Comparative biodistribution and radiation
7. Alberts I, Prenosil G, Sachpekidis C, Weitzel T, Shi K, Rominger Dosimetry of 68Ga-DOTATOC and 68Ga-DOTATATE in patients
A, et al. Digital versus analogue PET in [(68)Ga]Ga-PSMA-11 with neuroendocrine tumors. J Nucl Med. 2013;54:1755. https://
PET/CT for recurrent prostate cancer: a matched-pair comparison. doi.org/10.2967/jnumed.113.120600.
Eur J Nucl Med Mol Imaging. 2020;47:614–23. https://doi.org/10. 20. Yan J, Schaefferkoetter J, Conti M, Townsend D. A method to
1007/s00259-019-04630-y. assess image quality for low-dose PET: analysis of SNR, CNR, bias
8. Alberts I, Sachpekidis C, Prenosil G, Viscione M, Bohn KP, and image noise. Cancer Imaging. 2016;16:26. https://doi.org/10.
Mingels C, et al. Digital PET/CT allows for shorter acquisition 1186/s40644-016-0086-0.
protocols or reduced radiopharmaceutical dose in [18F]-FDG 21. Tan H, Sui X, Yin H, Yu H, Gu Y, Chen S, et al. Total-body PET/
PET/CT. Ann Nucl Med. 2021. https://doi.org/10.1007/s12149- CT using half-dose FDG and compared with conventional PET/CT
021-01588-6. using full-dose FDG in lung cancer. Eur J Nucl Med Mol Imaging.
9. Alberts I, Hünermund J-N, Sachpekidis C, Mingels C, Fech V, 2020. https://doi.org/10.1007/s00259-020-05091-4.
Bohn K-P, et al. The influence of digital PET/CT on diagnostic 22. Liu G, Hu P, Yu H, Tan H, Zhang Y, Yin H, et al. Ultra-low-activity
certainty and interrater reliability in 68Ga-PSMA-11 PET/CT for total-body dynamic PET imaging allows equal performance to full-
recurrent prostate cancer. Eur Radiol. 2021; (in press). activity PET imaging for investigating kinetic metrics of 18F-FDG
10. Cherry SR, Jones T, Karp JS, Qi J, Moses WW, Badawi RD. Total- in healthy volunteers. Eur J Nucl Med Mol Imaging. 2021. https://
Body PET: Maximizing sensitivity to create new opportunities for doi.org/10.1007/s00259-020-05173-3.
clinical research and patient care. J Nucl Med. 2018;59:3–12. 23. Rausch I, Cal-González J, Dapra D, Gallowitsch HJ, Lind P, Beyer
https://doi.org/10.2967/jnumed.116.184028. T, et al. Performance evaluation of the Biograph mCT Flow PET/
11. Badawi RD, Shi H, Hu P, Chen S, Xu T, Price PM, et al. First CT system according to the NEMA NU2-2012 standard. EJNMMI
human imaging studies with the EXPLORER total-body PET scan- Phys. 2015;2:26. https://doi.org/10.1186/s40658-015-0132-1.
ner. J Nucl Med. 2019;60:299–303. https://doi.org/10.2967/ 24. van Sluis J, Boellaard R, Dierckx R, Stormezand GN, Glaudemans
jnumed.119.226498. A, Noordzij W. Image quality and activity optimization in oncolog-
12. Spencer BA, Berg E, Schmall JP, Omidvari N, Leung EK, ic (18)F-FDG PET using the digital Biograph Vision PET/CT sys-
Abdelhafez YG, et al. Performance evaluation of the tem. J Nucl Med. 2020;61:764–71. https://doi.org/10.2967/jnumed.
uEXPLORER Total-body PET/CT scanner based on NEMA NU 119.234351.
2-2018 with additional tests to characterize long axial field-of-view
25. McCready VR, Dizdarevic S, Beyer T. Lesion detection and ad-
PET scanners. J Nucl Med. 2020:jnumed.120.250597. https://doi.
ministered activity. J Nucl Med. 2020. https://doi.org/10.2967/
org/10.2967/jnumed.120.250597.
jnumed.120.244020.
13. Siegel S, Aykac M, Bal H, Bendriem B, Bharkhada D, Cabello J,
26. Koopman D, van Osch JA, Jager PL, Tenbergen CJ, Knollema S,
et al. Preliminary performance of a prototype, one-meter long PET
Slump CH, et al. Technical note: how to determine the FDG activity
tomograph. Boston: IEEE NSS-MIC; 2020.
for tumour PET imaging that satisfies European guidelines.
14. Lee H, Paeng JC, Hong SH, Yoo HJ, Cheon GJ, Lee DS, et al.
EJNMMI Phys. 2016;3:22. https://doi.org/10.1186/s40658-016-
Appropriate margin thresholds for isocontour metabolic volumetry
0158-z.
of fluorine-18 fluorodeoxyglucose PET in sarcoma: a hybrid PET/
27. Kunnen B, Beijst C, Lam MGEH, Viergever MA, de Jong HWAM.
MRI study. Nucl Med Commun. 2016;37:1088–94. https://doi.org/
Comparison of the Biograph Vision and Biograph mCT for quan-
10.1097/MNM.0000000000000561.
titative 90Y PET/CT imaging for radioembolisation. EJNMMI
15. Sher A, Lacoeuille F, Fosse P, Vervueren L, Cahouet-Vannier A,
Phys. 2020;7:14. https://doi.org/10.1186/s40658-020-0283-6.
Dabli D, et al. For avid glucose tumors, the SUV peak is the most
reliable parameter for [(18)F]FDG-PET/CT quantification, regard- 28. Reddin JS, Scheuermann JS, Bharkhada D, Smith AM, Casey ME,
less of acquisition time. EJNMMI Res. 2016;6:21. https://doi.org/ Conti M, et al. Performance evaluation of the SiPM-based Siemens
10.1186/s13550-016-0177-8. Biograph Vision PET/CT System. 2018 IEEE Nuclear Science
16. Prenosil GA, Weitzel T, Furstner M, Hentschel M, Krause T, Symposium and Medical Imaging Conference Proceedings (NSS/
Cumming P, et al. Towards guidelines to harmonize textural fea- MIC); 2018. p. 1–5.
tures in PET: Haralick textural features vary with image noise, but 29. Meyer M, Allenbach G, Nicod Lalonde M, Schaefer N, Prior JO,
exposure-invariant domains enable comparable PET radiomics. Gnesin S. Increased (18)F-FDG signal recovery from small physi-
PLoS One. 2020;15:e0229560. https://doi.org/10.1371/journal. ological structures in digital PET/CT and application to the pituitary
pone.0229560. gland. Sci Rep. 2020;10:368. https://doi.org/10.1038/s41598-019-
17. Boellaard R, Delgado-Bolton R, Oyen WJG, Giammarile F, Tatsch 57313-x.
K, Eschner W, et al. FDG PET/CT: EANM procedure guidelines
for tumour imaging: version 2.0. Eur J Nucl Med Mol Imaging. Publisher’s note Springer Nature remains neutral with regard to jurisdic-
2015;42:328–54. https://doi.org/10.1007/s00259-014-2961-x. tional claims in published maps and institutional affiliations.You can also read