Quality Estimation of YouTube Video Service - NAGARAJESH GARAPATI
←
→
Page content transcription
If your browser does not render page correctly, please read the page content below
MEE10:11

            Quality Estimation of
           YouTube Video Service

             ME10:11

               NAGARAJESH GARAPATI

                  Karlskrona, February 2010
           Department of Telecommunication Systems
                    School of Engineering
               Blekinge Institute of Technology
                  371 79 Karlskrona, Sweden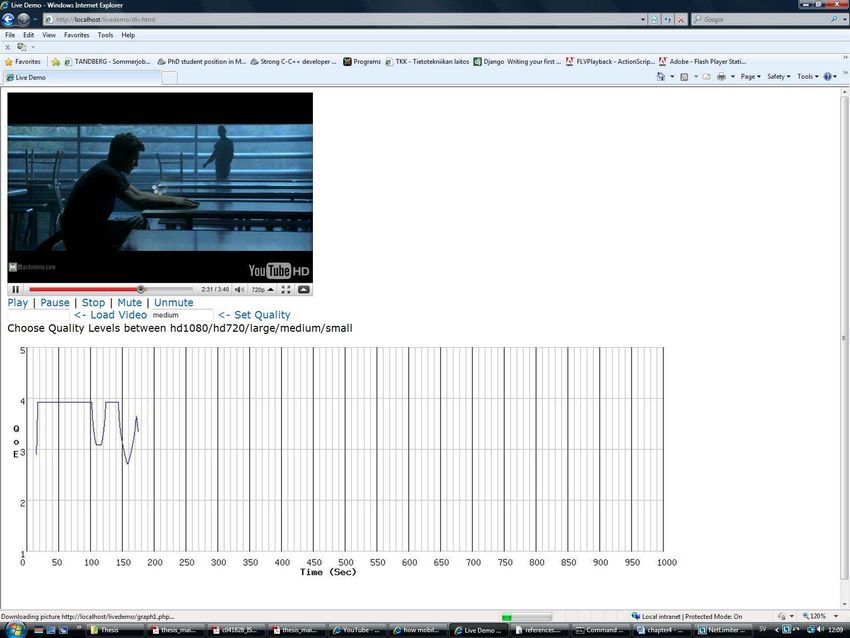
iii

                           Abstract
    YouTube is today one of the most popular video sharing web
sites. It is using Flash Player technology together with progressive
download to deliver videos in a variety of qualities adaptable to the
clients connection speed and requirements. Recently YouTube has
got much more user attention with the introduction of HD (High
Definition) video content on its web site. This work started with
analyzing different aspects of YouTube videos and finding a way to
detect re-buffering events during playback. In an effort to do this,
38 videos were uploaded to YouTube and analyzed with respect to
codec, container format, encoded bitrate and resolution. An applica-
tion called YouTube Player API was used to detect the re-buffering
events and some more useful information for the investigation. The
greater part of the work concentrated on estimating the effect of
re-buffering on the end user perceived quality of YouTube videos.
Finally, conclusions were made by presenting a way to estimate the
effect of re-buffering on the perceptual quality of YouTube videos and
stating that the maximum quality available on YouTube for HD-720P
and HD-1080P is approx 3.91 and 3.86 (on a scale from 1 to 5) re-
spectively.

Keywords
YouTube, QoE, PEVQ, YouTube API, Quality Degradation, Re-
buffering.
v
Acknowledgements
First I would like to express my sincere appreciation to
Mr. Andreas Ekeroth and Dr. Markus Fiedler, for giving me the
opportunity to be a part of this interesting research, and for their
valuable support and guidance throughout the thesis. My sincere
thanks to my family members for their love, unlimited support and
encouragement.
Nagarajesh Garapati
Karlskrona, February 2010Contents
Abstract iii
Acknowledgements v
1 Introduction 1
1.1 Related Work . . . . . . . . . . . . . . . . . . . . . . 2
1.2 Contribution . . . . . . . . . . . . . . . . . . . . . . . 3
1.3 Outline . . . . . . . . . . . . . . . . . . . . . . . . . . 4
2 Background 5
2.1 Flash Player . . . . . . . . . . . . . . . . . . . . . . . 5
2.1.1 Standard buffering . . . . . . . . . . . . . . . 6
2.1.2 Dual-threshold buffering . . . . . . . . . . . . 6
2.1.3 Buffering of H.264 encoded videos. . . . . . . 7
2.2 History of YouTube . . . . . . . . . . . . . . . . . . . 7
2.2.1 FLV file format . . . . . . . . . . . . . . . . . 8
2.2.2 MP4 file format . . . . . . . . . . . . . . . . . 9
2.3 Perceptual Estimation of Video Quality (PEVQ). . . 10
3 Approach 11
3.1 YouTube Player API . . . . . . . . . . . . . . . . . . 11
3.2 Traffic Sniffer . . . . . . . . . . . . . . . . . . . . . . 12
3.3 How to Use . . . . . . . . . . . . . . . . . . . . . . . 13
3.4 Model for Quality Estimation . . . . . . . . . . . . . 15
4 Results 19
4.1 YouTube Video Encoding . . . . . . . . . . . . . . . 19
4.2 Buffering Strategies of YouTube . . . . . . . . . . . . 20
4.3 QoE Estimation . . . . . . . . . . . . . . . . . . . . . 21
4.4 Real Time Quality Estimation . . . . . . . . . . . . . 23
5 Conclusions and Future Work 25
viiviii A Appendix 27 Bibliography 29
List of Figures

 2.1 Client-Server Communication of YouTube [1]. . . . .                           8
 2.2 FLV file format. . . . . . . . . . . . . . . . . . . . . .                    9
 2.3 Metadata tag of FLV file. . . . . . . . . . . . . . . .                       9

 3.1 HTML page. . . . . . . . . . . . . . . . . . . . . . . .                     12
 3.2 Estimation of maximum quality of YouTube videos. .                           17

 4.1   Video bitrate. . . . . . . . . . . . . . . .   .   .   .   .   .   .   .   20
 4.2   Buffering Strategies. . . . . . . . . . . .    .   .   .   .   .   .   .   21
 4.3   Maximum Quality of YouTube. . . . . .          .   .   .   .   .   .   .   22
 4.4   Quality degradation due to re-buffering.       .   .   .   .   .   .   .   23
 4.5   Real Time Quality Estimation. . . . . .        .   .   .   .   .   .   .   24

                                 ix
x
List of Tables

 2.1 Mandatory boxes in ISO base media file format [2]. .           10

 3.1 Video statistics. . . . . . . . . . . . . . . . . . . . . .    16

 4.1 Properties of YouTube videos. . . . . . . . . . . . . .        19
 4.2 Encoded bitrate of YouTube videos. . . . . . . . . . .         20
 4.3 Maximum Quality of YouTube videos. . . . . . . . .             22

 A.1 Units [2]. . . . . . . . . . . . . . . . . . . . . . . . . .   27

                                 xi
Chapter 1
Introduction
Flash Video is today one of the most widely used media file for-
mats on the internet. According to Adobe Systems, Flash Player is
installed on 99% of all internet-connected desktops [3]. It is also evi-
dent that the online video sharing websites have played a major role
in achieving this popularity. Online video sharing is one of the most
popular services on the internet. This service allows users to upload
their own videos to a service provider’s data base and make them
available to the rest of the world. Most of the video sharing service
providers uses progressive download together with the Adobe flash
player technology to serve their content. YouTube is one of the most
widely known video sharing websites. The concepts of unlimited stor-
age space, video blogging, measures taken for smooth video playback
etc. has turned it into a most popular and successful website.
YouTube started with serving videos in Flash Video (FLV) for-
mat. Now they have also introduced High Definition (HD) videos in
MP4 container format as Adobe added support to handle MPEG-4
file types. At this point in time YouTube has got much more atten-
tion from the users who are exhausted with low quality videos. As
YouTube is very popular, millions of people are using this service
every day. But still there are many people who cannot experience
smooth video playback due to bad network connectivity.
All these aspects make it very important to have a look at the
end users’ perception of YouTube videos. This thesis is concentrated
on the estimation of end users’ perceived video quality for YouTube
videos. This work is quite useful for a service provider to estimate
the end - users’ experience with their network connection. So that,
they can make some improvements, and avoid the risk of revenue
loss as clients migrate to other service providers that can fulfill their
1Chapter 1. Introduction
requirement.
The main aim of this work is to estimate the end user’s percep-
tional quality with respect to the encoded bitrates and re-buffering
events. In the rest of the document the word encoded bitrate indi-
cates the bitrate at which the video has been encoded and re-buffering
is a buffering event occurred playback due to a buffer under run.
1.1 Related Work
A lot of research work has been done on how different parameters
affect the perceptional video quality. This section discusses some
interesting research regarding video quality estimations.
In [4], the authors introduced a set of application level metrics to
measure objective video streaming quality. They have used Windows
Media Player (WMP) to derive these metrics. They have conducted
a number of experiments by simulating the network with a network
emulator called NISNET. Packet loss of 1% to 15% together with
the round trip delay of 0 to 200 ms was used to disturb the network.
After the analysis the authors made a conclusion that WMP manage
to adopt for the packet loss of up to 10% together with up to 200 ms
of delay.
An interesting work has been done in the paper [5]. This work
mainly focused on analysis of affect of jitter on Internet video quality.
To do this, authors conducted subjective tests where user were asked
to give the rating with values ranging from 1 to 1000, indicating 1
as worst and 1000 as best. For the experiments they have used 5
different videos with a verity of content. Each video is of approxi-
mately 60 s duration, 320 × 240 resolution, 30 frames per second and
encoded with MPEG-1. After the detailed analysis of collected data,
they have concluded that there is more than 50% quality degradation
with the low levels of jitter and packet loss.
Reference [6] is about estimation of video quality for internet
streaming applications. In an effort to do this, they have carried out
a number of subjective tests based on typical video content, bitrates,
codecs and network conditions. After that, a real time non-reference
quality metric called Stream PQoS has been proposed.
In [7], authors tried to address the problem of adopting video
quality in terms of video encoding parameters and user perceived
quality for streaming video over IP network. They have proposed an
Optimal Adoption Trajectory with the set of possible encoding exists
21.2. Contribution
to achieve bitrates required for network adaptation with good user
perceived quality.
In [8], a parametric no-reference objective opinion model has been
proposed to estimate the multimedia quality in mobile networks.
Quality degradations due to buffering events, packet loss rate and
codec bitrate have been taken into account for the quality estima-
tions. Then the conclusions were made by stating that a 10 s re-
buffering duration can reduce the quality with more than 1 MOS
unit and the packet loss of 4% can reduce the quality with 1.5 MOS
units for a 256 kbps video stream.
In 3GPP specifications for Packet-switched Streaming (PSS) and
Multimedia Broadcast/Multicast Service (MBMS), there is a way to
estimate QoE at the clients’ terminal and send reports back to the
server. Both technologies support QoE estimations based on session
level metrics such as initial buffering, re-buffering etc. and media
level metrics like, packet loss, jitter, frame rate deviation etc. In case
of PSS, the quality metrics are sent back to the server periodically
after specified number of seconds. But in case of MBMS, metrics will
be sent back after the end of a streaming session [9, 10].
While coming to Multimedia Telephony Service for IMS (MTSI),
the QoE metrics feature supports the reporting of valid metrics for
speech, video and text media. The MTSI client could send Quality
metrics report to a QoE server during the session and at the end of
the session [11].
In this thesis, video quality estimation is based on the model
implemented in [8]. There is a possibility of estimating the perceptual
quality of YouTube videos at the client end by combining the ways
discussed in this paper and the QoE features of 3GPP specifications.
1.2 Contribution
This work started with the implementation of a tool to collect re-
quired information from the videos, while playback. Re-buffering
events, video properties and the rate at which the video was being
downloaded into the browsers cache were calculated with the help
of collected data. After all, this thesis mainly concentrated on es-
timating the quality degradation of YouTube videos with respect to
re-buffering events.
3Chapter 1. Introduction
1.3 Outline
The outline of this document is as follows: Chapter 2 gives a short
introduction to Flash Player, YouTube and PEVQ. Chapter 3 dis-
cusses implemented tools followed by results and analysis in Chapter
4. Conclusions and Future work are discussed in Chapter 5.
4Chapter 2
Background
Before going in-depth into the work, one should get a basic under-
standing about how Flash Player works, what is YouTube, structure
of YouTube file formats and estimation of user perceived quality.
This chapter gives the overview of all these aspects.
2.1 Flash Player
Adobe Flash Player is a lightweight media player to view animations
and videos. It can be installed as a plug-in into any web browser and
play all supported video formats. The recent release of Adobe Flash
Player (Version: 10.0.42.34) is compatible with all popular Operating
Systems and Web Browsers. Flash player has started its journey
with the support for playing simple vectors and motion. Today it
has got support to handle many types of video and audio container
formats including FLV, F4V and MP4. Video sharing web sites like
‘YouTube’, ‘Google Video’ and ‘My Space’ are using Flash Player
technology to deliver their content.
Flash player supports two different video delivery mechanisms,
namely, Streaming and Progressive Download. Video streaming is
possible with a server running Flash Media Server (FMS) software
package. FMS starts Video delivery by opening a persistent connec-
tion between the client and server then sends the data over Real-
Time Messaging Protocol (RTMP). It doesn’t allow video files to
download to browsers cache. Instead, it buffers to a secure memory
of flash player where the processed video bits are discarded time to
time making room for the next series of bits. So, there is a very low
risk that content is stolen [12].
5Chapter 2. Background
In case of progressive download there is no need of a FMS. Video
content can be delivered over HTTP or RTMP from any standard
web server. It works exactly like file download. The video content
starts downloading to the client’s machine, and then the Flash Player
starts playback as soon as it gets the first video frame into the buffer.
The lack of security of video content is the main disadvantage with
progressive download [12].
While distributing the video content, a variety of functions can
be called on the flash player to control the external playback of the
video and to customize the player. One of the important controls
of that kind is to set buffer size. There is a possibility to specify
the number of seconds to buffer in memory before starting the play-
back. Buffer size can also be reset to a higher value during playback
[13]. Service providers use different buffering strategies to provide
a smooth playback experience to the client. Following are the three
different buffering strategies which are widely in use:
1. Standard video buffering.
2. Dual-threshold buffering.
3. Buffering of H.264 encoded video.
2.1.1 Standard buffering
It is the basic buffering principle that Adobe Flash Player 9 supports.
Flash Player receives a stream and stags the data into the buffer until
the predefined buffer length is reached. Once it is done, the movie
starts playing and Flash Player tries to keep the buffer full up to
the chosen length, receiving only sufficient amount of data from the
server. In this scenario video playback starts very quickly, but this
strategy could not overcome the effect of buffer under-run due to
the fluctuations in bandwidth. This issue has been resolved with the
concept of Dual-threshold buffering strategy [14].
2.1.2 Dual-threshold buffering
The main aim of this technique is to combine the advantages of quick
initial playback and stabilizing the effects of buffer underflow. Dual
threshold buffering works with setting up two different initial buffer-
ing limits. Flash Player will start playing the video as soon as it has
receives minimum number of bytes to fill up the first buffer limit.
62.2. History of YouTube
Then the second higher limit will be set and fills up very fast. Once
it happens Flash Player only receives the data necessary to maintain
the buffer to chosen length. By conception of two different buffer
lengths, this strategy is very useful for quick video playback together
with the efficient compensation of bandwidth fluctuations [14].
2.1.3 Buffering of H.264 encoded videos.
The buffering of H.264 encoded videos is much more complex than the
normal FLV video buffering because of the complexity in the encod-
ing mechanism. H.264 uses various encoding methods and strategies.
In H.264 encoded video, video frames can have multiple references
in past and future. So, it might be required to load several frames
before starting the playback. This means that the videos encoded
with H.264 usually requires a deeper buffer. Because of this service
providers are not encouraged to restrict the buffering of H.264 en-
coded videos. They might not be able to see the expected behavior
of Flash Player, if there are any buffering limits.
Flash Player does not restrict the buffering of H.264 encoded
videos and it does not strictly follow the user specified initial buffer
length [14].
2.2 History of YouTube
YouTube is a video sharing web site where users can upload their
own videos and make them available to the rest of the world. Users
can also search for the videos and watch them on their computers or
mobile devices. This web site was launched in 2005 and acquired by
Google Inc. in November 2006. YouTube uses Flash Player Technol-
ogy together with progressive download to deliver its content.
In the beginning, YouTube only offered videos in one quality with
the resolution of 320 × 240 pixels. As time goes by it has started
providing videos in different formats with much better resolution.
YouTube takes a copy of the originally uploaded video and generates
five different qualities of the same video. It is true only when the up-
loaded video is encoded with maximum resolution (≥ 1920 × 1080)
and bitrate (≥ 3 Mbps). Otherwise YouTube only generates the
achievable qualities with the uploaded video. The main reason be-
hind creating the same video with different qualities is to serve their
clients with different bandwidths. But, YouTube does not do any
7Chapter 2. Background
bandwidth detection clients have to switch between different qualities
as they needed. YouTube also generates two lower quality (176×144)
videos for the purpose of mobile applications. More discussions on
YouTube’s video resolutions and bitrates can be found in chapter 3.
Figure 2.1 shows the basic Client-Server communication of YouTube.
When the clients play button is pressed, an HTTP GET message with
a unique video identifier is sent from the client to the YouTube’s web
server. In response to the GET message YouTube sends a HTTP
Redirect message that can redirect the client to a Content Distri-
bution Network (CDN) server of YouTube, that’s where the original
video file has been stored. Then the CDN server sends the video file
content over TCP in a single HTTP 200 OK message [1].
Figure 2.1: Client-Server Communication of YouTube [1].
One of the most important things to know about YouTube is its
file formats. YouTube uses FLV and MP4 container formats. In this
work, metadata information is extracted from these file headers for
the analysis purpose. It is necessary to know about these file formats
to understand how to extract metadata information.
2.2.1 FLV file format
The block diagram in the Figure 2.2 represents the file format of FLV,
it comprises of a header and three different tags namely, Audio tag,
video tag and data tag. Each tag in FLV constitutes of a single stream
and there cannot be more than one video and audio stream in a single
file. FLV header contains information about the file signature (FLV
by default), file version, tags presented and the length of the header.
82.2. History of YouTube
Audio and video tags contain audio and video streams respectively.
Data tag contains metadata information of the file, this tag should
be kept at the start of the file to initiate the playback before the
download completes. This metadata tag contains the information
about start time of the video, width and height, bitrate, frame rate
and the size of the file in bytes. FLV file stores all this information
as multi byte integers in big-endian byte order [15].
Figure 2.2: FLV file format.
Figure 2.3: Metadata tag of FLV file.
2.2.2 MP4 file format
MP4 file structure is much more complex than FLV, and it is an ISO
Based Media File Format. In this format media file contains audio
and video tracks together with a metadata header. This metadata
header constitutes of several object-oriented building blocks called
boxes. Each box is defined by unique type identifier and length.
These boxes contain the information about metadata and actual me-
dia data for a presentation. Table 2.1 gives the information about
the boxes from which the metadata information has been extracted
[2].
Useful metadata information for the analysis is extracted and
decoded to human readable form from the metadata headers of FLV
and MP4 files.
9Chapter 2. Background
Box Type Contents
pdin ‘progressive download information’.
moov ‘Container for all the metadata’.
vmhd ‘video media header, overall information
(video track only)’.
stbl ‘sample table box, contains all the time and
data indexing of the media samples in a
track’.
stsz ‘This box contains the sample count and a
table giving the size in bytes of each sample’.
ctts ‘This box provides the offset between decod-
ing time and composition time’.
Table 2.1: Mandatory boxes in ISO base media file format [2].
2.3 Perceptual Estimation of Video Qual-
ity (PEVQ).
PEVQ is a standardized measurement algorithm to estimate the user
perceived quality of a video in terms of Mean Opinion Score (MOS).
MOS is a measure of end user’s experience, estimated by conducting
subjective tests where the subjects are asked to rate the quality of a
service. The perceptual quality of a video is nothing but a measure
of perceptional experience of the end user. PEVQ is trained with
subjective measurements of user experience and it has been proven
that the output is correlating well with subjective results [16, 17].
PEVQ takes a source video and a degraded video of the same
source as input and compares each frame in the degraded video with
the same frame in the source video, then estimates the quality in
terms of user experience with respect to different kinds of data loss.
It gives the output on scale from 1 to 5, where 1 is the lowest and 5
is the highest quality [16, 18].
PEVQ is not suggested to be use with the videos of less than 6 s
more than 20 s of duration [18]. In this work it has been used to
estimate the quality of HD 720P and HD 1080P videos downloaded
from YouTube. The duration of each video is approximately 14 s.
10Chapter 3
Approach
This chapter explains the implementation of a tool that has been used
to collect the necessary information for the analysis. An application
called YouTube Player API is used to implement this tool. It is
also possible to run this application together with a traffic sniffer to
extract metadata information from the video file headers. In this
work WinDump was used to collect the YouTube traffic.
3.1 YouTube Player API
YouTube Player API is an application available from YouTube. This
application is written in JavaScript and it can be used to control the
embedded YouTube video player. Clients should have Flash Player 8
or higher installed on their computers to get it working correctly. A
java script API called SWFObject is recommended to use for embed-
ding the YouTube player into a web page since it has an ability to
detect the version of the Flash Player. A JavaScript function called
onYouTubePlayerReady() must be implemented in the HTML page
that contains YouTube player. This function will be called once the
player is fully loaded and the API is ready [19, 20].
A reference object to the YouTube player must be crated by call-
ing the method getElementbyId() on the embed tag containing the
YouTube player. Once the object has been created, a variety of
JavaScript functions can be called on a YouTube player object to
play, pause, seek to certain time in the video, set volume and mute
the player [19].
This API can also be used to collect some useful information
required for the analysis like, events occurred during the playback,
11Chapter 3. Approach
number of bytes loaded into the buffer, total size of the video file,
total duration of the video and the video identifier (video ID)[19].
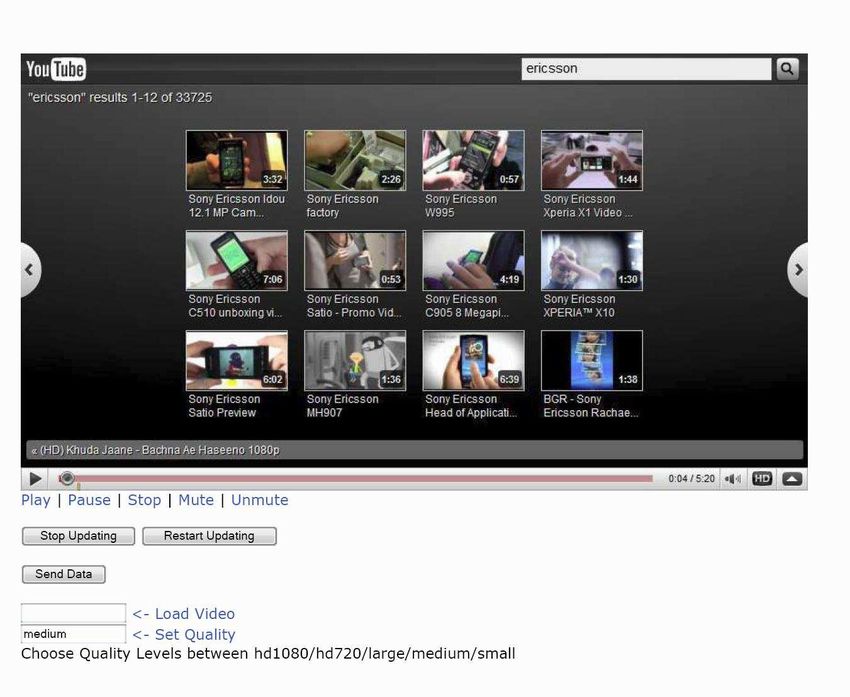
Figure 3.1 shows the HTML page designed by embedding the
YouTube video in it. This web page is accessed through the WAMP
server running locally on the computer [21]. Because, Adobe Flash
Player security restrictions limit an offline application to play only
offline media files. Similarly, an online application is limited to only
playing online media files [22]. Flash Player considers it as online
application when it is accessed through WAMP server. The usage of
this tool is discussed in section 3.3.
Figure 3.1: HTML page.
3.2 Traffic Sniffer
In this work the main purpose of the traffic sniffer is to collect the
data packets containing the metadata of the video files to detect the
parameters with which the videos have been encoded. A network
123.3. How to Use
analyzer called WinDump is used to collect the traffic and it is set
to start simultaneously with the HTML page and capture all TCP
data packets coming into the network while video playback [23].
3.3 How to Use
This tool can be used by running a simple Perl script from the com-
mand line, it runs the HTML page and the traffic sniffer together.
JavaScript starts collecting the information by calling functions on
YouTube object as soon as web page loads. Collected data can be
sent back to server and store in a text in a text file by hitting on the
‘Send Data’ button. The collected data contains the logs of differ-
ent events occurred during the playback and the bytes loaded into
the browsers cache with time. It is also possible to stop and restart
the JavaScript updating processes by clicking on the buttons ‘Stop
Updating’ and ‘Restart Updating’ respectively. New videos can be
loaded into the player by providing unique video ID and the play-
back quality can be changed by sending a request with the required
quality. If the video is not available in the specified quality, it plays
the next lowest quality video.
WinDump runs in the background while video playback and col-
lects all TCP packets coming on port 80. WinDump can be termi-
nated at any time by simply pressing Ctrl + C.
Meta data information and bitrate of all videos can be calculated
by running a simple Perl script called ‘process.pl’, after the collection
of all necessary data. process.pl reads the data from collected log files
to extract metadata information and to calculate bitrate. Here bi-
trate represents the bits loaded into the browser’s cache with respect
to time. This tool calculates bitrate in overlapped window fashion,
window length in milliseconds (¿=1000) should be passed as an ar-
gument from the command line. Programme calculates the bitrate
in specified window duration for every second starting from zero. It
generates the output files with time and number of bits loaded, where
time is the synchronized time of the first sample of the window and
bits loaded is the number of bits loaded in the corresponding window.
Synchronized time is calculated by using the following formula:
Tsync = ActualT ime − StartT ime
Where Tsync is the synchronized time, ActualTime is the JavaScript
time stamp corresponds to the sample and StartTime is the time
13Chapter 3. Approach
when the video has started.
‘process.pl’ identifies metadata packets from the collected video
traffic and extracts useful information from them. It can detect ‘on
MetaData’ tag in FLV and F4V file formats [15] and extracts follow-
ing information:
1. Start Time (s)
2. Total Duration (s)
3. Width of the video (Pixels)
4. Height of the video (Pixels)
5. Video Data Rate (bps)
6. Audio Data Rate (bps)
7. Total Data Rate (bps)
8. Frame Rate (fps)
9. Byte Length (Bytes)
10. Can Seek on Time (Yes/No)
Where Start Time is the time from which the video started play-
ing, Total Duration is the total duration of the video, Byte Length
is the total number of bytes in the video and Can seek on Time rep-
resents whether the video can be asked to jump to the specified time
or not.
While coming to MP4 file format, packets can be identified by
searching for the tags of different boxes in the MP4 file like ‘moov’,
‘stsz’, ‘stsd’ etc. The information gathered from the MP4 metadata
packets is as follows:
1. Total Duration (s)
2. Width of the video (Pixels)
3. Height of the video (Pixels)
4. Byte Length (Bytes)
5. Audio Sample Count
143.4. Model for Quality Estimation
6. Video Sample Count
7. Horizontal Resolution
8. Vertical Resolution
Audio sample count and Video sample count are the number of
samples in audio and video tracks respectively. From this information
total data rate of the video can be calculated by using the formula:
ContentLength
T otalDataRate =
Duration
As there is only one frame per sample in video track, frame rate
can be calculated as follows:
V ideoSampleCount
F rameRate =
Duration
3.4 Model for Quality Estimation
The affect of re-buffering events on YouTube video watching expe-
rience is calculated with a model derived by modifying an existing
model called MTQI (Mobile TV Quality Index). MTQI is a model
to predict the perceived video quality by taking quality degrada-
tions due to codec bitrate, packet loss and buffering into account.
This model is implemented based on the parametric objective-opinion
model discussed in [8]. Equation 3.1 shows the basic structure of the
model.
MOS = f(MOSBase, Initial Buff Deg, Rebuff Deg,
Packet Loss Deg) (3.1)
Where, ‘MOS’ stands for the Mean Opinion Score of the client,
‘MOSBase’ is the base quality for a given codec and bitrate, ‘Packet
Loss Deg’ is the quality degradation due to packet loss, ‘Initial Buff
Deg’ is the degradation due to initial-buffering and ‘Rebuff Deg’ is
the degradation due to re-buffering. This model was trained with
the results from a number of subjective tests, and it is also shown
that the model scores are closely corresponding to the subjective
results. These subjective tests are conducted with a combination of
affects due to different metrics such as codec, bitrate, packet loss,
15Chapter 3. Approach
Video Bitrate FPS Codec Container
HD 720P HD 1080P
Reference 15 Mbps 30 Mbps 25 H.264 MP4
Sample 2 Mbps 3 Mbps 25 H.264 MP4
Table 3.1: Video statistics.
buffering and other data losses. The model gives an output score
(MOS) between 1 and 5, where 5 is the best perceived quality.
As YouTube is using constant bitrate associated with each video
quality and sending the data over TCP. TCP compensates the packet
loss by maintaining a persistent connection between the client and the
server. So, there will not be any effect of packet loss on the quality of
the video. Instead, packet loss in TCP reduces the throughput of the
connection [24]. The resultant model excluding the effect of packet
loss and bitrate looks as follows:
MOS = f(MOSBase, Initial Buff Deg, Rebuff Deg) (3.2)
Estimation of Quality degradation due to re-buffering has been
started by estimating the MOSBase (maximum quality) of the YouTube
videos. This is done by conducting experiments with 38 short video
clips. The duration of each clip is around 14 s.
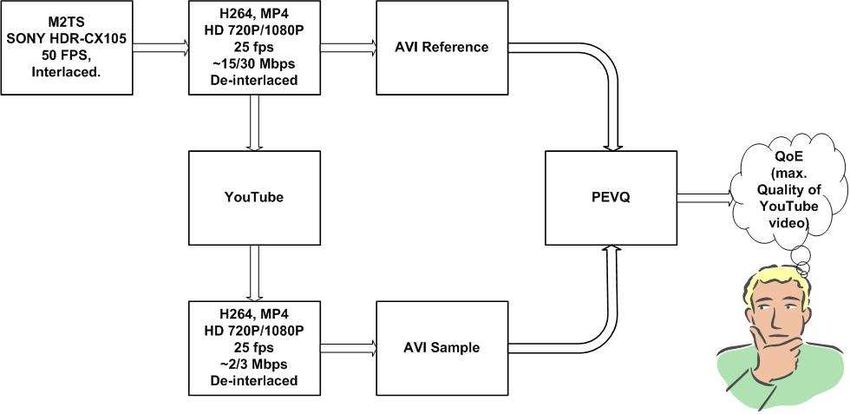
Figure 3.2 shows a block diagram of the procedure that is followed
to estimate the ‘MOSBase’ of YouTube videos. First the videos are
shot by using Sony HDR-CX105 video camera and then converted
to MP4 format with H.264 codec with a tool called FFMPEG [25].
Video shot with the handy cam are in the interlaced format with 50
FPS. Those videos were de-interlaced with 25 FPS while converting
to MP4. Videos have been encoded with 720P and 1080P resolution,
these videos are called reference videos. After that all reference videos
are uploaded to YouTube and then downloaded the YouTube encoded
MP4 files (sample videos) of both resolutions. Now both sample and
reference videos are converted to raw AVI format using FFMPEG
and used as input to PEVQ to estimate the quality of the sample
video. The statistics of sample and reference videos can be seen in
Table 3.1.
After the estimation of maximum quality available on YouTube,
quality degradation due to re-buffering is estimated by using the
model proposed in [8]. The final quality of the video together with the
163.4. Model for Quality Estimation
Figure 3.2: Estimation of maximum quality of YouTube videos.
buffering degradation is calculated by substituting Buffering Degra-
dation into Equation 3.2.
17Chapter 4
Results
4.1 YouTube Video Encoding
In Table 4.1 the resolution, container format and the codec infor-
mation used to encode different qualities of YouTube videos can be
seen. The resolution stated in the table is the maximum resolution
of YouTube videos. It can be lowered in some cases but never go
higher than the mentioned values, it always depends on the source
video provided by the client. YouTube is using H.264 codec to en-
code all qualities of videos except for small videos. They are using
FLV container format with small, medium and large videos and MP4
format with HD videos.
While coming to video bitrate, YouTube is using constant bitrate
associated with each video quality. The behavior of YouTube video
bitrate for all qualities can be seen in the Figure 4.1. From the figure
it is clear that the bitrates are not varying much, the average bitrates
and the standard deviation can be found in the table 4.2.
Since a constant bitrate is used with each video quality, the av-
erage bitrate is considered as the bitrate for a video with a specific
Quality Max. Resolution Codec Container
HD 1080P 1920 × 1080 H.264 MP4
HD 720P 1280 × 720 H.264 MP4
LARGE 854 × 480 H.264 FLV
MEDIUM 640 × 360 H.264 FLV
SMALL 400 × 226 - FLV
Table 4.1: Properties of YouTube videos.
19Chapter 4. Results
4
3.59
3.5
Mean
3
Bitrate (Mbps) 2.5
2.11
2
1.5 1.31
1
0.70
0.45
0.5
0
Small Medium Large HD 720P HD 1080P
Quality Levels
Figure 4.1: Video bitrate.
Quality Bitrate (Mbps)
- Mean Min Max Std
HD 1080P 3.5915 3.4362 3.7816 0.0791
HD 720P 2.1131 2.0425 2.3197 0.0515
Large 1.3140 1.1435 1.3334 0.0386
Medium 0.7064 0.5723 0.9071 0.0756
Small 0.4579 0.3376 0.8334 0.1322
Table 4.2: Encoded bitrate of YouTube videos.
quality.
4.2 Buffering Strategies of YouTube
YouTube is using two distinct buffering strategies to deliver FLV and
MP4 files. They are using the Dual-Threshold Buffering with FLV
files and H.264 encoded video buffering with MP4 files. The behavior
of these two buffering strategies can be clearly seen in the figure 4.2.
This plot is drawn between the time and number of bits loaded into
the buffer. Data in the plot was collected from a single video available
in all formats.
In case of figures 4.2-A, B and C video container format is FLV
and it has been delivered using the Dual-Threshold buffering strategy.
The sudden peak in the beginning of these plots represents a rapid
transfer of data at the beginning of the video and the small peaks
204.3. QoE Estimation
in the rest of the plot shows the behavior of sending small chunks
of data to keep the buffer full to the chosen length. Dual-threshold
buffering strategy is followed even though the ‘Medium’ and ‘large’
quality videos are encoded with H.264 as these files are relatively
smaller than the MP4 files and takes less time to download.
The last two plots in the figure (plot D and Plot E) represent the
behavior of Buffering of MP4 videos. In this scenario data transfer
is very rapid. There is no restriction on how many bytes to send.
YouTube is transferring these files as fast as they can. Since, the files
are big compared to other formats and these are encoded with H.264
codec. This behavior is very clear in the plots and the oscillations in
the data flow could be because of the bandwidth fluctuation or the
Flash Player’s buffer stacking mechanism. At low level, Flash Player
fills up the buffer by pushing sudden burst of frames [14].
A: Small
20
15
10
5
0
0 10 20 30 40 50 60 70 80
B: Medium
20
15
10
5
0
0 10 20 30 40 50 60 70 80
C: Large
Bitrate (Mbps)
20
15
10
5
0
0 10 20 30 40 50 60 70 80
D: HD 720P
20
15
10
5
0
0 10 20 30 40 50 60 70 80
E: HD 1080P
20
15
10
5
0
0 10 20 30 40 50 60 70 80
Time (s)
Figure 4.2: Buffering Strategies.
4.3 QoE Estimation
The maximum quality of YouTube videos have been calculated by
analyzing the results from 38 experiments. Figure 4.3 shows the MOS
values [16] for HD 720P and HD 1080P videos. Table 4.3 presents
the statistics very clearly.
The Mean Opinion Scores of the end users are estimated by using
the model in Equation 3.1. Figure 4.4 shows a plot between the time
and MOS. In the figure plot A shows the re-buffering events occurred
21Chapter 4. Results
5
Maximum
4.8
Minimum
4.6
4.4
4.3 4.3
PEVQ Score (QoE)
4.2
4
3.8
3.6 3.6
3.5
3.4
3.2
3
HD 720P HD 1080P
Quality
Figure 4.3: Maximum Quality of YouTube.
Quality MOS
- Mean Min Max Std
HD 720P 3.9141 3.4790 4.2920 0.1603
HD 1080P 3.8637 3.6240 4.2870 0.1487
Table 4.3: Maximum Quality of YouTube videos.
during the playback and plot B shows the quality degradation due
to the affect of re-buffering.
A 15 s window is used to estimate the QoE as PEVQ has a re-
striction on the videos with more than 15 s of duration. Plot A is
clearly showing the buffering events occurred during playback. Video
begun with a small amount of initial buffering and then it started to
play. But in plot B there is no data until 15 s because, the measuring
window size is 15 s and the tool does not estimate the QoE until it
has got 15 s of data to evaluate.
Plot B has started at lower MOS because of the effect of initial
buffering and then it suddenly jumped to the maximum quality in
the play period. The quality curve is coming down as soon as there is
another buffering event. There are some oscillations in the plot since
there are lots of buffering events with different durations. There is
another large play event after 100 s and the quality curve gradually
rises to the maximum level. So, from the plot it is clear that the re-
buffering duration has considerable impact on the QoE of the service.
224.4. Real Time Quality Estimation
A
Buffering
Playing
0 50 100 150 200 250 300
B
4
3.5
QoE (MOS)
3
2.5
2
0 50 100 150 200 250 300
Time (s)
Figure 4.4: Quality degradation due to re-buffering.
4.4 Real Time Quality Estimation
A real time quality estimation tool is implemented based on the qual-
ity estimation model. Figure 4.5 shows the real time tool, where
videos can be watched in different qualities and at the same time the
real time quality degradation plot can be seen. This plot is drawn
between the estimated MOS and the time.
23Chapter 4. Results
Figure 4.5: Real Time Quality Estimation.
24Chapter 5
Conclusions and Future
Work
As internet video sharing has got much popularity and a significant
share in every day internet traffic it is very important to measure
the end users’ video perceptual experience with respect to different
network parameters. This thesis has analyzed some of the impor-
tant parameters of YouTube videos and estimated the impact of re-
buffering on end user’s Quality of Experience. In effort to do this, a
tool has been implemented to collect the information necessary to an-
alyze YouTube videos and some more useful information is collected
from the metadata headers of YouTube’s FLV and MP4 videos.
For the analysis we have conducted objective tests using 38 short
video clips. The videos were shot by Sony HDR-CX105 video camera,
and each video is approximately 14 s in duration. All these videos
are then converted to H.264 encoded MP4 format by using FFMPEG
and uploaded to YouTube. Then the maximum quality of YouTube
videos have been estimated by using PEVQ and the different encoded
parameters are investigated with the help of collected information.
YouTube is using constant bitrate associated with each quality. The
average bitrate for HD 720P and HD 1080P videos are 2.11 and
3.59 respectively and the maximum resolutions are 1920 × 1080 and
1280 × 720. They are using H.264 codec to generate all qualities of
the video except for small quality.
The maximum quality of YouTube videos are 3.91 and 3.86 for
HD 720P and HD 1080P videos respectively. Quality degradation
due to re-buffering duration is estimated by using an existing model
called MTQI. Since, YouTube is maintaining fixed bitrate coupled
with each quality and there is no effect of packet loss on YouTube
25Chapter 5. Conclusions and Future Work
videos the packet loss and bitrate coefficients are taken away from
the model.
Then the quality degradation due to re-buffering is estimating in
real time by detecting the buffering events during playback and send-
ing that information back to the server.
Future work
While coming to Future work, this approach is quite useful to
estimate the perceptual quality of end user in the client terminal
during video playback. Only Small effort is required to implement
the same functionality in the flash plug-in.
It is also possible to send the quality reports back to the network
operators from mobile clients such as the iphone with YouTube client.
In the mobile application scenario, it is also interesting to combine
the measurements with location using cell ID or GPS.
It is also interesting to see how well these results associate with
subjective test results.
26Appendix A
Appendix
The units used in this document are shown in the Table A.1.
FFMPEG commands
The following ffmpeg commands are used to convert videos from
one format to the other.
Converting m2ts files to avi files:
bellow command generates a de-interlaced avi video with 25 fps
from an interlaced m2ts video file in both HD1080 and HD720 for-
mats respectively.
ffmpeg -r 25 -s 1920x1080 -i input.m2ts -vcodec mpeg4 -sameq -
acodec copy -deinterlace -aspect 16:9 -s hd1080 output.avi
ffmpeg -r 25 -s 1280x720 -i input.m2ts -vcodec mpeg4 -sameq -
Unit Discription
s Seconds
ms Milliseconds
fps Frames per second
MOS Mean Opinion Score on scale from 1 to 5
bps Bits per second
Mbps Mega bits per second
Table A.1: Units [2].
27Chapter A. Appendix
acodec copy -deinterlace -aspect 16:9 -s hd720 output.avi
Converting avi files to mp4 files:
ffmpeg -i input.avi -y -vcodec libx264 -f mp4 -g 50 -vb 30M -qmax
51 -r 25 output.mp4
Converting mp4 files to raw avi files:
The commands used to convert mp4 files to raw avi files are as
follows:
ffmpeg.exe -i input.mp4 -f rawvideo output.yuv
ffmpeg.exe -s 1920x1080 -r 25 -i input.yuv -vcodec copy -y out-
put.avi
Quality estimation with PEVQ:
The following command is used to compare the reference and sample
videos.
PEVQOem.exe -Ref ReferenceVideo.avi -Test TestVideo.avi -Out
pevq result.txt
28Bibliography
[1] Michael Zink, Kyoungwon Suh, Yu Gu, and Jim Kurose. Charac-
teristics of YouTube network traffic at a campus network - Mea-
surements, models, and implications. Comput. Netw., 53(4):501–
514, 2009.
[2] ISO/IEC 14496-12. Information technology–Coding of audio-
visual objects–Part 12: ISO base media file format. Technical
report, October 2005.
[3] Millward Brown survey. Flash content reaches 99% of internet
viewers [online, Verified January 2010]. Available from: http:
//www.adobe.com/products/player_census/flashplayer.
[4] Zhiheng Wang, Sujata Banerjee, and Sugih Jamin. Studying
streaming video quality: from an application point of view. In
MULTIMEDIA ’03: Proceedings of the eleventh ACM interna-
tional conference on Multimedia, pages 327–330, New York, NY,
USA, 2003. ACM.
[5] Mark Claypool, Mark Claypool, Jonathan Tanner, and
Jonathan Tanner. The Effects of Jitter on the Perceptual Quality
of Video. In In Proceedings of the ACM Multimedia Conference,
pages 115–118, 1999.
[6] Stefan Winkler and Ruth Campos. Video quality evaluation for
internet streaming applications. In Proc. IS &T/SPIE Electronic
Imaging 2003: Human Vision and Electronic Imaging VIII, vol-
ume 5007, pages 104–115, 2003.
[7] Nicola Cranley, Philip Perry, and Liam Murphy. User percep-
tion of adapting video quality. Int. J. Hum.-Comput. Stud.,
64(8):637–647, 2006.
29BIBLIOGRAPHY
[8] Jörgen Gustafsson, Gunnar Heikkila, and Martin Pettersson.
Measuring multimedia quality in mobile networks with an ob-
jective parametric model. In ICIP, pages 405–408, 2008.
[9] Frederic GABIN. 3GPP TS 26.234 V9.1.0. Technical Re-
port Protocols and Codes (R 9), December 2009. Available
from: http://www.3gpp.org/ftp/Specs/html-info/26234.
htm [Verified January 2010].
[10] Igor CURCIO. 3GPP TS 26.346 V9.1.0. Technical Report Pro-
tocols and Codes (R 9), December 2009. Available from: http:
//www.3gpp.org/ftp//Specs/html-info/26346.htm [Verified
January 2010].
[11] Per FRJDH. 3GPP TS 26.114 V9.1.0. Technical Report Me-
dia handling and interaction (R 9), December 2009. Available
from: http://www.3gpp.org/ftp//Specs/html-info/26914.
htm [Verified January 2010].
[12] Video Learning Guide for Flash: Progressive and Stream-
ing Video [online, Verified January 2010]. Available from:
http://www.adobe.com/devnet/flash/learning_guide/
video/part02.html.
[13] ActionScript 3.0 Language and Components Reference:
FLVPlayback [online, Verified January 2010]. Avail-
able from: http://www.adobe.com/livedocs/flash/9.
0/ActionScriptLangRefV3/fl/video/FLVPlayback.html\
#bitrate. It is the documentation of an ActionScript package,
called fl.video.
[14] Fabio Sonnati. New buffering strategies in Flash Player 9 and
Flash Media Server 3 [online, Verified January 2010]. Available
from: http://www.adobe.com/devnet/flashmediaserver/
articles/fms_buffering_strategies.html.
[15] Adobe Systems Inc. Video File Format Specification Version
10. Technical Report CESNET Technical Report 18/2004,
November 2008. Available from: http://www.adobe.com/
devnet/flv/pdf/video_file_format_spec_v10.pdf [Verified
Januaryr 2010].
30BIBLIOGRAPHY
[16] OPTICOM GmbH. PEVQ Advanced Perceptual Evaluation of
Video Quality [online, Verified January 2010]. Available from:
http://www.opticom.de/download/PEVQ-WP-v07-A4.pdf.
[17] Matthias Malkowski and Daniel Claßen. Performance of Video
Telephony Services in UMTS using Live Measurements and Net-
work Emulation. Wirel. Pers. Commun., 46(1):19–32, 2008.
[18] OPTICOM GmbH. PEVQ - Perceptual Evaluation of Video
Quality [online, Verified January 2010]. Available from: http://
www.opticom.de/download/SpecSheet_PEVQ_08-03-13.pdf.
[19] YouTube JavaScript Player API Reference [online, Verified Jan-
uary 2010]. Available from: http://code.google.com/apis/
youtube/js_api_reference.html.
[20] TenSafeFrogs bobbyvandersluis. swfobject [online, Verified Jan-
uary 2010]. Available from: http://code.google.com/p/
swfobject.
[21] Wamp Server: Presentation [online, Verified January
2010]. Available from: http://www.wampserver.com/en/
presentation.php.
[22] WHITE PAPER: Adobe Flash Player 9 Security Flash
Player 9,0,124,0 [online, Verified January 2010]. Avail-
able from: http://www.adobe.com/devnet/flashplayer/
articles/flash_player_9_security.pdf.
[23] WinDump documentation [online, Verified January 2010].
Available from: http://www.mirrorservice.org/sites/ftp.
wiretapped.net/pub/security/packet-capture/winpcap/
windump/docs/default.htm.
[24] Markus Fiedler Junaid Shaikh and Denis Collange. Quality
of Experience from user and network perspectives. Annals of
Telecommunications, 65(1–2):47–57, 2010.
[25] FFmpeg Documentation [online, Verified January 2010]. Avail-
able from: http://ffmpeg.org/ffmpeg-doc.html.
31You can also read