Integrating epidemiological and genetic data with different sampling intensities into a dynamic model of respiratory syncytial virus transmission ...
←
→
Page content transcription
If your browser does not render page correctly, please read the page content below
www.nature.com/scientificreports
OPEN Integrating epidemiological
and genetic data with different
sampling intensities into a dynamic
model of respiratory syncytial virus
transmission
Ivy K. Kombe1*, Charles N. Agoti1, Patrick K. Munywoki1, Marc Baguelin3,
D. James Nokes1,4 & Graham F. Medley2
Respiratory syncytial virus (RSV) is responsible for a significant burden of severe acute lower
respiratory tract illness in children under 5 years old; particularly infants. Prior to rolling out any
vaccination program, identification of the source of infant infections could further guide vaccination
strategies. We extended a dynamic model calibrated at the individual host level initially fit to social-
temporal data on shedding patterns to include whole genome sequencing data available at a lower
sampling intensity. The study population was 493 individuals (55 aged < 1 year) distributed across
47 households, observed through one RSV season in coastal Kenya. We found that 58/97 (60%) of
RSV-A and 65/125 (52%) of RSV-B cases arose from infection probably occurring within the household.
Nineteen (45%) infant infections appeared to be the result of infection by other household members,
of which 13 (68%) were a result of transmission from a household co-occupant aged between 2 and
13 years. The applicability of genomic data in studies of transmission dynamics is highly context
specific; influenced by the question, data collection protocols and pathogen under investigation. The
results further highlight the importance of pre-school and school-aged children in RSV transmission,
particularly the role they play in directly infecting the household infant. These age groups are a
potential RSV vaccination target group.
In 2015 the estimated respiratory syncytial virus (RSV) acute lower respiratory illness (ALRI) burden in chil-
dren less than 5 years old was 33.1 million cases resulting in 118,200 (94,600–149,400) deaths. Over 90% of
the estimated RSV burden was in developing c ountries1. A recent study across sites in 7 low-income and low-
middle-income countries looking into the aetiology of severe and very severe pneumonia found that RSV is the
single pathogen with the largest attributable fraction2. Infants below 6 months of age experience the most severe
disease3. There are currently over 50 candidate vaccines against RSV at different stages of development with the
most advanced being a maternal vaccine4–6.
RSV disease occurs in a seasonal pattern with most populations experiencing annual cycles7–11. The virus can
be classified into two antigenically and genetically distinct groups (RSV-A and RSV-B) and consecutive seasons
are not only characterized by a change in the dominant group, but also changes to the genotype composition
within groups11,12. Though several studies have predicted maternal vaccination would be e ffective13–15, by extend-
ing the duration of protection by passive immunity early in life, the vaccination of older children has also been
theorized as an effective alternative or complementary strategy by producing a herd immunity e ffect16–19. Elder
and, particularly, school-going children have been shown in previous work to be associated with increased risk
of infant (sibling) i nfection20–23—though no direct infection link between the older siblings and the infant was
1
KEMRI‑Wellcome Trust Research Programme, KEMRI Centre for Geographical Medical Research-Coast,
P.O. Box 230‑80108, Kilifi, Kenya. 2Centre for Mathematical Modelling of Infectious Disease and Department
of Global Health and Development, London School of Hygiene and Tropical Medicine, London WC1H 9SH,
UK. 3Centre for Mathematical Modelling of Infectious Disease and Department of Infectious Disease Epidemiology,
London School of Hygiene and Tropical Medicine, London WC1H 9SH, UK. 4School of Life Sciences and Zeeman
Institute for Systems Biology and Infectious Disease Epidemiology Research (SBIDER), University of Warwick,
Coventry CV4 7AL, UK. *email: ivkadzo@gmail.com
Scientific Reports | (2021) 11:1463 | https://doi.org/10.1038/s41598-021-81078-x 1
Vol.:(0123456789)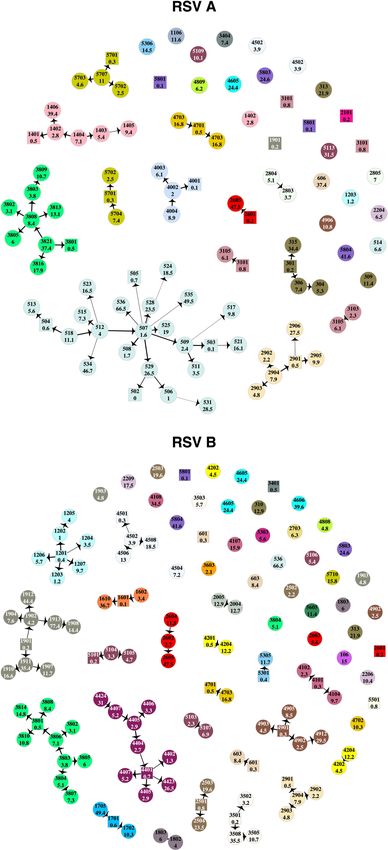
www.nature.com/scientificreports/
Figure 1. Shedding patterns for RSV-A, panel (a), and RSV-B, panel (b). Each notch on the y-axis represents
a single individual and the horizontal grey lines separate the individuals into households, time in days is on the
x-axis. The shaded regions show RSV shedding episode colour-coded by genetic cluster where grey represents
episodes whose cluster id is unknown. This figure was generated using R programming language version 4.0.346.
confirmed—and have been identified as drivers of the initial epidemic p hase24. Identifying the role of different age
and social groups in RSV transmission networks may provide further evidence for optimal vaccine target groups.
Previously, using data from a cohort study that followed household members for 6 months, we have attempted
to identify the source of infant infection in the household. In a descriptive analysis of the social-temporal data,
school-going siblings were frequently (73%) identified as index cases in household outbreaks where an infant
was infected23. In a phylogenetic analysis of whole genome sequence (WGS) data from a subset of the household
data, the household source of infant infection was definitively identified for just 4 of the 23 infant cases in the
subset data, while 9 others were identified as index cases in household outbreaks25. An attempt to use shared
minor variants obtained from deep sequencing failed to add further resolution to the transmission chains26. In
a modelling study using only the social-temporal data, it was found that about half of all cases occurred through
within household t ransmission27. Independently, these studies were unable to clearly determine who infected
the infants with RSV and how infection spread once introduced in the household.
In this paper, we extend a previous modelling study27 to integrate social-temporal and WGS data to identify
generalizable characteristics of RSV transmission chains at the household level. In doing so, we identify if data
integration, and hence increased pathogen resolution, increases the precision with which model parameters are
estimated or changes the estimates such that different transmission dynamics are inferred. To our knowledge,
this is the first attempt at combining these two data types in a single modelling framework for RSV. There are
several approaches to integrating genetic data with other data t ypes28–30, the choice of which is dependent on
the data available and the aims of the study31. Similar to the approach used by Didelot et al.32, we use a two-step
approach of first making inference from the genetic data and then incorporating this into the dynamic transmis-
sion model of RSV.
Results
The data imputation process resulted in shedding episodes that ranged from 2 to 35 days for RSV A, and 3 to
45 days for RSV B. The cluster IDs for 12 of 43 RSV A episodes and 19 of 71 RSV B episodes with no genetic
information were imputed prior to model fitting, the rest were inferred along with model parameters. The shed-
ding patterns after the data pre-processing are shown in Fig. 1.
Transmission dynamics inference. We compared the distributions of parameters estimated using RSV
cases identified at the pathogen, group and cluster level in order to assess the impact of increased resolution in
pathogen identification on estimated parameters. Fitting the model to group-level data is comparable to our
previous approach27, details of the changes to the model equations without genetic clusters are provided in sup-
Scientific Reports | (2021) 11:1463 | https://doi.org/10.1038/s41598-021-81078-x 2
Vol:.(1234567890)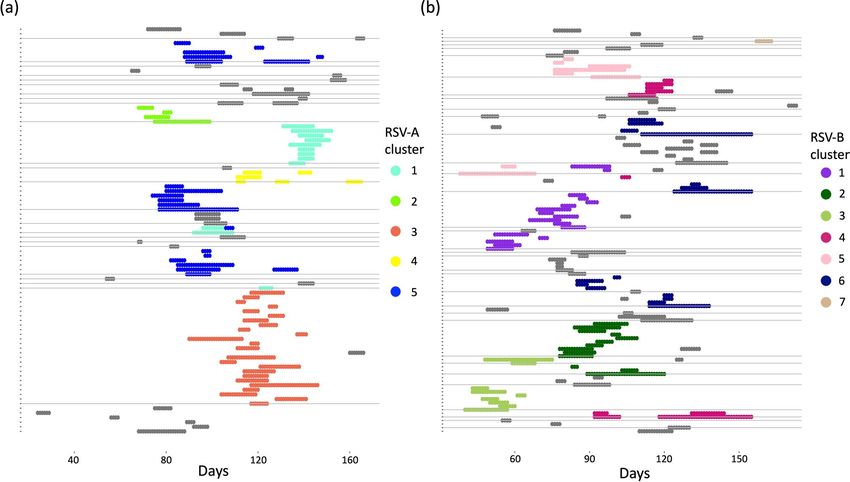
www.nature.com/scientificreports/

                                  Figure 2.  A comparison of the parameter distributions obtained from the model using different resolutions in
                                  pathogen identification. The green curves show the results using data at the pathogen level, the blue curves show
                                  the group level and the pink curves show the cluster level. Each panel shows 1 of 15 comparable parameters. The
                                  values in the panel are the median parameter estimates colour-coded by pathogen resolution. This figure was
                                  generated using R.

                                  plementary appendix A1. Figure 2 shows the comparison density plots of 15 comparable parameters across the
                                  model when fit to different pathogen resolutions.
                                      For most of the parameters, except those measuring the effect of viral load and symptoms on infectiousness,
                                  increased pathogen resolution did not translate to increased precision in parameter estimates. Using cluster-
                                  level pathogen identification, symptomatic cases were inferred to be more infectious than asymptomatic cases,
                                  more so with a high viral load [relative infectiousness 4.4 (95% CrI:1 0.8, 9.0)] than a low viral load [relative
                                  infectiousness: 2.1 (95% CrI: 1.2, 3.7)]. Increased pathogen resolution did not alter the inference made on the
                                  effect of the different covariates on the rate of exposure. Based on the parameters estimated with cluster-level
                                  pathogen identification, we inferred an inverse relationship between age and susceptibility to exposure: relative
                                  to infants (< 1 year old), the percentage reduction in the rate of exposure for 1–4, 5–14 and ≥ 15 year olds was
                                  9.4% (95% CrI: − 64%, 48.5%) , 71.8% (95% CrI: 49.1%, 83.7%) and 84% (95% CrI: 71.1%, 90.9%), respectively.
                                  RSV conferred partial immunity following infection, more so for homologous (56.6% (95% CrI: 32.7%, 73.3%)
                                  reduced exposure) than heterologous (49% (95% CrI: 9.4%, 74.3%) reduced exposure) group reinfections. House-
                                  holds of ≥ 8 individuals had a 55.3% (95% CrI: 30.1%, 70.6%) reduction in pair-wise rate of exposure within the
                                  household relative to smaller households. The effects of age in community exposure and ongoing heterologous
                                  group infection on susceptibility were unclear as the parameters were estimated with 95% credible intervals
                                  including 1. Despite some households having similar genetic clusters, this similarity could not be explained by
                                  between household transmission. The estimated spatial distance kernel did not support any transmission events
                                  between members of different household present in these data. We assumed an exponential relationship between
                                  pair-wise nucleotide distance and the probability of a transmission event having occurred. The estimate for the

Scientific Reports |   (2021) 11:1463 |               https://doi.org/10.1038/s41598-021-81078-x                                                  3

                                                                                                                                            Vol.:(0123456789)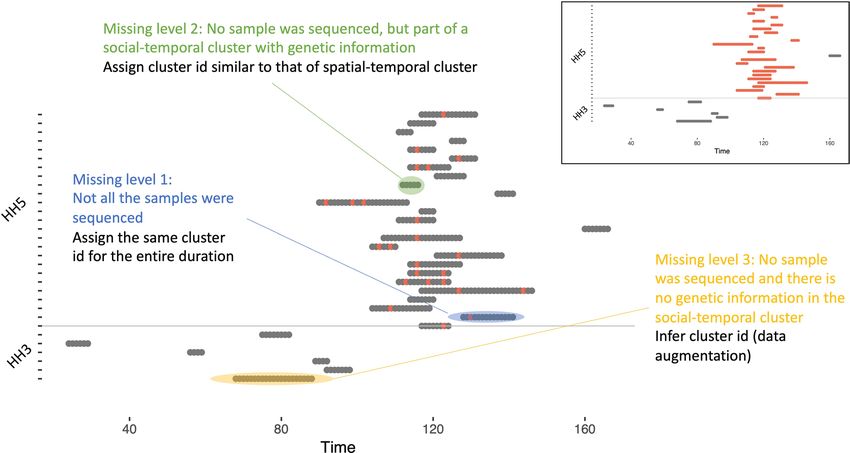
www.nature.com/scientificreports/
decay rate was so small, ϑ = 0.000244 (95% CrI: 0.000000883, 0.00373), such that cases in the same genetic cluster
could not be disentangled any further.
Increased pathogen resolution resulted in increases in the within household transmission coefficients for both
RSV-A and RSV-B, and slight decreases in the values of the community transmission coefficient for RSV-B. These
shifts in estimated distributions imply that with greater resolution on the infecting pathogen that each case is car-
rying, more infection events could be attributed to within household transmission than community transmission.
Parameter trace plots, results of convergence checks and the full parameter table from fitting to cluster-level
data, can be found in supplementary appendix A2. To validate the model, we simulated multiple epidemics which
verified that key aspects of the epidemic were being reproduced by the simulations. Details of this can be found
in supplementary appendix A3.
Highest probability transmission source (HPTS). The HPTS was established for each case and these
are shown in Fig. 3. Thirty-nine out of ninety-seven (40%) of the RSV-A and 60/125 (48%) RSV-B cases were
from sources outside of the household; 33% (13/39) of RSV-A introductions into the household led to infection
of other household members, as did 38% (23/60) of RSV-B introductions. Table 1 gives the age distribution of all
index cases compared to the age distribution of index cases that led to other infections in the household (house-
hold outbreaks). A larger proportion of index cases that resulted in onward transmission were symptomatic
(30/36), compared to those that did not (28/63). Household outbreaks were as frequently initiated by a symp-
tomatic infant as they were by a symptomatic child between 5 and 13 years. Fifty five percent (11/20) RSV-A
and 36% (8/22) RSV-B infant (< 1-year-old) infections were acquired within the household. Of the 11 infant
RSV-A cases, 8 were infected by children aged between 2 and 13 years (5 siblings and 3 cousins), 1 was infected
by another younger infant (cousin), 1 by a 16-year old (unknown relation) and 1 by a 37-year old (mother). Five
out of 8 of the infant RSV-B cases were infected by children between 2 and 13 years (4 siblings and 1 cousin), 2
were infected by a 16-year-old (unknown relation) and 18-year-old (sibling) while one was most likely infected
by a 49-year-old (father). Figure 4 shows the transmission network by relationship centred around the infants.
Infants infected several household members, mostly siblings and cousins.
Discussion
We carried out an analysis of longitudinal data on the social-temporal and genetic pattern of spread of RSV
in a sample of households in rural Kenya with the aim of using data integration techniques to enhance our
understanding of factors that influence infection onset and identifying characteristics of household transmis-
sion chains. We found that most household outbreaks were initiated by a symptomatic child < 13 years old, with
infants and children aged 5–13 years contributing equally. Infant infections that occurred in the household were
mostly attributed to transmission from an elder sibling or cousin between 2 and 13 years old. Similar to a simula-
tion study based on the same population from which our data were c ollected18, we found over half of the infant
infections were acquired outside of the household. Infants were the source of infection in 42/123 infections that
were acquired in the household. Infants are therefore not only an important risk group but are also important as
transmitters of household RSV infections. These results imply that a reduction in infant infections, say through
a vaccine, would have a positive indirect (otherwise called herd) effect on RSV infections in other age groups.
In addition, vaccination of household co-occupants of pre-school and school-going age would have an impact
through reducing within household transmission to the infant. A significant portion of index cases that led to
onward transmission in the household were symptomatic, a factor which we inferred to increase infectiousness.
This implies—similar to past work17—that a vaccine that works against symptomatic infections, therefore reduc-
ing infectiousness, should be highly effective.
Through combining epidemiological and phylogenetic inference, our method was able to better resolve
transmission chains within households compared to a preceding phylogenetic a nalysis25,33. The networks inferred
from the present analysis did not contradict any of the inference from the phylogenetic analysis, with one
exception. We assigned individual 3806 as the source of 3801’s RSV-B infection rather than 3805. In addition to
considering the social grouping, temporal clustering of cases and genetic clusters, our approach also considers
the infectiousness of a potential source. In this case, 3806 had symptoms and a high viral load in the three days
preceding shedding onset in 3801, while 3805 did not. Such an example highlights the strength in our technique
in being able to incorporate all possible determinants of a transmission event. It is worth mentioning that several
super-spreader events were inferred. The model arrives at these networks based on the patterns in the available
data. Though such events are plausible, to tease apart true super-spreader events from “convenience” networks,
additional data on within household contacts would be needed, such as the kind collected by Kiti et al.34.
We found that increased pathogen resolution by including WGS data had a slight effect on both accuracy
(resulting in narrower credible intervals for some parameters) and model inference (resulting in a change of
transmission hypothesis). Relative to our previous work where we fit an individual based model to pathogen
identification at the RSV-group level27, we narrowed down the relative infectiousness of symptomatic cases,
from 2–7 to 2–4 times more infectious than asymptomatic cases. High viral load increased the infectiousness
of symptomatic cases. We had previously hypothesized possible niche separations between RSV-A and RSV-B
based on overlapping but slightly different distributions of the transmission coefficients. Increased pathogen
resolution resulted in a slight change in estimated parameter distributions, as shown in Fig. 2, and this form of
evidence was lost. Other inferred dynamics such as the effect of age, household size, previous infection remained
relatively unchanged.
Scientific Reports | (2021) 11:1463 | https://doi.org/10.1038/s41598-021-81078-x 4
Vol:.(1234567890)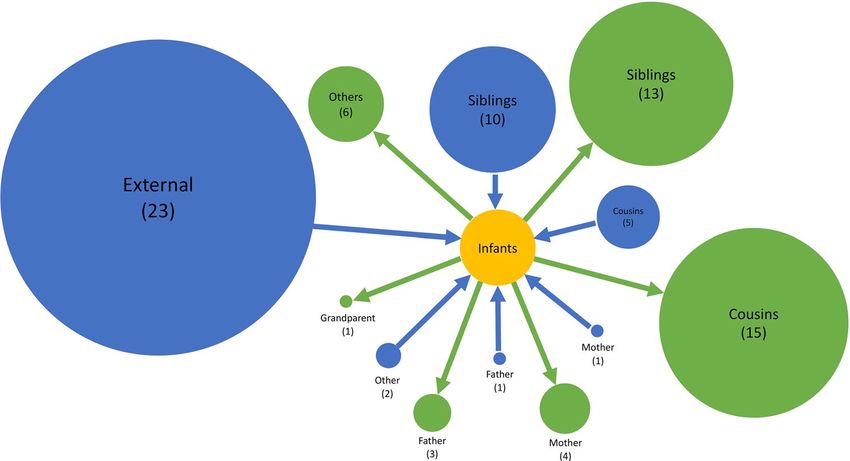
www.nature.com/scientificreports/

                                  Figure 3.  Transmission networks showing the highest probability source of transmission given by our model
                                  results. Each vertex is an RSV case labelled by individual study number (top) and age in years (bottom) and
                                  color-coded by household. Cases that are < 1-year-old are represented by square shaped vertices. The width of
                                  the connecting edge is proportional to the frequency at which the particular source was identified as the HPTS
                                  given different parameter set values. This figure was generated using R.

Scientific Reports |   (2021) 11:1463 |               https://doi.org/10.1038/s41598-021-81078-x                                                   5

                                                                                                                                           Vol.:(0123456789)
www.nature.com/scientificreports/
RSV A RSV B
No. index cases leading to onward No. index cases leading to onward
No. index cases (number of transmission (number of symptomatic No. index cases (number of transmission (number of symptomatic
Age group symptomatic cases) cases) symptomatic cases) cases)www.nature.com/scientificreports/
ork32,39,40, we used a two-step approach
This study is not without its limitations. Firstly, similar to previous w
in our application of phylodynamics. This has the potential to lead to inconsistencies that would otherwise not
occur with simultaneous inference of the evolutionary and epidemiological dynamics. However, given that
we only used aggregated results of the phylogenetic analysis, in the form of clusters, and raw nucleotide dis-
tances as opposed to phylogenetic tree distances, we do not heavily rely on the exact results of the independent
phylogenetic analysis. Using genetic clusters provides the advantage of being able to identify obvious separate
introductions, a characteristic that can be difficult to account for in the models of simultaneous inference. The
two-step approach was more computationally tractable than a simultaneous-inference version of it would have
been. Secondly, the clusters were not probabilistically determined, in particular, uncertainty in the estimated
date of sequence divergence was not considered. Finally, given the sampling interval of 3–4 days, short duration
shedding episodes might have been missed and apparent co-index cases might actually have different onset dates.
In conclusion, we were able to integrate the results of a phylogenetic analysis with epidemiological data to infer
that nearly half of the RSV infections in this study were acquired within the household. We showed explicitly that
most infants were infected by an older sibling or cousin (2–13 years). A vaccine that limits the transmission capa-
bilities (e.g. by eliminating ARI symptoms and reducing viral load) of this age group is therefore likely to reduce
a significant portion of infant infection through indirect protection. The differences in infection patterns and
interaction through modified susceptibility inferred between RSV-A and RSV-B warrant further investigation.
Methods
Data. During a seasonal RSV outbreak beginning late 2009, members of 47 households in a rural location
of coastal Kenya were followed up for a period of 6 months with an aim of recording the incidence of RSV and
inferring who infects the infant23. A household in this study was defined as comprising of people who share
food from the same kitchen. Households were recruited on the basis of having an infant born after the previous
RSV epidemic who had at least 1 elder sibling < 13 years old. Households in the study had a median size of 11
members (inter-quartile range: 8, 19). Members of the household had nasopharyngeal swab (NPS) samples and
clinical data collected every 3–4 days. The samples were tested for RSV using an in-house real-time multiplexed
polymerase chain reaction (rtPCR) assay41. A sample was considered RSV positive if the rtPCR cycle threshold
value was ≤ 35. An RSV infection episode was defined as a period within which an individual provided positive
samples for the same RSV group that were no more than 14 days apart. A shedding episode was referred to as
symptomatic if, within the window of virus shedding, there is at least one day where symptoms were recorded.
The symptoms of interest are those of an acute respiratory illness (ARI), which are: cough, or nasal discharge/
blockage, or difficulty breathing. There were 16,928 samples collected, of which 205 were positive for RSV-A and
306 for RSV-B. This translated to 97 RSV-A episodes (88 infected individuals and 25 infected households) and
125 RSV-B episodes (113 infected individuals and 34 infected households).
Positive samples from 20 households were targeted from genome sequencing on the basis of households
having ≥ 2 members infected. From 415 positive samples, 374 were processed for sequencing using the the
QIAamp viral RNA extraction Kit (QIAGEN, Hilden, Germany) for RNA extraction and the Illumina MiSeq
platform to generate short reads. Reads passing quality checks were de novo assembled into longer contigs using
SPAdes v3.5.042. Two hundred and forty-six samples were successfully amplified and assembled, 191 of which
had contigs > 14,000 nucleotides (> 90% of the RSV genome). All 246 genomes are accessible on GenBank under
the accession numbers MH594350—MH594461 for the RSV-B genomes and KX510136-KX510266 for the RSV-
A25. For the present analysis, we utilise the 191 near-complete genomes—referred to as whole genome sequences
(WGS)—obtained from 98 infected individuals. The median number of sequences per individual was 2 (IQR:
1–2)). The sequences were distributed across 103 (41.2%) samples, 54 (55.6%) episodes, 50 (56.8%) individuals
and 9 (36%) households for RSV-A; 88 (28.8%) samples, and 54 (43.2%) episodes, 53 (45.9%) individuals and
15 (44.1%) households for RSV-B. During phylogenetic analysis, as described p reviously25, genetic clades and
subclades were established based on a combination of criteria: nucleotide distance cut-off, clustering patterns on
the global RSV phylogeny and the inferred date of sequence divergence. Viruses were grouped in the same clade
if they occurred as a monophyletic group on the global phylogeny, had < 60 pairwise SNPs across the genome
with every other member of that clade and diverged more than a year prior to their date of collection. Within
clades, viruses formed a sub-clade if they showed > 10 pairwise SNPs differences across the genome and were
estimated to have diverged more than six months prior to their date of collection. We did not make a distinction
between clades and subclades, resulting in 5 RSV-A and 7 RSV-B clusters.
Informed written consent was obtained from all the study participants or their parent/guardian. The KEMRI-
Scientific and Ethical Review Committee in Kenya provided ethical approval for the initial study and any analysis
thereafter. The Observational/ Interventions Research Ethics Committee at the London School of Hygiene and
Tropical Medicine provided further approval for this analysis. All study procedures were performed in accord-
ance with the approved protocol guidelines and in compliance with the relevant regulations.
Transmission model. Model description. We took a sequential approach to making inference from the
genetic and epidemiological data described. The primary aim of the model was to infer the determinants of
infection in individual hosts. Exposure events are not observed, however, temporal, social (household) and ge-
netic clustering patterns of shedding episodes could aid to narrow down potential exposure windows. Similar to
our previous w ork27, we used an individual based model of RSV-A and RSV-B transmission and calibrated it to
social-temporal and genetic data.
Everyone is assumed to be uninfected and susceptible to infection by RSV at the start of the outbreak, but the
risk of infection was dependent on age. Once individuals were exposed to infection, they entered a latency period
that ranged between 2 and 5 days after which they became infectious43. After the infectious period, individuals
Scientific Reports | (2021) 11:1463 | https://doi.org/10.1038/s41598-021-81078-x 7
Vol.:(0123456789)www.nature.com/scientificreports/
became susceptible to infection again, but with a modified risk, i.e. RSV conferred partial transient immunity
that lasts as long as the outbreak is ongoing. This partial immunity is assumed to be different for heterologous and
homologous RSV group re-infections. Individuals can get heterologous group co-infections, hence, we explored if
susceptibility to infection by RSV-A was modified if an individual was currently shedding RSV-B, and vice-versa.
The main assumptions about transmission are contained in the equation giving the per capita rate at which
individuals are exposed to infection, . In order to incorporate the genetic information, we expressed as a daily
(index t), genetic-cluster-specific (index c) per capita (index i) rate, denoted i,c (t). At its base:
i,c (t) = contact rate∗probability of transmission given contact∗number of infectious contacts(t)
i,c (t) = baseline rate of exposure ∗ number of infectious contacts(t)
=η∗ Ij,c (t)
j ∈ infectious
contact
where η is the baseline rate of exposure and Ij,c (t) is an indicator variable of infectiousness of contact j at time t.
The individuals in our model are grouped into households and we allow for exposure to infection to occur
within or outside the household. Therefore, the basic rate of exposure is decomposed into 2 parts, a within-
household and community rate of exposure.
� �
i,c (t) = η ∗
Ij,c (t) + ε ∗
Ij,c (t)
j ∈ infectious j ∈ infectious
household community
contact contact
η = baseline rate of within household exposure
ε = baseline rate of community exposure
In addition to the assumptions about RSV natural history, we extend this basic formulation to explore if fac-
tors such as household size, infectiousness (as determined by the viral load proxy measurement of rtPCR cycle
threshold (Ct) and symptoms of acute respiratory illness (ARI)) and age are determinants of exposure. The form
for i,c (t), that now includes a household index h, is given by:
�
i,h,c (t) = Si,g (t)Mi,h (t) HH_Rateh,c,j→i (t) + Comm_Ratei,c (t) (1)
j�=i
where
Mi,h (t) is a binary indicator variable for recorded presence in the household.
Si,g (t) is the factor modifying exposure by recent group-specific infection history, age and group-specific
shedding status at time t given by:
Si,g (t) = exp φY ,hist Infection_Historyi (t) + φX,age Age_groupS,i + φW,curr Shedding_statusi (t)
(1.1)
HH_Rateh,c,j→i (t) is the cluster specific within household exposure rate from infectious individual j present
in the household at time t, and is given by:
(1.2)
HH_Rateh,c,j→i (t) = ηg × ψH (Household_sizei ) × ψI,inf Infectivityj,h,c (t) × Mj,h (t)
Comm_Ratei,c (t) is the cluster specific community (external to the household) exposure rate given by:
� � �
Comm_Ratei,c (t) = εg ×ψE,age Age_groupE,i Mi,h (t) Sampled_Neighbour_Rateh,c,j→i (t) + fc (t)
j �= i, jnotin
′
i shouse
(1.3)
The community rate is further decomposed into two components to account for possible distant-dependent
transmission between households in the dataset (Sampled_Neighbour_Rateh,c,j→i (t)), and from unknown sources
represented by a background function ( fc (t)). Further details of the exact formulations can be found in sup-
plementary appendix A4. Table 2 gives a brief description of the parameters in the presented equations, all of
which were estimated.
Linking the model to data. To link the rate of exposure equation to the observed data, we nested this equation
within the probability of infection onset given exposure, pi,h,c . We first defined the probability of exposure:
Scientific Reports | (2021) 11:1463 | https://doi.org/10.1038/s41598-021-81078-x 8
Vol:.(1234567890)www.nature.com/scientificreports/
Parameter (symbol) Description
φY Coefficients modifying susceptibility to infection by a particular RSV group depending on infection history
φX Coefficients modifying susceptibility to RSV depending on age
Coefficient modifying susceptibility to a particular RSV group based on shedding status of the heterologous group
φW
type
ηg Baseline rate of within household exposure by RSV group, per person per day
ψH Coefficient modifying within household exposure by household size
ψI Coefficients modifying infectiousness by viral load and symptom status
εg Baseline rate of community exposure by RSV group, per person per day
ψE Coefficients modifying community exposure by age group
Table 2. Model parameters and their descriptions.
− i,h,c (t)
i,h,c (t)
αi,h,c (t) = 1 − exp C′ ∗
(2)
C ′ i,h,c (t)
where C ′ is the set of all clusters in a given RSV group.
Assuming that the duration of latency can range from 0 to 5 days with probabilities [0, 0,0.33,0.33,0.25,0.083]43,
we then have the following probability of onset at time t given no onsets or shedding until t:
L
pi,h,c (t) = θl αi,h,c (t − l) (3)
l=0
where L is the maximum latency period and θl is the probability that the latency period is exactly l days.
For each individual we then assumed that their onset event (or lack thereof) on a given day t was deter-
mined by a Bernoulli distribution with probability pi,h,c (t). To incorporate the information on genetic clus-
ters, we introduced a genetic weight, Pj→i , on the rate of exposure from a given case in the same household,
HH_Riskh,c,j→i (t) × Pj→i , or from a sampled neighbour, Sampled_Neighbour_Riskh,c,j→i (t) × Pj→i . For
dgen i, j = pairwise nucleotide distance between case i and case j
Pj→i = exp−dgen (i,j)∗ϑ
where ϑ is estimated along with other model parameters. With this formulation, the larger the nucleotide distance
between a suspected transmission pair, the less likely that an infection event occurred. Further details of this can
be found in supplementary appendix A4.
The model requires daily infection data where a viral shedding episode can be identified by RSV group and by
genetic cluster within each group. However, given the sampling interval and sequencing of < 50% of the samples,
we had to make assumptions to fill in the days of missing data. We first imputed complete shedding durations by
assuming that shedding started half-way in-between the last negative and the first positive samples and ended
half-way in-between the last positive and the first negative samples. Subsequently, we imputed the genetic cluster
ID for episodes that had at least one sequence (missing level 1), and for episodes with no sequences yet were
part of a household outbreak with at least one sequence (missing level 2). A household outbreak is defined as
overlapping shedding episodes in the same household such that there is at least one individual with detectable
virus on any day during the course of the outbreak. The cluster ID for any episodes with no sequences that were
not part of household outbreak with at least one sequence (missing level 3) were inferred along with the model
parameters. The imputation of genetic clusters is illustrated in Fig. 5 and further details of the data pre-processing
can be found in supplementary appendix A5.
We use Bayesian inference and Metropolis-Hasting Markov Chain Monte Carlo (MH-MCMC) to obtain
estimates of the model parameters and augment missing cluster identities given the observed data. Further details
can be found in supplementary appendix A6. All the computation was done using the Julia language (version
1.1)44,45. The code is publicly available at https://github.com/KadzoK/HH-Transmission-Model-2015-2020-/
tree/master/Part_2.
Transmission chain inference. The estimated parameter distributions were then used to determine infection
sources for every case. A single parameter set was obtained by randomly selecting a position in the chain of
posterior samples. Given a parameter set, potential infection sources are identified for each case i based on who
was shedding within 5 days of shedding onset in case i. The probability of the observed onset given a particular
source is calculated for all the potential sources, the one with the highest value—the highest probability trans-
mission source (HPTS)—is selected as the source associated with the particular parameter set. We sampled 100
parameter sets and established the HPTS each time. From the distribution of 100 HPTS, the one with the highest
Scientific Reports | (2021) 11:1463 | https://doi.org/10.1038/s41598-021-81078-x 9
Vol.:(0123456789)www.nature.com/scientificreports/
Figure 5. An illustration of the genetic cluster imputation process. Each notch on the y-axis represents a single
individual in a household and the horizontal grey line separates the data from two households. Time in days is
shown on the x-axis. Each shaded horizontal region shows an imputed shedding episode with the coloured dots
showing the days in the episode where there is genetic cluster information. Inset: the results of imputing genetic
information at missing level 1 and 2. This figure was partly generated using R.
frequency was selected as the source of transmission. This frequency becomes the weight assigned in the trans-
mission network. Further details can be found in supplementary appendix A7.
Data availability
All the genomes used in the phylogenetic analysis are accessible on GenBank under the accession numbers
MH594350–MH594461 for the RSV-B genomes and KX510136-KX510266 for the RSV-A25. The household
data used to derive the social-temporal shedding patterns and more detailed information beyond the metadata
provided can be requested through Havard Dataverse (https://doi.org/10.7910/DVN/BPSZZS/1MO6TO).
Received: 5 April 2020; Accepted: 4 January 2021
References
1. Shi, T., McLean, K., Campbell, H. & Nair, H. Aetiological role of common respiratory viruses in acute lower respiratory infections
in children under five years: a systematic review and meta-analysis. J. Glob. Health 5, 1–10 (2015).
2. O’Brien, K. L. et al. Causes of severe pneumonia requiring hospital admission in children without HIV infection from Africa and
Asia: the PERCH multi-country case-control study. Lancet 6736, 1–23 (2019).
3. Prasad, N. et al. Interactive effects of age and respiratory virus on severe lower respiratory infection. Epidemiol. Infect. 146,
1861–1869 (2018).
4. PATH. RSV Vaccine Snapshot - PATH Vaccine Resource Library. http://vaccineresources.org/details.php?i=1562 (2015).
5. Novavax. A study to determine the safety and efficacy of the RSV F vaccine to protect infants via maternal immunization. NIH
U.S. National Library of Medicine https://clinicaltrials.gov/ct2/show/record/NCT02624947 (2018).
6. Novavax Inc. Novavax announces topline results from phase 3 PrepareTM trial of ResVaxTM for prevention of RSV disease in
infants via maternal immunization. Globe Newswire 1–3 (2019).
7. Li, Y. et al. Global patterns in monthly activity of influenza virus, respiratory syncytial virus, parainfluenza virus, and metapneu-
movirus: a systematic analysis. Lancet Glob. Health 7, e1031–e1045 (2019).
8. Jepsen, M. T. et al. Incidence and seasonality of respiratory syncytial virus hospitalisations in young children in Denmark, 2010
to 2015. Eurosurveill 23, 1–8 (2018).
9. Obando-Pacheco, P. et al. Respiratory syncytial virus seasonality: a global overview. J. Infect. Dis. 217, 1356–1364 (2018).
10. Broberg, E. K. et al. Seasonality and geographical spread of respiratory syncytial virus epidemics in 15 European countries, 2010
to 2016. Eurosurveillance 23, 17–00284 (2018).
11. Agoti, C. N. et al. Successive respiratory syncytial virus epidemics in local populations arise from multiple variant introductions,
providing insights into virus persistence. J. Virol. 89, 11630–11642 (2015).
12. Otieno, J. R. et al. Whole genome analysis of local Kenyan and global sequences unravels the epidemiological and molecular
evolutionary dynamics of RSV genotype ON1 strains. Virus Evol. 4, vey027 (2018).
13. Hogan, A. B. et al. Potential impact of a maternal vaccine for RSV: a mathematical modelling study. Vaccine 35, 6172–6179 (2017).
14. Scheltema, N. M. et al. Potential impact of maternal vaccination on life-threatening respiratory syncytial virus infection during
infancy. Vaccine https://doi.org/10.1016/j.vaccine.2018.06.021 (2018).
15. Brand, S. P. C., Munywoki, P., Walumbe, D., Keeling, M. J. & Nokes, D. J. Reducing RSV hospitalisation in a lower-income country
by vaccinating mothers-to-be and their households. bioRxiv https://doi.org/10.1101/569335 (2019).
Scientific Reports | (2021) 11:1463 | https://doi.org/10.1038/s41598-021-81078-x 10
Vol:.(1234567890)www.nature.com/scientificreports/
16. Kinyanjui, T. M. et al. Vaccine induced herd immunity for control of respiratory syncytial virus disease in a low-income country
setting. PLoS ONE 10, e0138018 (2015).
17. Pan-Ngum, W. et al. Predicting the relative impacts of maternal and neonatal respiratory syncytial virus (RSV) vaccine target
product profiles: A consensus modelling approach. Vaccine 35, 403–409 (2017).
18. Poletti, P. et al. Evaluating vaccination strategies for reducing infant respiratory syncytial virus infection in low-income settings.
BMC Med. 13, 49 (2015).
19. Yamin, D. et al. Vaccination strategies against respiratory syncytial virus. Proc. Natl. Acad. Sci. 113, 201522597 (2016).
20. Hall, C. B. et al. Respiratory syncytial virus infections within families. N. Engl. J. Med. 294, 414–419 (1976).
21. Hardelid, P., Verfuerden, M., Mcmenamin, J., Smyth, R. L. & Gilbert, R. The contribution of child, family and health service factors
to respiratory syncytial virus (RSV) hospital admissions in the first 3 years of life: birth cohort study in Scotland, 2009 to 2015.
Elife 9, e47003 (2019).
22. Otomaru, H. et al. Transmission of respiratory syncytial virus among children under 5 years in households of rural communities,
the Philippines. Open Forum Infect. Dis. https://doi.org/10.1093/ofid/ofz045 (2016).
23. Munywoki, P. K. et al. The source of respiratory syncytial virus infection in infants: a household cohort study in rural Kenya. J.
Infect. Dis. 209, 1685–1692 (2014).
24. Goldstein, E. et al. On the relative role of different age groups during epidemics associated with respiratory syncytial virus. J. Infect.
Dis. 217, 238–244 (2018).
25. Agoti, C. N. et al. Genomic analysis of respiratory syncytial virus infections in households and utility in inferring who infects the
infant. Sci. Rep. 9, 10076 (2019).
26. Githinji, G. et al. Assessing the utility of minority variant composition in elucidating RSV transmission pathways. bioRxiv https
://doi.org/10.1101/411512 (2018).
27. Kombe, I. K., Munywoki, P. K., Baguelin, M., Nokes, D. J. & Medley, G. F. Model-based estimates of transmission of respiratory
syncytial virus within households. Epidemics 27, 1–11 (2019).
28. Tong, S. Y. C. et al. Genome sequencing defines phylogeny and spread of methicillin-resistant Staphylococcus aureus in a high
transmission setting. Genome Res. 25, 111–118 (2015).
29. Lau, M. S. Y., Marion, G., Streftaris, G. & Gibson, G. A systematic bayesian integration of epidemiological and genetic data. PLoS
Comput. Biol. 11, e1004633 (2015).
30. Jombart, T. et al. Bayesian reconstruction of disease outbreaks by combining epidemiologic and genomic data. PLoS Comput. Biol.
10, e1003457 (2014).
31. Firestone, S. M. et al. Reconstructing foot-and-mouth disease outbreaks: a methods comparison of transmission network models.
Sci. Rep. 9, 1–12 (2019).
32. Didelot, X., Fraser, C., Gardy, J. & Colijn, C. Genomic infectious disease epidemiology in partially sampled and ongoing outbreaks.
Mol. Biol. Evol. 34, 997–1007 (2017).
33. Agoti, C. et al. Transmission patterns and evolution of RSV in a community outbreak identified by genomic analysis. Virus Evol.
(2017) (in print).
34. Kiti, M. C. et al. Quantifying social contacts in a household setting of rural Kenya using wearable proximity sensors. EPJ Data Sci.
5, 21 (2016).
35. Campbell, F., Cori, A., Ferguson, N. & Jombart, T. Bayesian inference of transmission chains using timing of symptoms, pathogen
genomes and contact data. PLoS Comput. Biol. 15, e1006930 (2019).
36. Agoti, C. N. et al. Local evolutionary patterns of human respiratory syncytial virus derived from whole-genome sequencing. J.
Virol. 89, 3444–3454 (2015).
37. Bose, M. E. et al. Sequencing and analysis of globally obtained human respiratory syncytial virus a and B genomes. PLoS One 10,
e0120098 (2015).
38. White, L. J., Waris, M., Cane, P. A., Nokes, D. J. & Medley, G. F. The transmission dynamics of groups A and B human respiratory
syncytial virus (hRSV) in England & Wales and Finland: seasonality and cross-protection. Epidemiology 2, 13 (2005).
39. Naveca, F. G. et al. Genomic, epidemiological and digital surveillance of Chikungunya virus in the Brazilian Amazon. PLoS Negl.
Trop. Dis. 13, e0007065 (2019).
40. Cottam, E. M. et al. Integrating genetic and epidemiological data to determine transmission pathways of foot-and-mouth disease
virus. Proc. R. Soc. B Biol. Sci. 275, 887–895 (2008).
41. Munywoki, P. K. et al. Continuous invasion by respiratory viruses observed in rural households during a respiratory syncytial
virus seasonal outbreak in coastal Kenya. Clin. Infect. Dis. 67, 1559–1567 (2018).
42. Bankevich, A. et al. SPAdes: a new genome assembly algorithm and its applications to single-cell sequencing. J. Comput. Biol. 19,
455–477 (2012).
43. Lee, F. E., Walsh, E. E., Falsey, A. R., Betts, R. F. & Treanor, J. J. Experimental infection of humans with A2 respiratory syncytial
virus. Antivir. Res. 63, 191–196 (2004).
44. Bezanson, J., Edelman, A., Karpinski, S. & Shah, V. B. Julia: a fresh approach to numerical computing. SIAM Rev. 59, 65–98 (2017).
45. Edelman, A. The Julia language. 1–51 (2013).
46. R Core Team. R: A Language and Environment for Statistical Computing (2020).
Acknowledgements
This work was funded by the Wellcome Trust (Grant Refs: 090853, 102975 and 203077/Z/16/Z). Dr Kombe is
supported through the DELTAS Africa Initiative [DEL- 15-003]. The DELTAS Africa Initiative is an independ-
ent funding scheme of the African Academy of Sciences (AAS)‘s Alliance for Accelerating Excellence in Science
in Africa (AESA) and supported by the New Partnership for Africa’s Development Planning and Coordinating
Agency (NEPAD Agency) with funding from the Wellcome Trust [107769/Z/10/Z] and the UK government.
The views expressed in this publication are those of the author(s) and not necessarily those of AAS, NEPAD
Agency, Wellcome Trust or the UK government. We would like to thank the study participants for providing
the study samples. We thank members of the Virus Epidemiology and Control (VEC) Research Group in Kilifi
whom were involved in this study especially in sample and data collection and laboratory screening for RSV.
We thank Dr Anne Cori, Prof. Xavier Didelot and Dr George Githinji for their comments on the analysis. This
paper is published with the permission of the director of Kenya Medical Research Institute.
Scientific Reports | (2021) 11:1463 | https://doi.org/10.1038/s41598-021-81078-x 11
Vol.:(0123456789)www.nature.com/scientificreports/
Author contributions
I.K.K. planned and carried out the analysis and wrote the main manuscript text, C.N.A. generated the genetic
data, P.K.M. designed the initial household study and conducted field work, M.B. gave feedback on the analysis,
D.J.N. designed the initial household study, applied for funds and gave feedback on analysis, G.F.M: designed the
initial household study, applied for funds and gave feedback on analysis. All authors reviewed the manuscript.
Competing interests
The authors declare no competing interests.
Additional information
Supplementary Information The online version contains supplementary material available at https://doi.
org/10.1038/s41598-021-81078-x.
Correspondence and requests for materials should be addressed to I.K.K.
Reprints and permissions information is available at www.nature.com/reprints.
Publisher’s note Springer Nature remains neutral with regard to jurisdictional claims in published maps and
institutional affiliations.
Open Access This article is licensed under a Creative Commons Attribution 4.0 International
License, which permits use, sharing, adaptation, distribution and reproduction in any medium or
format, as long as you give appropriate credit to the original author(s) and the source, provide a link to the
Creative Commons licence, and indicate if changes were made. The images or other third party material in this
article are included in the article’s Creative Commons licence, unless indicated otherwise in a credit line to the
material. If material is not included in the article’s Creative Commons licence and your intended use is not
permitted by statutory regulation or exceeds the permitted use, you will need to obtain permission directly from
the copyright holder. To view a copy of this licence, visit http://creativecommons.org/licenses/by/4.0/.
© The Author(s) 2021
Scientific Reports | (2021) 11:1463 | https://doi.org/10.1038/s41598-021-81078-x 12
Vol:.(1234567890)You can also read