Estimating Respiratory Rate From Breath Audio Obtained Through Wearable Microphones
←
→
Page content transcription
If your browser does not render page correctly, please read the page content below
Estimating Respiratory Rate From Breath Audio Obtained Through
                                                                  Wearable Microphones
                                                      Agni Kumar, Vikramjit Mitra, Carolyn Oliver, Adeeti Ullal, Matt Biddulph, Irida Mance

                                            Abstract— Respiratory rate (RR) is a clinical metric used       a healthcare provider in order for their symptoms to be
                                         to assess overall health and physical fitness. An individual’s     recognized. Creating an objective method for breathlessness
                                         RR can change from their baseline due to chronic illness           detection would lower the burden in identifying this symptom
                                         symptoms (e.g., asthma, congestive heart failure), acute illness
                                         (e.g., breathlessness due to infection), and over the course of    and may even alert healthcare providers to patients’ un-
                                         the day due to physical exhaustion during heightened exertion.     derlying medical conditions long before disease progression
arXiv:2107.14028v1 [cs.SD] 28 Jul 2021

                                         Remote estimation of RR can offer a cost-effective method          would have been observed in a clinical setting.
                                         to track disease progression and cardio-respiratory fitness           In this paper, we take the first step towards developing
                                         over time. This work investigates a model-driven approach          a breathlessness measurement tool by estimating respiratory
                                         to estimate RR from short audio segments obtained after
                                         physical exertion in healthy adults. Data was collected from 21    rate (RR) on exertion in a healthy population using audio
                                         individuals using microphone-enabled, near-field headphones        from wearable headphones. Given this focus, such a capa-
                                         before, during, and after strenuous exercise. RR was manually      bility also offers a cost-effective method to track cardio-
                                         annotated by counting perceived inhalations and exhalations.       respiratory fitness over time. While sensors such as ther-
                                         A multi-task Long-Short Term Memory (LSTM) network with            mistors, respiratory gauge transducers, and acoustic sensors
                                         convolutional layers was implemented to process mel-filterbank
                                         energies, estimate RR in varying background noise conditions,      provide the most accurate estimation of a person’s breathing
                                         and predict heavy breathing, indicated by an RR of more than       patterns, they are intrusive and may not be comfortable for
                                         25 breaths per minute. The multi-task model performs both          everyday use. In contrast, wearable headphones are rela-
                                         classification and regression tasks and leverages a mixture        tively economical, accessible, comfortable, and aesthetically
                                         of loss functions. It was observed that RR can be estimated        acceptable.
                                         with a concordance correlation coefficient (CCC) of 0.76 and
                                         a mean squared error (MSE) of 0.2, demonstrating that audio           Previous work on breath sounds detection from audio has
                                         can be a viable signal for approximating RR.                       focused on the detection and categorization of particular
                                                                                                            breath sounds using breath characteristics to distinguish
                                            Clinical relevance—The subject technology facilitates the use   between healthy and abnormal breath sounds [11, 12], as well
                                         of accessible, aesthetically acceptable wearable headphones to     as RR estimation from both contact-based sensors to obtain
                                         provide a technologically efficient and cost-effective method to
                                         estimate respiratory rate and track cardio-respiratory fitness     tracheal sounds [13, 14] and non-contact-based sensors, like
                                         over time.                                                         smartphones, to acquire nasal breath recordings [15]. The
                                                                                                            goal of this study is to validate whether versatile non-
                                                              I. I NTRODUCTION                              contact sensors, such as wearable near-field microphones,
                                            Breathlessness, or dyspnea, is a common symptom in              can provide incoming audio data sufficient to distinguish
                                         many acute and chronic clinical conditions. Acute breath-          between normal and heavy breathing and also estimate RR
                                         lessness often occurs during an asthmatic episode [1] or           by the sensing of breath sound patterns. Though we focus
                                         heart attack [2], while chronic breathlessness is frequently       on discerning RR in the context of fitness activity and not
                                         a symptom of low cardiovascular fitness and obesity [3,            clinical breathlessness detection specifically, findings could
                                         4], chronic obstructive pulmonary disease (COPD) [5], and          in turn be used for medical applications.
                                         congestive heart failure (CHF) [6, 7]. Breathlessness on
                                         exertion is also a strong independent predictor of mortality                                 II. DATA
                                         [8] and is a commonly-used clinical metric for assessing and          We chose to focus on the exercise context to obtain
                                         monitoring disease progression. The primary classifications        breath samples of varying intensities. Data was collected
                                         of heart failure (NYHA Class I-IV) are defined in terms            from 21 healthy individuals from both indoor and outdoor
                                         of breathlessness, either occurring at rest or during normal       environments. Participants spanned the ages of 22 to 60 and
                                         levels of physical activity [9].                                   were split fairly evenly between genders. Several participants
                                            Breathlessness scores as quantified by the Borg Dyspnea         provided six pulse rate measurements per audio sample
                                         Scale, used to assess clinical severity of diseases such as pe-    submitted, each of which spanned a six-minute active period.
                                         ripheral artery disease (PAD) and other respiratory disorders,        All data was recorded using microphone-enabled, near-
                                         are subjective patient-reported measures [10]. Individuals         range headphones, specifically Apple’s AirPods. These par-
                                         with such conditions are typically required to interface with      ticular wearables were selected because they are owned
                                                                                                            by millions and utilized in a wide array of contexts, from
                                           Apple, Cupertino, California, USA. Emails: {agni@apple.com,      speaking on the phone to listening to music during exercise.
                                         vmitra@apple.com, carolyno@apple.com}                              Unlike prior studies in which the acoustic environment and
background noise were artificially altered [15], our study did representations in distinguishing between normal and heavy
not place artificial acoustic constraints on the data collection breathing, which prompted using temporal convolution and
setup. recurrent layers in the model described in Section IV.
Each trial of the data collection asked participants to
record four one-minute audio clips before, during, immedi-
ately after, and while cooling down following completion of
a nine-minute workout session, in which six minutes involved
physical exercise. Workout types were selected to induce
heavy breathing, with the goal of doubling participants’
resting heart rates at the peak of physical exertion. (a) normal breathing
1. Before workout (minute 1)
2. During the workout, towards the end (minute 5)
3. Immediately after the workout (minute 6)
4. While cooling down (minute 8)
Participants were also asked to note pulse rates in beats
per minute (BPM) as obtained from an Apple Watch at six
points in the exercise session: before recording an audio clip (b) heavy breathing
of type 1 , before recording an audio clip of type 2 (minute
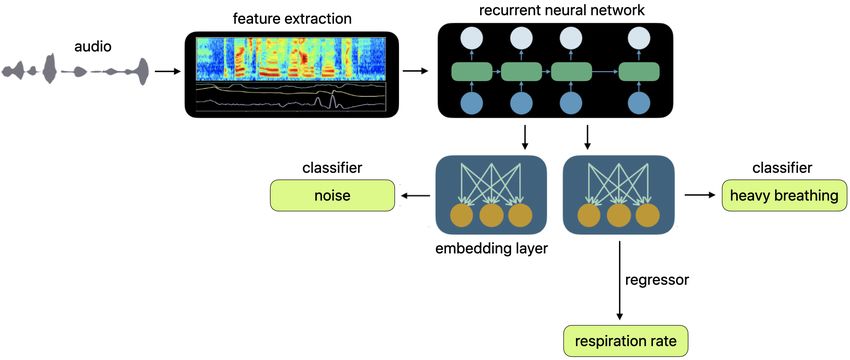
5), and before and after recording an audio clip of each of Fig. 2: Breath audio spectrograms
type 3 (minutes 6 and 7) and type 4 (minutes 8 and 9).
The data collection protocol is summarized in Figure 1. In total, over 3000 annotated audio signals were analyzed.
We are not aware of any audio data resources that have
perceptually graded RR labels that are bigger in volume than
that collected for this work. Analyses by breathing intensity
and gender are thus provided in Section V.
III. A NALYSIS
We observe several interesting relations in the data. In
Figure 3, we note a right-tailed distribution of RR, likely
due to some participants having not exerted themselves to
Fig. 1: One trial of data collection included four recording the level requested, perhaps because it was not achievable
types corresponding to distinct workout stages. during a six-minute period with particular workout types.
In a future data collection, efforts will be made to either
All audio sessions were segmented into randomly-selected upsample data yielding higher respiratory rates or extend the
lengths between 4-7 seconds, to increase the probability that workout duration to increase the chances of observing heavy
a segment would contain at least one breath cycle. 3003 breathing.
segments were manually annotated for RR. The annotation
process involved counting the number of inhale-exhale cycles
that could be heard in each audio sample and dividing the
breath count by the clip duration in minutes to achieve
respiratory rate measures in breaths per minute.
299 segments of type 1 , 457 of type 2 , 762 of type
3 , and 285 of type 4 , along with 1200 randomly chosen
segments, were annotated and served as ground truth values.
The perceptual annotation was motivated by the fact that
perceived audio respiration events should be represented well
by the acoustic features, which in turn would facilitate the
model training. In cases of high background noise, audio
samples could be rendered imperceptible to the human ear
and result in distorted acoustic features.
In the spectrogram in Figure 2(a), indicative of normal
breathing, two prominent inhalation signals are observed Fig. 3: Distribution of annotated respiratory rates
with no harmonic structure. The intense exercise sample in
Figure 2(b), associated with heavy breathing, shows more Participants’ exercises varied in intensity and included
frequent energy bursts but also lacks harmonic structure, running, biking, HIIT (high-intensity interval training), cal-
indicating both a higher RR and greater background noise. isthenics, fast walking, and walking up an incline. 60%
These observations support the use of temporal spectral of audio samples were recorded indoors while 40% wereFig. 4: Respiratory and pulse rates over workout stages
taken outdoors. It was observed that most of the data that A. Acoustic Features
was not entirely noisy, i.e., breath-only or a mix of breath We examined standard 40-dimensional MFB features with
and noise, comprised samples from during and immediately upper and lower cut-off frequencies of 0 and 7500 Hz. We
after workouts, when breathing was heaviest. Moreover, investigated MFBs with both more than and less than 40
participants’ noise contributions differed significantly, likely filteranks, and observed that 40 filterbanks offered the best
due to differing workout environments and home exercise performance on the held-out validation set.
equipment. Data from users who completed repeated exer- This frequency range was chosen as exhalation signals
cises in close time proximity tended to exhibit higher-than- contain wideband information, with [19] noting that frequen-
normal resting RR and pulse rates, since breaks taken in cies between 20 to 6000 Hz can encompass useful informa-
between were sometimes not long enough to reestablish a tion. From our analysis, we observed that nasal and oral
completely non-exerted state. exhalation had very different spectral characteristics, with
In Figure 4, we visualize how participants’ respiratory and the former having low frequency band-pass characteristics
pulse rates vary over time across workout stages, represented and the latter having more energy in high-pass regions.
by individual blue boxes. As expected, the median pulse rate (Similarly, when comparing nasal and oral snores, [20] found
is lower for stages 1 and 4 than for 2 and 3 , and nasal snores to exhibit frequencies around 500 Hz, while
that the pulse rate associated with 2 is higher than that oral snores were associated with wide-band spectra ranging
associated with 3 . RR varies in a similar manner, and the from 500 Hz to 1000 Hz.) Given that this study considers
high RR values achieved align with those collected in similar data collected from subjects after intensive workouts that
studies [16]. Each overlaid white circle is associated with a may result in more oral breathing due to exhaustion, we
single audio segment. The numbers of white circles differed hypothesized that energies in high frequency spectrums could
between minutes because participants could choose to opt-in be quite useful. Moreover, as one of the multi-task learned
or opt-out of submitting audio samples at any point in time, model’s objective functions relates to noise detection, the
as the study was designed to ensure high privacy. selected MFB feature frequency range is fitting.
IV. S YSTEM D ESCRIPTION
We investigated mel-filterbank energy (MFB) acoustic
features to parameterize the audio streams [17] and trained an
LSTM network and a time-convolutional LSTM (TC-LSTM)
network using multi-task learning (MTL) [18]. Our study
presents, for the first time, the use of filterbank energies
processed by time-convolutional layers. We hypothesize that
such a setup is effective as it captures both signal envelope-
level information as well as longer time contexts to better Fig. 5: Multi-task learning architecture with LSTM
assess respiration information. The learning network, an
end-to-end model, is not standard in that it simultaneously
encompasses both regression and classification tasks. Its B. Acoustic Modeling
architecture was motivated by the nature of the specific data We investigated single layer LSTMs with 16, 32, and 64
collected, described in Section II. neurons in the recurrent and embedding layers. The networkhad three outputs: The model was trained with a mini-batch size of 64 using
• A 2-dimensional output corresponding to RR and res- an Adam optimizer, with a learning rate of 0.01 and a
piration count (RC) estimates momentum of 0.9. For all the model training steps, early
• A 3-dimensional output reflecting the classes of no stopping was allowed based on cross-validation error. The
breathing, normal breathing (RR between 5 to 30 embedding layer between the breath classification and RR
breaths per minute), and heavy breathing (RR greater and RC estimation tasks was shared. The noise classification
than 30 breaths per minute) task had a separate embedding layer, which was a fourth of
• A 2-dimensional output corresponding to noise or noise- the size of the breath embedding layer.
less cases We also investigated a TC-LSTM network, where a convo-
lution operation with a filter size of 3 was performed across
The model, depicted in Figure 5, was trained with multiple
time. The number of convolution filters was same as the
objective functions as a multi-task learning (MTL) network,
number of input feature dimensions. The feature maps from
where the tasks were RR estimation, heavy breathing detec-
the convolutional layers were fed as inputs to the succeeding
tion, and noise detection, represented by the three outputs
LSTM network.
mentioned above. As the audio segments used to train the
During training, the CCC for RR estimation on a held-
model had varying lengths, meaning that two segments of
out validation set was used to select the best epoch, and the
differing durations could have the same RR but different
model from that epoch was used to obtain the performance
RCs, RC was included as a target in the multi-task objective
on the held-out evaluation set. Results on the evaluation set
function to ensure the model’s ability to generalize across
are provided in terms of both CCC and mean squared error
temporal durations and also learn correlations between RC
(MSE).
and RR.
The individual losses from each task are given below, V. R ESULTS
where concordance correlation coefficient (CCC) loss is used
on the RR and RC outputs and weighted cross-entropy (CE) We investigated model size by exploring LSTM models
loss is used on the breath and noise classification tasks. with 16, 32, and 64 neurons in the recurrent and embedding
The interpretation of CCC used here is similar to that of layers. The evaluation metrics used were F1 scores for the
Pearson’s product moment correlation (PPMC), where CCC classification task and CCC for the regression task.
ranges between −1 to +1 and a higher value indicates a Table I shows the variation in performance by model size,
better fit [21]. CCC was chosen as a performance metric where the model with 32 neurons in the LSTM layer, 32
based on findings from the literature showing that it captures neurons in the breath embedding layer, and 8 neurons in
both aspects of the correlation and the error between target the noise embedding layer was found to perform the best
and estimated scores [22, 23]. on both the validation and evaluation sets. The model with
64 neurons shows some degree of overfitting, where the
CCCcost := αCCCRR + (1 − α)CCCRC performance gap between the validation and evaluation set
X
CE(x)breath := wbreath (−xbreath + log exp(x[i])) was larger than that of the model with 32 neurons. This could
i be a consequence of the data volume limitation, as larger
datasets may enable using models with more parameters.
X
CE(y)noise := wnoise (−xnoise + log exp(y[j]))
j
TABLE I: CCC, PPMCC (ρ) for RR estimations, and F1
Additionally, a focal loss term [24, 25] was used for the scores for breath and noise classification tasks for the vali-
breath detection task, and a convex mixture of all the losses dation and evaluation sets, from the MTL-LSTM network
after dynamic weight averaging [26], with weighting factor Neurons CCCRR ρRR F1,breath F1,noise
λ, was used as the MTL loss to train the network shown in Validation
Figure 5. 16 0.79 0.85 57.55 88.82
32 0.88 0.88 64.76 89.61
M T Lloss = β · λCCC · CCCcost 64 0.85 0.85 56.53 93.65
Evaluation
+ γ · λCEbreath · CE(x)breath 16 0.59 0.65 49.20 66.91
32 0.73 0.73 66.33 76.81
+ κ · λCEnoise · CE(y)noise 64 0.62 0.62 52.82 65.04
+ (1 − β − γ − κ) · λF Lbreath · F L(x)breath
Next, we explored a time-convolution layer in the acoustic
The CCC for each of the RR and RC outputs is be-
model and modulation features as an alternative feature
low, where µx and µy are the means, σx2 and σy2 are the
representation, and whether such selections could facilitate
corresponding variances for the estimated and ground truth
better detection of respiration from audio. Table II presents
variables, and ρ describes the correlation between these two
the results from these experiments, for which there were
variables.
32 neurons in the LSTM and breath embedding layers. RR
2ρσx σy was estimated with a CCC as high as 0.76 and a detection
CCC =
σx2 + σy2 + (µx − µy )2 accuracy of breathing at 66%.Fig. 6: Performance (MSE) comparisons for various RR ranges for female and male participants in the test set
TABLE II: CCC, PPMCC (ρ), and MSE scores for RR male participants in the test set. Interestingly, estimates for
estimation, and F1 scores for breath classification tasks for female participants were almost always better than those for
the evaluation set the male participants. It is possible that differing anatomical
Model CCCRR ρRR M SERR F1,breath breathing apertures, age distributions, or ratios of indoor to
LSTM 0.73 0.73 0.32 66.33 outdoor samples collected between the two groups could
TC-LSTM 0.76 0.78 0.31 63.00
have contributed to this observation.
We then investigated how RR estimation varied for dif-
ferent RR ranges and how data augmentation could help VI. C ONCLUSIONS
improve the performance of the RR estimation model. Recall
In this study, we investigated the feasibility of estimating
that the dataset used in this study included audio in both
respiratory rate from audio captured using wearable, near-
indoor and outdoor conditions. The outdoor data already
field microphones. We found a time convolution LSTM net-
contained natural ambient noise such as wind and traffic
work to be effective at generating respiratory rate estimates
sounds, so the indoor data was further augmented by pseudo-
and robust against data sparsity.
stationary noise reflective of appliance sounds at various
The work is unique in three main ways, in that it esti-
signal-to-noise ratios (SNRs) between 20 to 40 dBs. For
mates respiratory rate from a wearable microphone under
each indoor data file, noise was added at three different
natural ambient conditions both indoors and outdoors, uses
SNR levels, each of which was selected from a uniform
a model-driven approach to estimate respiratory rate directly
distribution between 10 to 20 dB, 20 to 30dB and 30 to
from filterbank energies, and introduces situational aware-
40dB, respectively. Data augmentation was applied only on
ness through multi-task learning so that the model could
the training partition.
discern high SNR conditions from low ones. To the best
of our knowledge, no prior study has investigated data col-
TABLE III: MSE values across the LSTM and TC-LSTM
lected from natural conditions from both indoor and outdoor
models before and after data augmentation across RR ranges
background conditions, used perceptually graded data, and
Model below 15 15 to 25 above 25 attempted to build an end-to-end system that can consume
LSTM 0.33 0.43 0.29
TC-LSTM 0.32 0.42 0.22 filterbank energies to directly predict respiratory rates and
LSTM (augumented data) 0.28 0.24 0.29 make heavy breathing classifications. Hence, we hope our
TC-LSTM (augmented data) 0.21 0.20 0.21 proposed system will be used as a baseline for future studies
on end-to-end respiratory rate estimation models.
Table III shows how the performance of RR estimation in Results presented validate that RR can be estimated from
terms of MSE varied at low (less than 15 breaths per minute), audio captured using wearable microphones, enabling the
medium (between 15 and 25 breaths per minute), and high detection of heavy breathing conditions and the monitoring
(greater than 25 breaths per minute) RR rates. It is evident of RR changes, a measure of cardio-respiratory fitness, over
that data augmentation helped reduce the MSE for almost time. Data augmentation with simple acoustic distortion was
all the RR ranges. Moreover, as displayed in Figure 6 above, demonstrated to be an effective tool to reduce error rates.
the TC-LSTM model performed better than the LSTM model The findings show promise for further development of a
both with and without data augmentation across female and respiratory health tool with a larger study cohort.ACKNOWLEDGEMENTS [12] J. Castro and P. Marti-Puig, “Real-time identification of respiratory
movements through a microphone. adcaij: Advances in distributed
We would like to thank Siddharth Khullar, Jamie Cheng, computing and artificial intelligence journal (issn: 2255-2863),” Sala-
Suki Lee, Christopher Webb, Kate Neihaus, and many other manca, vol. 3, no. 3, 2014.
colleagues for their comments, suggestions, and help at [13] G. Sierra, V. Telfort, B. Popov, M. Pelletier, P. Despault, V. Lanzo,
and R. Agarwal, “Comparison of respiratory rate estimation based on
various stages of this effort. tracheal sounds versus a capnograph,” in 2005 IEEE Engineering in
Medicine and Biology 27th Annual Conference. IEEE, 2006, pp.
R EFERENCES 6145–6148.
[1] M. Barbaro, D. Lacedonia, G. Palladino, L. Bergantino, C. Ruggeri, [14] G. Sierra, V. Telfort, B. Popov, L. Durand, R. Agarwal, and V. Lanzo,
D. Martinelli, and G. Carpagnano, “Dyspnea perception in asthma: “Monitoring respiratory rate based on tracheal sounds. first experi-
Role of airways inflammation, age and emotional status,” Respiratory ences,” in The 26th Annual International Conference of the IEEE
medicine, vol. 105, no. 2, pp. 195–203, 2011. Engineering in Medicine and Biology Society, vol. 1. IEEE, 2004,
[2] R. Nakanishi, J. Rana, A. Rozanski, V. Cheng, H. Gransar, L. Thom- pp. 317–320.
son, R. Miranda-Peats, S. Hayes, J. Friedman, and D. Berman, [15] Y. Ren, C. Wang, J. Yang, and Y. Chen, “Fine-grained sleep mon-
“Relationship of dyspnea vs. typical angina to coronary artery disease itoring: Hearing your breathing with smartphones,” in 2015 IEEE
severity, burden, composition and location on coronary ct angiogra- Conference on Computer Communications (INFOCOM). IEEE, 2015,
phy,” Atherosclerosis, vol. 230, no. 1, pp. 61–66, 2013. pp. 1194–1202.
[3] V. Bernhardt and T. Babb, “Respiratory symptom perception differs in [16] A. Nicolò, C. Massaroni, and L. Passfield, “Respiratory frequency
obese women with strong or mild breathlessness during constant-load during exercise: the neglected physiological measure,” Frontiers in
exercise,” Chest, vol. 145, no. 2, pp. 361–369, 2014. physiology, vol. 8, p. 922, 2017.
[17] H. Heo, J. Jung, I. Yang, S. Yoon, H. Shim, and H. Yu, “End-to-end
[4] D. Jensen, D. Ofir, and D. O’Donnell, “Effects of pregnancy, obesity losses based on speaker basis vectors and all-speaker hard negative
and aging on the intensity of perceived breathlessness during exercise mining for speaker verification,” arXiv preprint arXiv:1902.02455,
in healthy humans,” Respiratory physiology & neurobiology, vol. 167, 2019.
no. 1, pp. 87–100, 2009. [18] A. Kendall, Y. Gal, and R. Cipolla, “Multi-task learning using
[5] B. Celli, C. Cote, S. Lareau, and P. Meek, “Predictors of survival in uncertainty to weigh losses for scene geometry and semantics,” in
copd: more than just the fev1,” Respiratory medicine, vol. 102, pp. Proceedings of the IEEE conference on computer vision and pattern
S27–S35, 2008. recognition, 2018, pp. 7482–7491.
[6] N. Hendren, M. Drazner, A. Pandey, W. Tang, and J. Grodin, “Im- [19] J. Niu, M. Cai, Y. Shi, S. Ren, W. Xu, W. Gao, Z. Luo, and J. M.
plications of perceived dyspnea and global well-being measured by Reinhardt, “A novel method for automatic identification of breathing
visual assessment scales during treatment for acute decompensated state,” Scientific reports, vol. 9, no. 1, pp. 1–13, 2019.
heart failure,” The American journal of cardiology, vol. 124, no. 3, [20] T. MIKAMI, Y. KOJIMA, K. YONEZAWA, M. YAMAMOTO, and
pp. 402–408, 2019. M. FURUKAWA, “Classification of oral/nasal simulated snores based
[7] P. Pang, K. Lane, M. Tavares, A. Storrow, C. Shen, W. Peacock, on the acoustic properties,” Journal of Biomechanical Science and
R. Nowak, A. Mebazaa, S. Laribi, and J. Hollander, “Is there a Engineering, vol. 7, no. 4, pp. 433–448, 2012.
clinically meaningful difference in patient reported dyspnea in acute [21] J. M. Bland and D. Altman, “Statistical methods for assessing agree-
heart failure? an analysis from urgent dyspnea,” Heart & Lung, vol. 46, ment between two methods of clinical measurement,” The lancet, vol.
no. 4, pp. 300–307, 2017. 327, no. 8476, pp. 307–310, 1986.
[8] J. Pan, P. Adab, C. Jiang, W. Zhang, F. Zhu, Y. Jin, G. Thomas, [22] I. Lawrence and K. Lin, “A concordance correlation coefficient to
and T. Lam, “All-cause and cause-specific mortality from restrictive evaluate reproducibility,” Biometrics, pp. 255–268, 1989.
and obstructive spirometric patterns in chinese adults with and without [23] V. Kowtha, V. Mitra, C. Bartels, E. Marchi, S. Booker, W. Caruso,
dyspnea: Guangzhou biobank cohort study,” Respiratory medicine, vol. S. Kajarekar, and D. Naik, “Detecting emotion primitives from speech
151, pp. 66–80, 2019. and their use in discerning categorical emotions,” arXiv preprint
[9] C. C. of the New York Heart Association et al., Nomenclature and arXiv:2002.01323, 2020.
criteria for diagnosis of diseases of the heart and great vessels. [24] T. Lin, P. Goyal, R. Girshick, K. He, and P. Dollár, “Focal loss
Boston: Little, Brown & Co, 1994, vol. 253. for dense object detection,” Proceedings of the IEEE international
[10] G. Borg, “Psychophysical bases of perceived exertion.” Medicine & conference on computer vision, pp. 2980–2988, 2017.
Science in Sports & Exercise, 1982. [25] H. Gil, S. Park, Y. Park, W. Han, J. Hong, and J. Jung, “Balance-
[11] S. Li, B. Lin, C. Tsai, C. Yang, and B. Lin, “Design of wearable oriented focal loss with linear scheduling for anchor free object
breathing sound monitoring system for real-time wheeze detection,” detection,” arXiv preprint arXiv:2012.13763, 2020.
Sensors, vol. 17, no. 1, p. 171, 2017. [26] S. Liu, E. Johns, and A. Davison, “End-to-end multi-task learning with
attention,” in Proceedings of the IEEE Conference on Computer Vision
and Pattern Recognition, 2019, pp. 1871–1880.You can also read