Simultaneous observations by sky radiometer and MAX-DOAS for characterization of biomass burning plumes in central Thailand in January-April 2016 ...
←
→
Page content transcription
If your browser does not render page correctly, please read the page content below
Atmos. Meas. Tech., 12, 599–606, 2019
https://doi.org/10.5194/amt-12-599-2019
© Author(s) 2019. This work is distributed under
the Creative Commons Attribution 4.0 License.

Simultaneous observations by sky radiometer and MAX-DOAS
for characterization of biomass burning plumes in central
Thailand in January–April 2016
Hitoshi Irie1 , Hossain Mohammed Syedul Hoque1 , Alessandro Damiani1 , Hiroshi Okamoto1 , Al Mashroor Fatmi1 ,
Pradeep Khatri2 , Tamio Takamura1 , and Thanawat Jarupongsakul3
1 Centerfor Environmental Remote Sensing, Chiba University, 1-33 Yayoicho, Inage-ku, Chiba 263-8522, Japan
2 Centerfor Atmospheric and Oceanic Studies, Graduate School of Science, Tohoku University, Sendai 980-8578, Japan
3 Department of Geology, Faculty of Science, Chulalongkorn University, Phayathai Road, Bangkok 10330, Thailand

Correspondence: Hitoshi Irie (hitoshi.irie@chiba-u.jp)

Received: 23 August 2018 – Discussion started: 13 September 2018
Revised: 26 December 2018 – Accepted: 15 January 2019 – Published: 29 January 2019

Abstract. The first intensive multicomponent ground-based        1   Introduction
remote-sensing observations by sky radiometer and multi-
axis differential optical absorption spectroscopy (MAX-          It is well recognized that aerosols contribute the largest un-
DOAS) were performed simultaneously at the SKYNET Phi-           certainty to the estimate of radiative forcing (e.g., IPCC,
mai site located in central Thailand (15.18◦ N, 102.56◦ E)       2013). Biomass burning (BB) is a substantial source of
from January to April 2016. The period corresponds to the        aerosols to the atmosphere. Black carbon (BC) is a strongly
dry season associated with intense biomass burning (BB)          light-absorbing component of aerosols and can be emitted
activity around the site. The near-surface concentration of      in large quantities from BB. In addition, about two-thirds of
formaldehyde (HCHO) retrieved from MAX-DOAS was                  the global primary organic aerosol (OA) that should com-
found to be a useful tracer for absorption aerosols from BB      prise a large amount of ultraviolet (UV)-light-absorbing OA,
plumes, when BB was the dominant source of HCHO and              known as brown carbon (BrC), originates from BB plumes
absorption aerosols over other sources. As the HCHO con-         (Bond et al., 2013). Currently, most climate models treat OA
centration tripled from 3 to 9 ppbv, the ratio of gaseous gly-   as purely scattering. Recent laboratory studies suggested that
oxal to HCHO concentrations in daytime decreased from            BrC can enhance net absorption by OA, potentially alter-
∼ 0.04 to ∼ 0.03, responding presumably to the increased         ing the BB direct radiative forcing from negative to posi-
contribution of volatile organic compound emissions from         tive (Kirchstetter et al., 2004; Saleh et al., 2014). Moreover,
BB. In addition, clear increases in aerosol absorption opti-     underestimation in aerosol absorption over most BB regions
cal depths (AAODs) retrieved from sky radiometer observa-        was reported by Hammer et al. (2016), who used a global
tions were seen with the HCHO enhancement. At a HCHO             3-D chemistry transport model (GEOS-Chem), in which OA
of 9 ppbv, AAOD at a wavelength of 340 nm reached as high        is regarded as purely scattering. Thus, the potential climate
as ∼ 0.15 ± 0.03. The wavelength dependence of AAODs at          effects of BrC aerosols have received considerable attention
340–870 nm was quantified by the absorption Ångström ex-         recently (e.g., Myhre et al., 2013). In addition, as a result of
ponent (AAE), providing evidence for the presence of brown       UV absorption, tropospheric photochemistry can be signifi-
carbon aerosols at an AAE of 1.5 ± 0.2. Thus, our multicom-      cantly affected; GEOS-Chem simulation incorporating UV
ponent observations around central Thailand are expected         absorption by BrC showed a decrease in tropospheric hy-
to provide unique constraints for understanding physical–        droxyl radical (OH) concentration by up to 15 % for BB re-
chemical–optical properties of BB plumes.                        gions, compared to the simulation without UV absorption by
                                                                 BrC (Hammer et al., 2016). BrC comprises a wide range of
                                                                 poorly characterized compounds that exhibit highly variable

Published by Copernicus Publications on behalf of the European Geosciences Union.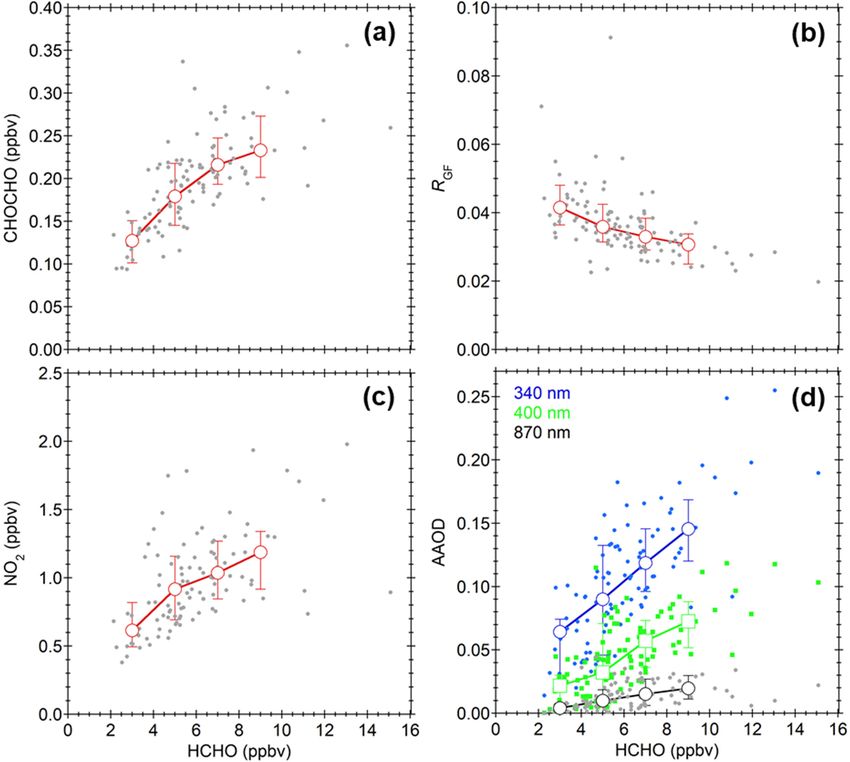
600             H. Irie et al.: Simultaneous observations by sky radiometer and MAX-DOAS for characterization of BB

absorptivity. Assessing the role of BrC in light absorption is   mura (2009) but without using global irradiance data from a
further difficult because BrC is not only emitted as a primary   pyranometer.
organic aerosol (POA) but also produced as a secondary or-          The SKYNET sky radiometer has on-site calibration
ganic aerosol (SOA) through complex formation processes          methods, namely the improved Langley (IL) method deter-
from volatile organic compounds (VOCs) originating from          mining the calibration constant (F0 ) (e.g., Campanelli et al.,
BB.                                                              2007) and the solar disk scan (SDS) method determining
   This study focuses on the intense BB activity that oc-        the solid view angle (SVA) (e.g., Nakajima et at., 1996;
curred around central Thailand from January to April 2016.       Uchiyama et al., 2018). Recently, Mok et al. (2018) used re-
Characterization for the BB plumes is attempted using our        trievals with SR-CEReS to compare SKYNET sky radiome-
unique remote-sensing observations by the sky radiometer         ter AOD and SSA data with those derived from a combi-
(e.g., Nakajima et al., 1996) and the multi-axis differential    nation of Aerosol Robotic Network (AERONET), multifil-
optical absorption spectroscopy (MAX-DOAS) (e.g., Irie et        ter rotating shadow-band radiometer (MFRSR), and Pandora
al., 2011) for both viewpoints of the optical properties of      observations in Seoul, Korea, during and after the NASA
aerosols (aerosol absorption optical depth, AAOD, and ab-        KORUS-AQ (Korea–US Air Quality) campaign in 2016
sorption Ångström exponent, AAE) and the organic gas con-        (Mok et al., 2018, and references therein). For most cases,
centrations (formaldehyde, HCHO, and glyoxal, CHOCHO)            their agreements were found to be within ±0.01 and ±0.05
in BB plumes.                                                    for AOD and SSA data, respectively, at all wavelengths from
                                                                 340 to 870 nm, supporting the ability of the on-site calibra-
                                                                 tion methods using IL and SDS.
2     Observation                                                   Since the importance of accurate SVA determination was
                                                                 particularly pointed out to better interpret the difference
We conducted ground-based remote-sensing observations us-        seen in previous SSA comparisons between SKYNET and
ing the sky radiometer and the MAX-DOAS at the SKYNET            AERONET (Khatri et al., 2016), sensitivity analysis was
Phimai site (15.18◦ N, 102.56◦ E) located in central Thailand    performed in the present study by conducting additional re-
from January to April 2016. The period corresponds to the        trievals using SVAs offset by ±0.01 msr (∼ ±4 %), which is
dry season with the occurrence of intense BB around the site.    likely to correspond to the uncertainty in SVA determined by
Indeed, satellite data revealed evident enhancements in the      a single SDS. Both positive and negative offsets were tested
carbon monoxide column concentration and the fire radia-         but only the positive offset is discussed here because the neg-
tive power (FRP) around the SKYNET Phimai site in the dry        ative offset tended to show only little or no impact on SSA,
season (Hoque et al., 2018a, b). Concerning the sky radiome-     when SSA was close to unity. This is because a smaller SVA
ter and the MAX-DOAS, their instrumentation, data analysis,      leads to a larger SSA (Hashimoto et al., 2012). The impacts
and retrieval are described below.                               by the SVA offset of +0.01 msr on SSAs were estimated to
                                                                 be as small as −0.010 ± 0.005, −0.010 ± 0.005, −0.010 ±
2.1    Sky radiometer observation of aerosol optical             0.005, −0.010±0.006, −0.012±0.007, and −0.011±0.008
       properties                                                at 340, 380, 400, 500, 675, and 870 nm, respectively. Thus,
                                                                 overestimation (underestimation) in SVA leads to underes-
The sky radiometer (POM-02; Prede Co., Ltd., Tokyo,              timation (overestimation) in SSA, but the magnitude was
Japan), a sun–sky photometer measuring direct and diffuse        found to be very small at about ±0.01, when the uncertainty
solar irradiances, is the main instrument of the international   in SVA was ∼ ±0.01 msr. The small impact on SSAs should
ground-based remote-sensing network SKYNET (e.g., Taka-          be a result of compensation by the associated change in F0
mura and Nakajima, 2004; Nakajima et al., 2007). Measure-        values; using SVA values offset by +0.01 msr as an input, the
ments of the direct solar and diffuse irradiances within 160◦    IL method employed in SR-CEReS yields smaller F0 values
of the center of the Sun were conducted every 10 min. Val-       by about 2.1 ± 0.1 %, 1.8 ± 0.2 %, 1.7 ± 0.2 %, 1.2 ± 0.2 %,
ues of aerosol optical depth (AOD), single-scattering albedo     0.7 ± 0.2 %, and 0.5 ± 0.1 % for 340, 380, 400, 500, 675,
(SSA), and refractive index at 340, 380, 400, 500, 675, and      and 870 nm, respectively. The resulting smaller F0 leads to
870 nm were retrieved using the sky radiometer analysis          a larger SSA (Hashimoto et al., 2012), which is an opposite
package from the Center for Environmental Remote Sens-           trend in the direct impact that a larger SVA leads to a smaller
ing (SR-CEReS) version 1 (Mok et al., 2018), in which            SSA (Hashimoto et al., 2012). Results from these sensitivity
SKYRAD.pack version 5 (Hashimoto et al., 2012) is imple-         analyses support the agreement of SSAs within ±0.05 seen
mented to retrieve aerosol properties, along with all pre- and   in recent comparisons by Mok et al. (2018) during and after
post-processing programs for the purpose of near-real-time       the NASA KORUS-AQ campaign.
data delivery. Data at 1020 nm were not used in this study to       Using the AOD and SSA data retrieved, AAOD and AAE
avoid possible impact by low AAOD and interference by wa-        values were derived as follows. First, for each measure-
ter vapor (H2 O) on the estimate of the AAE. Cloud screen-       ment and for respective wavelengths from 340 to 870 nm,
ing was carried out using the method of Khatri and Taka-         the AAOD value and its uncertainty (εAAOD ) were calculated

Atmos. Meas. Tech., 12, 599–606, 2019                                               www.atmos-meas-tech.net/12/599/2019/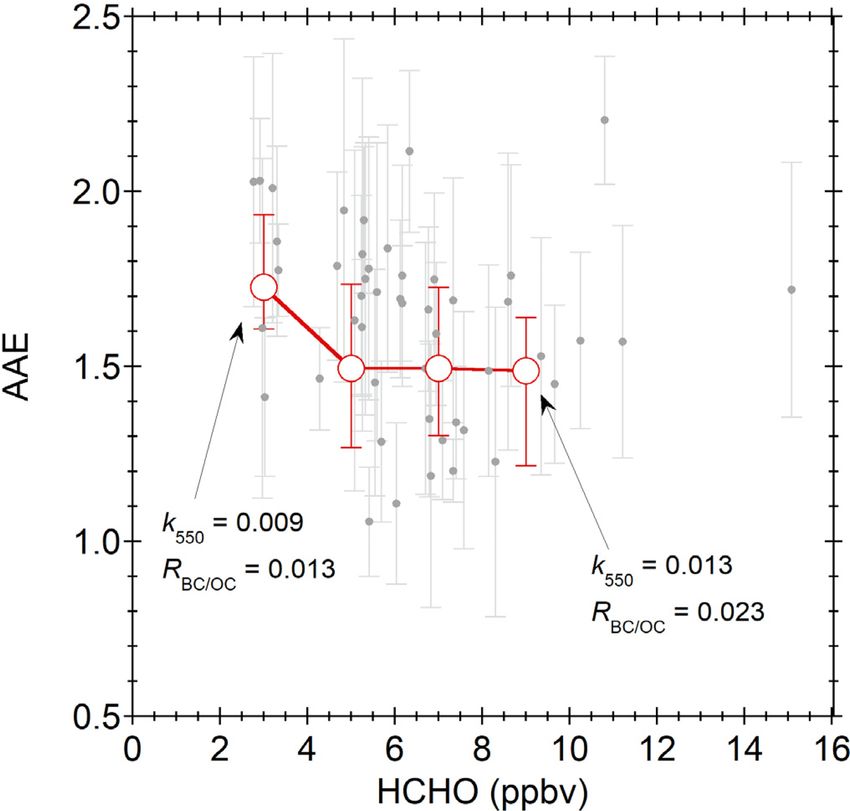
H. Irie et al.: Simultaneous observations by sky radiometer and MAX-DOAS for characterization of BB                              601

with the following equations.                                       embedded in a temperature-controlled box to record high-
                                                                    resolution spectra (with the full width at half maximum of
AAOD (λ) = AOD (λ) · [1 − SSA (λ)]                       (1)        around 0.3–0.4 nm and the oversampling of 3–4) from 310 to
          q
                                                                    515 nm. Measurements were made at six elevation angles of
εAAOD(λ) = [(1 − SSA (λ)) · εAOD ]2 + (AOD (λ) · εSSA )2 (2)
                                                                    2, 3, 4, 6, 8, and 70◦ every 30 min. Instead of 90◦ , the 70◦ el-
For the estimate of εAAOD(λ) , uncertainties for AOD(λ) and         evation angle was adopted as reference to reduce a variation
SSA(λ) (εAOD and εSSA ) were assumed to be 0.01 and 0.05,           range of signals measured at all the elevation angles, while
respectively, based on comparisons by Mok et al. (2018).            the integration time was kept constant. MAX-DOAS off-axis
Since the comparisons by Mok et al. (2018) were made using          elevation angle measurements were limited to below 10◦ for
independent measurements having uncertainties of the same           minimizing the possible systematic error in oxygen collision
order of magnitude, the actual uncertainties in sky radiome-        complex fitting results but keeping the measurement sensitiv-
ter AOD and SSA data would be smaller. AAE is calculated            ity in the lowest layer of vertical profiles retrieved high (Irie
as the slope of the linear fit of ln[AAOD(λ)] versus ln(λ):         et al., 2015).
                                                                       Spectral analysis by the so-called DOAS method (Platt
ln [AAOD (λ)] = a − AAE · ln(λ),                             (3)    and Stutz, 2008) for spectral fitting using the nonlinear least-
                                                                    squares method and the subsequent vertical profile retrievals
where a is an intercept. This equation is equivalent to expres-     using the optimal estimation method were performed by our
sion using the power law:                                           retrieval algorithm, JM2 (Japanese MAX-DOAS profile re-
                                                                    trieval algorithm, version 2) (e.g., Irie et al., 2008, 2011,
AAOD (λ) = Kλ−AAE ,                                          (4)
                                                                    2015). Using the recorded high-resolution UV–visible spec-
where K is a constant. To exclude AAE data associated               tra from 310 to 515 nm, the JM2 allows us to retrieve lower-
with large uncertainty, only the data that satisfy the crite-       tropospheric vertical profile information for eight quantities,
ria that (1) AAOD(λ) exceeds εAAOD(λ) for all wavelengths           including HCHO, CHOCHO, nitrogen dioxide (NO2 ), and
and (2) the correlation coefficient of the linear fit (R) is high   H2 O concentrations, which are analyzed below. We used fit-
(−1.0 ≤ R ≤ −0.9) are used in the analysis below. To refine         ting windows and cross-section data identical to those de-
the data set of AOD, SSA, AAOD, and AAE with reduced                scribed by Irie et al. (2011, 2015) and Hoque et al. (2018a).
uncertainty, the daily mean and its standard deviation with         The residual for DOAS fitting was usually as low as below
more than four data were calculated for 09:00–15:00 LT.             10−3 . In the vertical profile retrieval, the elevation angle set-
                                                                    ting was fully considered in the computation of differential
2.2   MAX-DOAS observation of trace gases                           air mass factors (e.g., Irie et al., 2011, 2015). The input pa-
                                                                    rameters used for the vertical profile retrievals are the same as
The MAX-DOAS is an instrument measuring UV–visible                  those used by Irie et al. (2015) for Cabauw, the Netherlands.
spectra of scattered sunlight at several elevation angles be-       The degrees of freedom for signal for trace gas vertical pro-
tween the horizon and zenith (e.g., Hönninger and Platt,            files retrieved here were usually 1–2. Of vertical profiles re-
2002; Hönninger et al., 2004; Irie et al., 2015). Its mea-          trieved, the present study analyzed data for a layer of 0–1 km,
surement is based on the well-established DOAS technique            which corresponds to the lowest layer with the highest sensi-
that quantitatively detects narrow band absorption by trace         tivity owing to the longest light path in profiles retrieved by
gases by applying the Lambert–Beer law (e.g., Platt and             JM2. The total uncertainties, including random and system-
Stutz, 2008). Since the pioneering study by Hönninger and           atic errors, were estimated to be 24 % (HCHO), 19 % (CHO-
Platt (2002) and Hönninger et al. (2004), various types of          CHO), 15 % (NO2 ), and 18 % (H2 O) (Irie et al., 2011). For
instruments and algorithms for MAX-DOAS have been de-               HCHO (CHOCHO, NO2 , and H2 O) retrievals, the systematic
veloped worldwide. One of the reasons for this is because           error was estimated by conducting additional retrievals as
ground-based MAX-DOAS observations at a low elevation               JM2 aerosol retrieval uncertainties of 50 % (30 %), in which
angle provide enhanced signals of concentrations of impor-          uncertainty due to assuming fixed SSA values should be in-
tant trace gases in the boundary layer (i.e., around the instru-    cluded (Irie et al., 2008, 2011; Hoque et al., 2018a, b). Using
ment altitude) and the concentrations can be interpreted as         the retrieved H2 O concentration, the relative humidity over
being the average over a distance, which is on the same order       water (RHw ) for the layer at 0–1 km was estimated using
of or finer than the horizontal resolution of models and satel-     NCEP (National Centers for Environmental Prediction) pres-
lite observations but coarser than that of in situ observations     sure and temperature reanalysis data (2.5◦ grid and 6-hourly).
(Irie et al., 2011).                                                To be consistent with sky radiometer data, the daily mean
   From January to April 2016, our MAX-DOAS system                  values for 09:00–15:00 LT are analyzed in this study. More
(Prede Co., Ltd) (Irie et al., 2011; Hoque et al., 2018a, b) was    detailed descriptions about MAX-DOAS, including fitting
operated continuously at the SKYNET Phimai site together            windows and cross-section data, are given by Irie et al. (2011,
with the sky radiometer. It was combined with the spectrome-        2015), Hoque et al. (2018a, b), and references therein.
ter Maya2000 Pro (Ocean Optics, Inc.) (with a slit of 25 µm)

www.atmos-meas-tech.net/12/599/2019/                                                     Atmos. Meas. Tech., 12, 599–606, 2019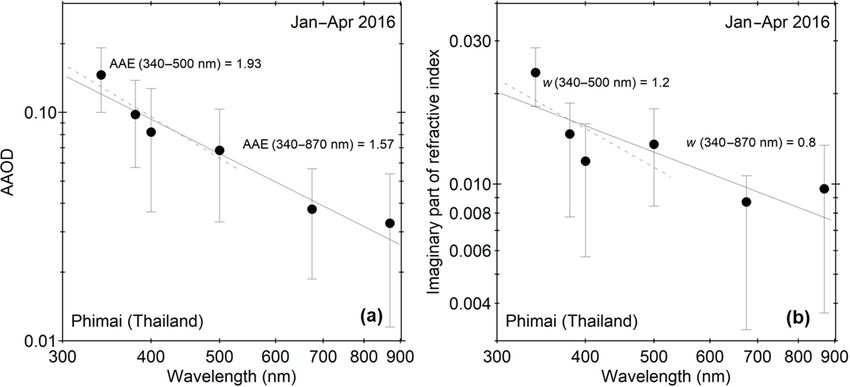
602 H. Irie et al.: Simultaneous observations by sky radiometer and MAX-DOAS for characterization of BB
3 Results and discussion
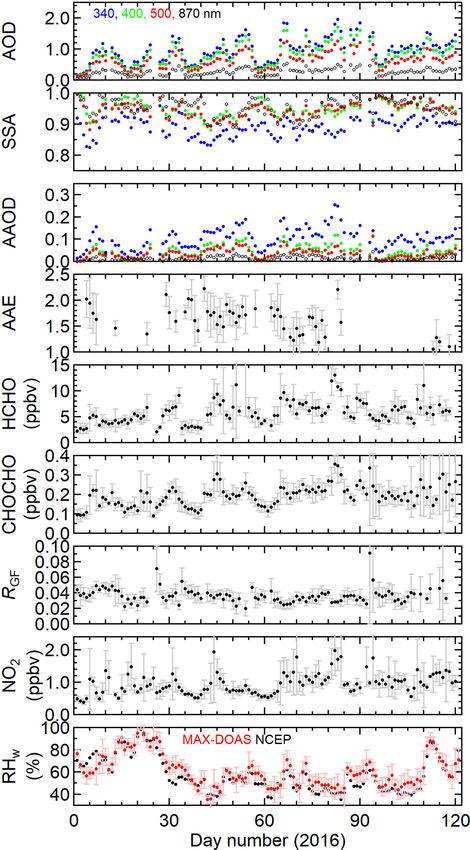
Time series of multiple components retrieved from sky ra-
diometer and MAX-DOAS observations at the SKYNET
Phimai site for the intense biomass burning period from Jan-
uary to April 2016 is shown in Fig. 1. As seen in Fig. 1, RHw
for a layer of 0–1 km derived from MAX-DOAS observa-
tions and the surface RHw from NCEP data confirm that the
period was dry around Phimai, particularly from the begin-
ning of February through the middle of April (from days 32
to 110). For the period of January–April 2016, mean AOD
values at 340, 500, and 865 nm were high at 0.98 ± 0.41,
0.64 ± 0.27, and 0.27 ± 0.11, respectively. The AOD values
reached the peak in late March (around days 80–85), when
AAOD values and HCHO, CHOCHO, and NO2 concentra-
tions were synchronously high. From Fig. 1, positive corre-
lations among them are suggested.
In Fig. 2, CHOCHO concentrations, ratios of CHOCHO
to HCHO concentrations (RGF ), NO2 concentrations, and
AAOD values are plotted against the HCHO concentration.
The RGF is important for atmospheric chemistry as it would
vary responding to different VOC emissions such as BB and
biogenic activities (e.g., Hoque et al., 2018a, b). HCHO was
chosen as a standard since its lifetime was likely compara-
ble to or longer than the other two potential BB-originating
trace gases investigated here (i.e., CHOCHO and NO2 ) (e.g.,
Li et al., 2013) and its variation range was larger than that
of the other two (Figs. 1 and 2). We found moderate tight
correlations between CHOCHO and HCHO concentrations
(a determination coefficient R 2 of ∼ 0.5 for linear fit). As
the HCHO concentration tripled from 3 to 9 ppbv, the RGF
decreased from ∼ 0.04 to ∼ 0.03 and the NO2 concentra- Figure 1. Time series of multiple components retrieved from sky
tion doubled from ∼ 0.6 to ∼ 1.2 ppbv, responding presum- radiometer and MAX-DOAS observations at Phimai, Thailand, for
ably to the increased contribution of VOC emissions from the intense BB period from January to April 2016. Daily means
BB. The RGF values are slightly greater than those reported for 09:00–15:00 LT are plotted. Their 1σ standard deviations are
by Hoque et al. (2018a, b), whose statistics included data shown by error bars. AOD, SSA, and AAOD values for different
wavelengths are shown in different colors. For RHw , red symbols
taken in the early morning and late evening, when RGF val-
indicate MAX-DOAS-derived RHw for a layer of 0–1 km and black
ues tended to be low compared to midday values analyzed symbols indicate the surface RHw from NCEP data.
in the present study. At a HCHO concentration of 9 ppbv,
AAOD at 340 nm reached as high as ∼ 0.15 ± 0.03. Much
larger AAODs were seen at a HCHO concentration higher
than 9 ppbv (Fig. 2). These results provide strong observa- 340 to 500 nm, the mean AAE was estimated to be 1.93 ±
tional evidence that aerosols in BB plumes (i.e., POA and 0.59 (Fig. 3). A larger AAE for a shorter-wavelength range
SOA) absorb UV radiation significantly. In addition, Fig. 2 was also reported by Chakrabarty et al. (2010) for BrC in tar
reveals that HCHO is a good tracer for absorption aerosols balls from smoldering biomass combustion. Also shown in
from BB, reflecting that BB caused clear enhancements of Fig. 3 are data of the imaginary part of the refractive index
both HCHO and absorption aerosols, when BB was the dom- (k) retrieved from sky radiometer observations, indicating a
inant source of HCHO and absorption aerosols over other strong wavelength dependence. The wavelength dependence
sources. was quantified similarly to Eq. (3) as the slope (w) of the
While BC has been shown to have an AAE of about unity linear fit of ln(k) versus ln(λ). The k values in the UV region
in literature, AAE values greater than unity are interpreted were as high as 0.01–0.03 but 1 order of magnitude smaller
as BrC (e.g., Kirchstetter et al., 2004). For the whole period than that of BC (∼ 0.71) (Bond and Bergstrom, 2005). Using
from January to April 2016, the mean AAE was estimated to the parameterization derived by Saleh et al. (2014) and the k
be 1.57 ± 0.28 for the entire wavelength region from 340 to value at 550 nm (k550 ) derived by interpolation in the present
870 nm (Fig. 3). Only for a shorter-wavelength range from study (∼ 0.012), the BC-to-OA ratio of the emissions from
Atmos. Meas. Tech., 12, 599–606, 2019 www.atmos-meas-tech.net/12/599/2019/H. Irie et al.: Simultaneous observations by sky radiometer and MAX-DOAS for characterization of BB 603 Figure 2. (a) CHOCHO concentration, (b) RGF , (c) NO2 concentration, and (d) AAOD values plotted as a function of HCHO concentration. AAOD values at 340, 400, and 870 nm are shown in blue, green, and black, respectively. The medians of respective quantities for each 2 ppbv bin of HCHO concentration are shown by open symbols. Error bars represent 67 % ranges. Figure 3. Spectra of (a) AAOD and (b) the imaginary part of refractive index for the period from January to April 2016. The power-law fitting results for 340–870 and 340–500 nm are shown by solid and dashed lines, respectively. Error bars represent 1σ standard deviations for each wavelength. www.atmos-meas-tech.net/12/599/2019/ Atmos. Meas. Tech., 12, 599–606, 2019
604             H. Irie et al.: Simultaneous observations by sky radiometer and MAX-DOAS for characterization of BB

BB (RBC/OA ) around Phimai was estimated to be 1.9 %. A
RBC/OA ratio of less than 1.9 % is suggested for smoldering
combustion of duffs investigated by Chakrabarty et al. (2010)
as their k550 value is smaller than that estimated for Phimai
in the present study.
   Since HCHO is a good tracer for absorption aerosols from
BB as mentioned above, it is interesting to investigate the
dependence of AAE on the HCHO concentration. We found,
however, that their correlations were weak and the AAE at a
HCHO of 3 ppbv (∼ 1.7) tended to be higher than the AAE
values at higher HCHO concentrations (∼ 1.5) (Fig. 4). Al-
though uncertainty in the estimate for the single datum of
daily mean AAE was as large as 0.3–0.5, it can be seen that
AAE tended to converge to 1.5 ± 0.2 at a higher HCHO con-
centration in BB plumes.
                                                                 Figure 4. AAE values plotted as a function of HCHO concentration.
   According to smog chamber experiments by Saleh et
al. (2014), aerosol absorptivity depends largely on burn con-
ditions, not fuel type. In addition, the size distribution and
the mixing state of BC and OA can be important factors for       mai site in central Thailand from January to April 2016 to
AAE (e.g., Russel et al., 2010; Kirchstetter et al., 2004). It   characterize optical properties of aerosols and organic gas
was also reported that non-absorbing shells over BC cores        concentrations in BB plumes. We found that the HCHO con-
can lead to an AAE greater or less than unity (Gyawali et        centration for a layer of 0–1 km retrieved from MAX-DOAS
al., 2009). Despite such a complexity in interpretation of       was a useful tracer for absorption aerosols from BB plumes,
the variation in AAE and the uncertainty in sky-radiometer-      when BB was the dominant source of HCHO and absorp-
retrieved AAE as large as 0.3–0.5, we attempted to inter-        tion aerosols over other sources. As the HCHO concentra-
pret possible enhancement in AAE at a HCHO of 3 ppbv.            tion tripled from 3 to 9 ppbv, the RGF decreased from ∼ 0.04
For this, using the parameterization of Salah et al. (2014)      to ∼ 0.03, in response presumably to the increased contri-
and the k550 values, the RBC/OC ratio for a low HCHO case        bution of VOC emissions from BB. In addition, AAODs
at 3 ppbv was calculated to be 0.013, which was smaller          increased with HCHO. At a HCHO of 9 ppbv, AAOD at
than the RBC/OC ratios at higher HCHO concentrations (e.g.,      340 nm reached as high as ∼ 0.15 ± 0.03. The AAE at 340–
0.023 at a HCHO of 9 ppbv) (Fig. 4). A smaller RBC/OC ra-        870 nm was about 1.5 ± 0.2, indicating the presence of BrC
tio can be attributed to the lower-temperature BB. In this       aerosols. The results from our multicomponent observations
case, the lower-temperature BB could yield only small val-       around central Thailand are expected to be unique constraints
ues of AOD, AAOD, HCHO, and CHOCHO (i.e., the mag-               for understanding physical–chemical–optical properties of
nitude of BB emissions was weak) but a high value of AAE         BB plumes.
of about 1.7 (i.e., as a result of a smaller RBC/OA ratio for
emissions) (Fig. 4). The other interpretation for the enhance-
ment in AAE at a HCHO of 3 ppbv is that we observed more         Code and data availability. The data and codes are available upon
photochemically aged BB plumes at smaller HCHO concen-           request to the corresponding author (hitoshi.irie@chiba-u.jp). The
trations. As the photochemical aging occurred, more SOA          sky radiometer and MAX-DOAS data are also available at http://
should have been produced, leading to stronger wavelength        atmos3.cr.chiba-u.jp/skynet/ (last access: 29 January 2019).
dependence of absorption. Considering a large uncertainty
in AAE data used here, further investigation using more data
from our multicomponent observations with a sky radiometer       Author contributions. HI designed the present study, performed ob-
                                                                 servation and analysis, and wrote the paper, with support from all
and MAX-DOAS is encouraged to better interpret the char-
                                                                 the authors. HMSH analyzed MAX-DOAS data. HO and AMF ana-
acteristics of BB plumes observed in this study. In addition,    lyzed sky radiometer data. TT and TJ supported observation at Phi-
the results presented here are expected to be unique con-        mai. AD and PH gave useful comments.
straints for understanding physical–chemical–optical proper-
ties of BB plumes.
                                                                 Competing interests. The authors declare that they have no conflict
                                                                 of interest.
4     Conclusions

We conducted ground-based remote-sensing observations us-        Special issue statement. This article is part of the special issue
ing a sky radiometer and MAX-DOAS at the SKYNET Phi-             “SKYNET – the international network for aerosol, clouds, and so-

Atmos. Meas. Tech., 12, 599–606, 2019                                                www.atmos-meas-tech.net/12/599/2019/
H. Irie et al.: Simultaneous observations by sky radiometer and MAX-DOAS for characterization of BB 605
lar radiation studies and their applications (AMT/ACP inter-journal Hönninger, G., von Friedeburg, C., and Platt, U.: Multi axis dif-
SI)”. It is not associated with a conference. ferential optical absorption spectroscopy (MAX-DOAS), At-
mos. Chem. Phys., 4, 231–254, https://doi.org/10.5194/acp-4-
231-2004, 2004.
Acknowledgements. Support from Vijak Pangsapa and the Bureau Hoque, H. M. S., Irie, H., and Damiani, A.: First MAX-DOAS ob-
of Royal Rainmaking in Agricultural Aviaion (BRRAA) is grate- servations of formaldehyde and glyoxal in Phimai, Thailand, J.
fully acknowledged. This work was supported by JSPS KAKENHI Geophys. Res., 123, 17, https://doi.org/10.1029/2018JD028480,
grant number JP16K00512, JSPS KAKENHI grant number 2018a.
JP15H01728, and JST CREST grant number JPMJCR15K4. Hoque, H. M. S., Irie, H., Damiani, A., Rawat, P., and Naja, M.:
First simultaneous observations of formaldehyde and glyoxal by
Edited by: Omar Torres MAX-DOAS in the Indo-Gangetic Plain region, SOLA, 14, 159–
Reviewed by: two anonymous referees 164, https://doi.org/10.2151/sola.2018-028, 2018b.
IPCC: Summary for Policymakers, in: Climate Change 2013: The
Physical Science Basis. Contribution of Working Group I to the
Fifth Assessment Report of the Intergovernmental Panel on Cli-
References mate Change, edited by: Stocker, T. F., Qin, D., Plattner, G.-K.,
Tignor, M., Allen, S. K., Boschung, J., Nauels, A., Xia, Y., Bex,
Bond, T. C. and Bergstrom, R. W.: Light absorption by carbona- V., and Midgley, P. M., Cambridge University Press, Cambridge,
ceous particles: an investigative review, Aerosol Sci. Tech., 39, UK and New York, NY, USA, 2013.
1–40, 2005. Irie, H., Kanaya, Y., Akimoto, H., Iwabuchi, H., Shimizu, A.,
Bond, T. C., Doherty, S. J., Fahey, D. W., Forster, P. M., Berntsen, and Aoki, K.: First retrieval of tropospheric aerosol profiles
T., DeAngelo, B. J., Flanner, M. G., Ghan, S., Kärcher, B., Koch, using MAX-DOAS and comparison with lidar and sky ra-
D., Kinne, S., Kondo, Y., Quinn, P. K., Sarofim, M. C., Schultz, diometer measurements, Atmos. Chem. Phys., 8, 341–350,
M. G., Schulz, M., Venkataraman, C., Zhang, H., Zhang, S., https://doi.org/10.5194/acp-8-341-2008, 2008.
Bellouin, N., Guttikunda, S. K., Hopke, P. K., Jacobson, M. Irie, H., Takashima, H., Kanaya, Y., Boersma, K. F., Gast,
Z., Kaiser, J. W., Klimont, Z., Lohmann, U., Schwarz, J. P., L., Wittrock, F., Brunner, D., Zhou, Y., and Van Roozen-
Shindell, D., Storelvmo, T., Warren, S. G., and Zender, C. S.: dael, M.: Eight-component retrievals from ground-based MAX-
Bounding the role of black carbon in the climate system: A sci- DOAS observations, Atmos. Meas. Tech., 4, 1027–1044,
entific assessment, J. Geophys. Res.-Atmos., 118, 5380–5552, https://doi.org/10.5194/amt-4-1027-2011, 2011.
https://doi.org/10.1002/jgrd.50171, 2013. Irie, H., Nakayama, T., Shimizu, A., Yamazaki, A., Nagai,
Campanelli, M., Estelles, V., Tomasi, C., Nakajima, T., Malvestuto, T., Uchiyama, A., Zaizen, Y., Kagamitani, S., and Matsumi,
V., and Martinez-Lozano, J. A.: Application of the SKYRAD im- Y.: Evaluation of MAX-DOAS aerosol retrievals by coin-
proved Langley plot method for the in situ calibration of CIMEL cident observations using CRDS, lidar, and sky radiome-
sun-sky photometers, Appl. Optics, 46, 2688–2702, 2007. ter inTsukuba, Japan, Atmos. Meas. Tech., 8, 2775–2788,
Chakrabarty, R. K., Moosmüller, H., Chen, L.-W. A., Lewis, K., https://doi.org/10.5194/amt-8-2775-2015, 2015.
Arnott, W. P., Mazzoleni, C., Dubey, M. K., Wold, C. E., Hao, Khatri, P. and Takamura, T.: An algorithm to screen cloud affected
W. M., and Kreidenweis, S. M.: Brown carbon in tar balls from data for sky radiometer data analysis, J. Meteor. Soc. Jpn., 87,
smoldering biomass combustion, Atmos. Chem. Phys., 10, 6363– 189–204, 2009.
6370, https://doi.org/10.5194/acp-10-6363-2010, 2010. Khatri, P., Takamura, T., Nakajima, T., Estellés, V., Irie, H.,
Gyawali, M., Arnott, W. P., Lewis, K., and Moosmüller, H.: In situ Kuze, H., Campanelli, M., Sinyuk, A., Lee, S. -M., Sohn, B.
aerosol optics in Reno, NV, USA during and after the summer J., Padhithurai, G., Kim, S. -W., Yoon, S. C., Lozano, J. A.
2008 California wildfires and the influence of absorbing and non- M., Hashimoto, M., Devara, P. C. S., and Manago, N.: Fac-
absorbing organic coatings on spectral light absorption, Atmos. tors for inconsistent aerosol single scattering albedo between
Chem. Phys., 9, 8007–8015, https://doi.org/10.5194/acp-9-8007- SKYNET and AERONET, J. Geophys. Res., 121, 1859–1877,
2009, 2009. https://doi.org/10.1002/2015JD023976, 2016.
Hammer, M. S., Martin, R. V., van Donkelaar, A., Buchard, V., Kirchstetter, T. W., Novakov, T., and Hobbs, P. V.: Evidence
Torres, O., Ridley, D. A., and Spurr, R. J. D.: Interpreting the that the spectral dependence of light absorption by aerosols is
ultraviolet aerosol index observed with the OMI satellite in- affected by organic carbon, J. Geophys. Res., 109, D21208,
strument to understand absorption by organic aerosols: implica- https://doi.org/10.1029/2004JD004999, 2004.
tions for atmospheric oxidation and direct radiative effects, At- Li, X., Brauers, T., Hofzumahaus, A., Lu, K., Li, Y. P., Shao,
mos. Chem. Phys., 16, 2507–2523, https://doi.org/10.5194/acp- M., Wagner, T., and Wahner, A.: MAX-DOAS measurements of
16-2507-2016, 2016. NO2 , HCHO and CHOCHO at a rural site in Southern China, At-
Hashimoto, M., Nakajima, T., Dubovik, O., Campanelli, M., Che, mos. Chem. Phys., 13, 2133–2151, https://doi.org/10.5194/acp-
H., Khatri, P., Takamura, T., and Pandithurai, G.: Develop- 13-2133-2013, 2013.
ment of a new data-processing method for SKYNET sky ra- Mok, J., Krotkov, N. A., Torres, O., Jethva, H., Li, Z., Kim, J., Koo,
diometer observations, Atmos. Meas. Tech., 5, 2723–2737, J.-H., Go, S., Irie, H., Labow, G., Eck, T. F., Holben, B. N., Her-
https://doi.org/10.5194/amt-5-2723-2012, 2012. man, J., Loughman, R. P., Spinei, E., Lee, S. S., Khatri, P., and
Hönninger, G. and Platt, U.: Observations of BrO and its vertical Campanelli, M.: Comparisons of spectral aerosol single scatter-
distribution during surface ozone depletion at Alert, Atmos. En-
viron., 36, 2481–2489, 2002.
www.atmos-meas-tech.net/12/599/2019/ Atmos. Meas. Tech., 12, 599–606, 2019606 H. Irie et al.: Simultaneous observations by sky radiometer and MAX-DOAS for characterization of BB ing albedo in Seoul, South Korea, Atmos. Meas. Tech., 11, 2295– Platt, U. and Stutz, J.: Differential Optical Absorption spectroscopy, 2311, https://doi.org/10.5194/amt-11-2295-2018, 2018. Principles and Applications, XV, 597 pp., 272 illus., 29 in color, Myhre, G., Samset, B. H., Schulz, M., Balkanski, Y., Bauer, S., Physics of Earth and Space Environments, Springer, Berlin, Ger- Berntsen, T. K., Bian, H., Bellouin, N., Chin, M., Diehl, T., many, ISBN 978-3-540-21193-8, 2008. Easter, R. C., Feichter, J., Ghan, S. J., Hauglustaine, D., Iversen, Russell, P. B., Bergstrom, R. W., Shinozuka, Y., Clarke, A. T., Kinne, S., Kirkevåg, A., Lamarque, J.-F., Lin, G., Liu, X., D., DeCarlo, P. F., Jimenez, J. L., Livingston, J. M., Rede- Lund, M. T., Luo, G., Ma, X., van Noije, T., Penner, J. E., Rasch, mann, J., Dubovik, O., and Strawa, A.: Absorption Angstrom P. J., Ruiz, A., Seland, Ø., Skeie, R. B., Stier, P., Takemura, T., Exponent in AERONET and related data as an indicator of Tsigaridis, K., Wang, P., Wang, Z., Xu, L., Yu, H., Yu, F., Yoon, aerosol composition, Atmos. Chem. Phys., 10, 1155–1169, J.-H., Zhang, K., Zhang, H., and Zhou, C.: Radiative forcing of https://doi.org/10.5194/acp-10-1155-2010, 2010. the direct aerosol effect from AeroCom Phase II simulations, At- Saleh, R., Robinson, E. S., Tkacik, D. S., Ahern, A. T., Liu, mos. Chem. Phys., 13, 1853–1877, https://doi.org/10.5194/acp- S., Aiken, A. C., Sullivan, R. C., Presto, A. A., Dubey, 13-1853-2013, 2013. M. K., Yokelson, R. J., Donahue, N. M., and Robinson, A. Nakajima, T., Tonna, G., Rao, R., Kaufman, Y., and Holben, B.: Use L.: Brownness of organics in aerosols from biomass burning of sky brightness measurements from ground for remote sens- linked to their black carbon content, Nat. Geosci., 7, 647–650, ing of particulate polydispersions, Appl. Optics, 35, 2672–2686, https://doi.org/10.1038/ngeo2220, 2014. 1996. Takamura, T. and Nakajima, T.: Overview of SKYNET and its ac- Nakajima, T., Yoon, S. C., Ramanathan, V., Shi, G. Y., Takemura, tivities, Opt. Pura Apl. 37, 3303–3308, 2004. T., Higurashi, A., Takamura, T., Aoki, K., Sohn, B. J., Kim, Uchiyama, A., Matsunaga, T., and Yamazaki, A.: The in- S. W., Tsuruta, H., Sugimoto, N., Shimizu, A., Tanimoto, H., strument constant of sky radiometers (POM-02) – Part 2: Sawa, Y., Lin, N. H., Lee, C. T., Goto, D., and Schutgens, N.: Solid view angle, Atmos. Meas. Tech., 11, 5389–5402, Overview of the Atmospheric Brown Cloud East Asian Re- https://doi.org/10.5194/amt-11-5389-2018, 2018. gional Experiment 2005 and a study of the aerosol direct ra- diative forcing in east Asia, J. Geophys. Res., 112, D24S91, https://doi.org/10.1029/2007JD009009, 2007. Atmos. Meas. Tech., 12, 599–606, 2019 www.atmos-meas-tech.net/12/599/2019/
You can also read