Quantitative Contributions of the Sources, Contamination and Ecological Risk of Heavy Metals in Soils from a Closed Coal Mine of Huaibei ...
←
→
Page content transcription
If your browser does not render page correctly, please read the page content below
Pol. J. Environ. Stud. Vol. 30, No. 5 (2021), 4299-4309
DOI: 10.15244/pjoes/132812                                                     ONLINE PUBLICATION DATE: 2021-06-11

          		                 			                         		                  		                      Original Research
          Quantitative Contributions of the Sources,
         Contamination and Ecological Risk of Heavy
           Metals in Soils from a Closed Coal Mine
             of Huaibei Coalfield, Eastern China

       Jiying Xu1, Herong Gui1*, Hongxia Fang2, Hongbao Dai3, Yan Guo1, Jiayu Chen2,
                           Chen Li2, Chen Chen2, Chunlei Wang2
             1
              School of Resources and Civil Engineering, Suzhou University, Suzhou, 234000 Anhui, China
   2
     School of Earth and Environment, Anhui University of Science and Technology, Huainan, 232001, Anhui, China
 3
   School of Environment and Surveying and Mapping Engineering, Suzhou University, Suzhou, 234000, Anhui, China

                                              Received: 22 November 2020
                                               Accepted: 25 January 2021

                                                          Abstract

                With the increasing number of closed mines, the geological environment problems around closed
            mines have become increasingly prominent, especially in terms of soil pollution. In this paper, a total
            of 32 topsoil samples were collected from Qianling closed coal mine and the contents of Cu, Zn, Co,
            Cr, Mn, As, Cd and Pb were analyzed. The results indicated that the contents Zn and As exceeded the
            surface soil background values of Anhui Province. Compared with the soil of production mines, the
            contents of Pb and Zn were higher. The assessment results of pollution and ecological risk of soil based
            on Nemerow index, Geological accumulation index and potential ecological risk assessment method
            showed that the closed coal mine was in the mild to moderate pollution and mild hazard ecological
            risk. The Pearson correlation and positive matrix decomposition model were applied to identify the
            sources of soil heavy metals, which included atmospheric dustfall (22.47%), natural factors (22.51%),
            agricultural activities (4.40%), transportation (8.90%) and industrial emissions (42.08%), respectively.

            Keywords: source analysis, ecological risk, soil heavy metals, closed coal mine, quantitative
            contributions

                     Introduction                                  a dominant position in China’s primary energy, and
                                                                   this situation can not be changed for a long time [1-
   China’s energy structure was low in oil and                     2]. Due to the long-term high-intensity mining of coal
gas, and relatively rich coal. Coal had always held                resources in China, some old mining areas tended to
                                                                   be exhausted and closed [3]. It was estimated that by
                                                                   2030, the number of closed/abandoned mines in China
                                                                   will reach 15000 [4]. During the mining, selection by
                                                                   washing, storage and transportation of coal resources,
*e-mail: guiherong@163.com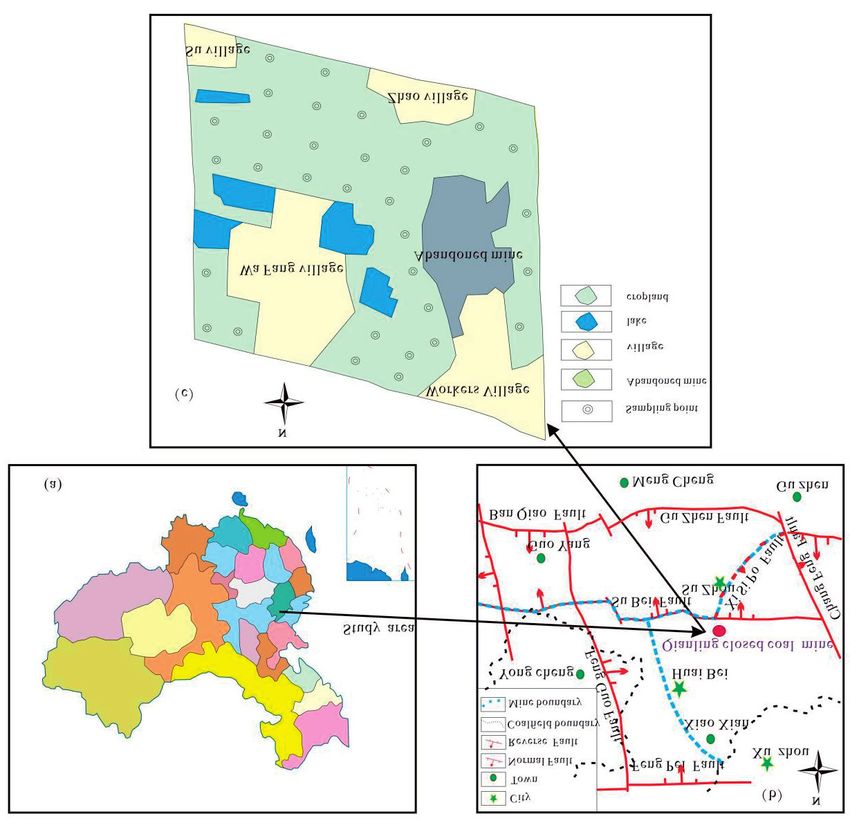
4300                                                                                                               Xu J., et al.

some pollutants (such as waste water, coal dust and                   PMF model [16-18]. In general, the authors have mostly
coal gangue, etc.) were easily discharged into the                    studied soil heavy metal pollution on production coal
surrounding environment. The pollutants entered the                   mines, and relatively few studies on closed/abandoned
soil through runoff, sedimentation and leaching, which                mines.
would lead to the enrichment of heavy metals in the soil                  The purpose of the present study was to provide
of the coal mine area [5], resulting in the soil around               scientific basis for environmental supervision, early
the closed/abandoned mine safety and environmental                    warning and treatment of soil in closed mining
issues [6]. Once the soil was contaminated by heavy                   area, which using quantitative contributions of the
metals, it would not only inhibit and poison the growth               sources, contamination and ecological risk of heavy
and development of plants, but also had a serious                     metals.
impact on the closure of the originally fragile ecological
environment around coal mining areas. It may also
endanger human health through the food chain and                                       Materials and methods
restrict local economic development [7].
    In recent years, predecessors have carried out a                             General Situation of the Study Area
large number of studies on heavy metal pollution and
environmental effects of coal mine soil, which mainly                     The Qianling Coal Mine was located in the Huaibei
focus on the content characteristics of heavy metals                  coal field of northern Anhui Province. It was built in
in coal mine soil, pollution (impact) assessment [8-11],              1971 and put into operation in 1983. It had a design
spatial differentiation [12-13], enrichment characteristics           capacity of 300,000 tons of raw coal per year [19] The
[14-15] and pollution source analysis etc. The method                 mine was closed in August 2015. The regional profile
of soil pollution source analysis is considered a central             and the location of the study area were shown in
issue and it is essential to select appropriate approaches            Fig. 1a) and Fig. 1b).
to identify the source. Several approaches that integrated                The soil types in the study area were mainly tidal
by Unmix model, Ensemble model, Isotropic model and                   soil, mortar black soil, silt black soil, green loess, etc.

Fig. 1. Geographical location and sampling point distribution map of the study area.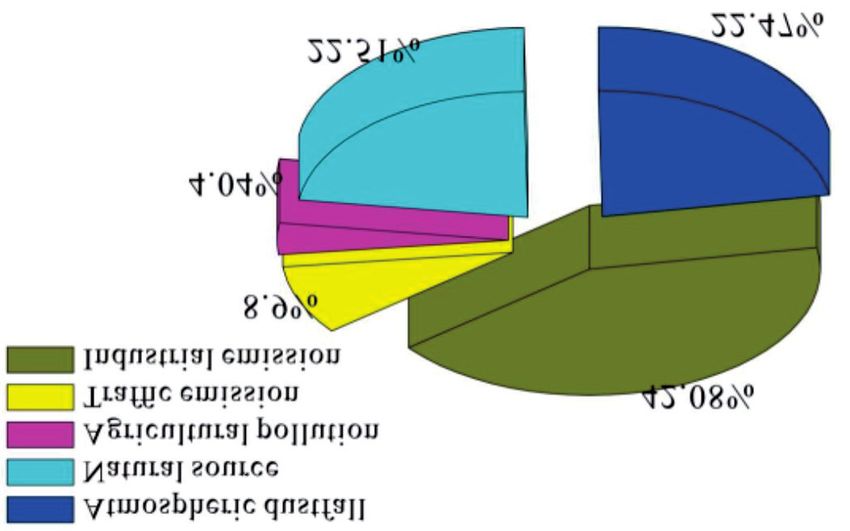
Quantitative Contributions of the Sources...                                                                                                    4301

The soil organic matter content was low, the structure                             Data Processing and Analysis Methods
was poor, and the arable property was good, which
belonged to the loose accumulation layer of Cenozoic.                                          Statistical Analysis
The study area had four distinct seasons, mild climate
and suitable rainfall. It had the typical warm zone and                         The IBM SPSS statistics 19.0 software was used
semi-humid monsoon climate characteristics of mid-                          to process and analyze the data, including descriptive
latitude regions. The rainfall was mainly concentrated                      statistical analysis of heavy metal elements and Pearson
in summer, and the winter was dry. The temperature                          correlation analysis. The EpaPMF5.0 software was used
changed greatly in spring and autumn. The annual                            to analyze the sources of heavy metals in soil. The
distribution of rainfall was uneven, mainly concentrated                    box diagram and histogram were drawn by Origin 8.0
in July to September, accounting for 75% of the annual                      software.
precipitation. The dominant wind direction in summer
was southeast wind, and the dominant wind direction in                                  Pollution Assessment Method
winter was northeast wind [20].                                                 Nemero Comprehensive Pollution Index Method

         Sample Collection, Processing and Testing                              Nemero comprehensive pollution index method
                                                                            takes into account the average value and maximum
    The grid distribution method was mainly used                            value of single factor pollution index. It is an evaluation
for the layout of sampling points, taking into account                      method that comprehensively considers the impact of
the surface water system and traffic roads in the mining                    various metals in soil on environmental quality [21-23].
area. A total of 32 sampling points were arranged.                          Its calculation formulas are (1) and (2). The evaluation
The distribution of sampling points was shown in                            standard of pollution degree is shown in Table 1.
Fig. 1c). The surface soil of 0-10 cm was collected
with stainless steel shovel, and the surface debris was                                             Pi = Ci / Si
removed, and then put it into a clean sealing bag,                                                                                                   (1)
labeled and the sampling point was positioned with
GPS instrument. After the samples were transported
back to the laboratory, they were dried by natural                                          Pn =
                                                                                                    (P ) + (P )
                                                                                                         i , ave
                                                                                                                   2
                                                                                                                            i , max
                                                                                                                                      2

air, crushed, passed through 60, 80, 100 and 200 mesh                                                                  2                             (2)
wooden nylon sieves in turn, and then the samples
were reduced to about 1kg by quartering method.                             ...where Pi is a single environmental quality index; Pn
The 5 g soil samples to be measured were accurately                         represents the Nemeiro comprehensive pollution index;
weighed by the analytical balance, and the samples to                       Ci is the measured element content; Si is the element
be tested were taken out after being pressed by 20 t                        reference standard content; Pi,ave is the average value of
tablet press.                                                               the element environmental quality index of the sampling
    The content of Cu, Zn, Co, Cr, Mn, As, Cd, and                          point; Pi,max is the maximum value of the environmental
Pb elements in the sample was determined by X-ray                           quality index of the sampling point.
fluorescence spectrometer (ICP-2000), and the soil
component analysis standard material (GBW07430,                                      Geological Accumulation Index Method
GSS-16) was detected, and the recovery rate ranged
from 86% to 115%, the relative deviation between                               The Geological accumulation index was proposed
samples is 5            Extreme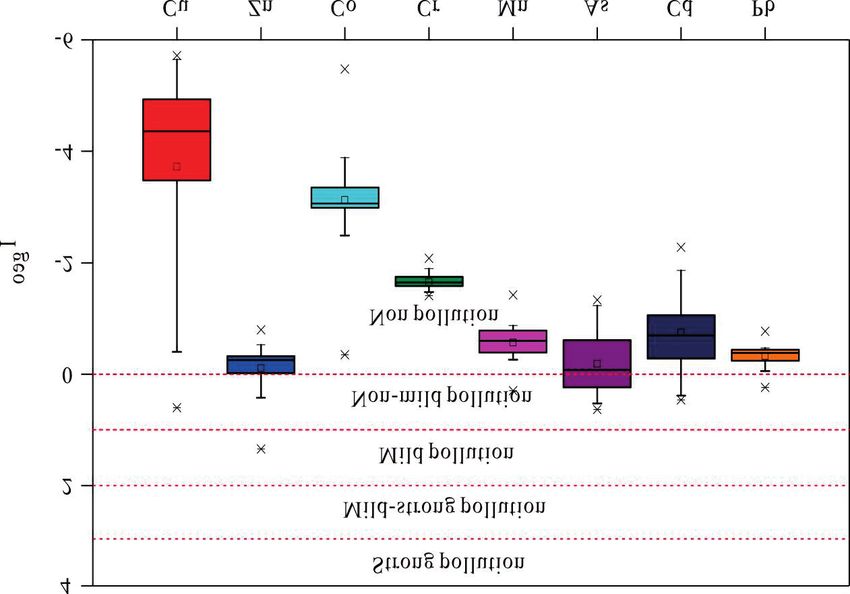
4302                                                                                                     Xu J., et al.

metal pollution is shown in Table 1, and the calculation
formula is (3).                                                      When c≤MDL,                                   (7)

                I geo = log 2 [Cn / K • Bn ]
                                                      (3)   When c>MDL,                                            (8)

...where Cn is the content of the element in the soil; Bn   ...where c is the concentration of elements in the sample;
is the reference value of the element. In this study, the   MDL is the detection limit of the determination method;
soil background value of Anhui Province is taken as         EF is the determination precision.
the reference value [25], and K represents the variation
coefficient of background value caused by diagenesis
(generally K = 1.5 ).                                                      Results and Discussion

       Potential Ecological Hazard Index Method                 Characteristics of Soil Heavy Metal Content

     The potential ecological risk index was used to            The statistical characteristics of the contents of
evaluate the potential risk, ecological sensitivity and     Cu, Zn, Co, Cr, Mn, As, Cd, and Pb of the 32 soil
toxicity of heavy metal concentration, reflecting the       samples were listed in Table 2. It can be seen that
pollution degree of single pollutant and even the           the order of the average content of heavy metals in
pollution level of mixed pollutants [26]. The formula is    the study area was Mn>Zn>Pb>Cr>As>Cu>Co>Cd.
(4).                                                        Except the average contents of Cu, Co, and Cr were
                                                            lower than the background values of Anhui Province,
                                                            the average contents of Zn, Mn, As, Cd, and Pb were
                                                            89.37 mg/kg, 544.29 mg/kg, 12.63 mg/kg, 0.10 mg/kg,
                                                      (4)
                                                            31.90 mg/kg, exceeding the soil background values
                                                            of Anhui Province, respectively 1.44, 1.03, 1.40,
...where RI is the potential ecological hazard index
                                                            1.03, and 1.20 times, indicating that these heavy
of multiple heavy metals; Eri represents the potential
                                                            metals had accumulated different degrees of pollution
ecological hazard index of a single heavy metal; Coi
                                                            accumulation, including Mn and Cd relatively were low,
means the actual measured value of elements; Cni is the
                                                            Pb, As and Zn were relatively high. Compared with
reference value of elements; Tri represents the toxicity
                                                            the soil pollution risk screening value of the currently
response coefficient of elements.
                                                            piloted "Soil Environmental Quality-Agricultural Land
                                                            Soil Pollution Risk Control Standard GB15618-2018"
           Pollution Source Analysis Method
                                                            [28], the average values of Cu, Zn, Co, Cr, Mn and Cd
                                                            were all lower than the soil pollution risk screening
    Positive matrix decomposition is a multi-element
                                                            value except for the Pb exceeding standard.
analysis technique that decomposes sample data
                                                                The coefficient of variation can reflect the degree
into two matrices of factor contribution and factor
                                                            of dispersion of the data. According to Wilding's
distribution. Its main advantage is to correlate the
                                                            classification of the degree of variation [29], it could
sample size and estimated uncertainty with the
                                                            be seen that Zn, Mn, and As (35.64%, 21.05%, 34.31%)
sample data to weight a single point, and to easily
                                                            were moderate variations (15%Cu>Cd, and compared with the heavy metals in
requires the uncertainty uij of the sample species
                                                            the wasteland of Sudong mining area [33] (production
concentration, and the calculation formulas are (7) and
                                                            mining area), Cr, Zn, Pb are in different order from As
(8).
                                                            and Cu. Compared with the soil in Sudong, Sunan and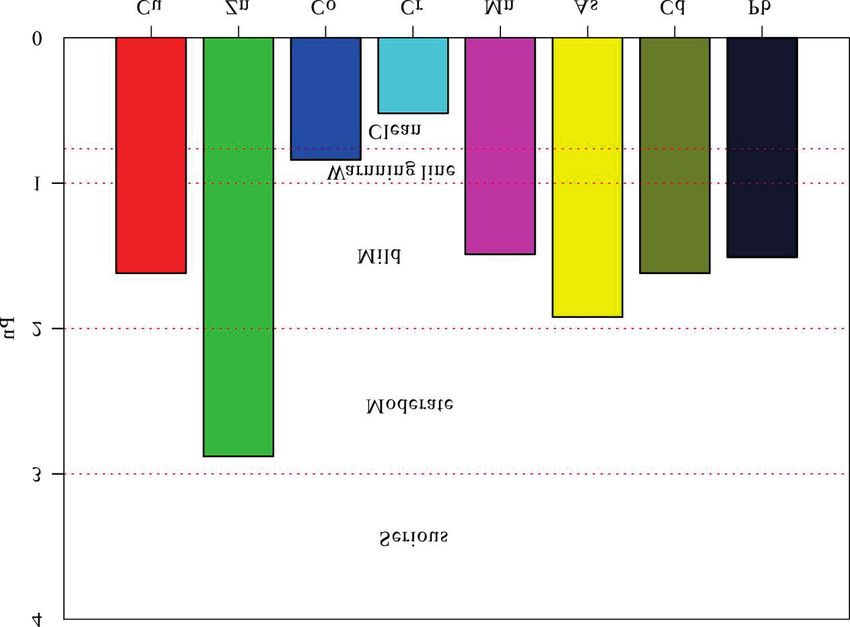
Quantitative Contributions of the Sources...                                                                                          4303

Table 2. Statistical characteristics of heavy metal content in soil samples.
                                                                                          Background values of      Chinese soil pollution
                   Range            Mean          Standard deviation    Coefficient of
  Element                                                                                   Anhui Province             risk screening
                  (mg·kg-1)       (mg·kg-1)           (mg·kg-1)         variation/(%)
                                                                                               (mg·kg-1)              values/(mg·kg-1)
     Cu           0.58~46.39        5.53                9.72              175.68%                   20.4                   100.00
     Zn         53.65~235.93       89.37                31.85                35.64%                 62.00                  250.00
     Co           0.55~19.15        3.25                2.97                 91.52%                 16.30                     -
     Cr          23.58~37.57       31.75                2.95                 9.31%                  66.50                  200.00
    Mn          296.34~977.31      544.29              114.55                21.05%                530.00                     -
     As           5.37~20.92       12.63                4.33                 34.31%                 9.00                    30.00
     Cd           0.03~0.20         0.10                0.04                 45.86%                 0.097                   0.30
     Pb          23.36~46.98       31.90                4.16                 13.04%                 26.60                    120

Table 3. Comparison of heavy metals content with production coal mine (mg·kg-1).
                  Area                      Cu         Zn       Co      Cr           Mn      As        Cd      Pb       Literature sources
          Study area (closed)              5.53      89.37      3.25   31.75     544.29     12.63      0.10   31.90         This study
          Local cultivated land            22.12     57.63       -     67.70          -     9.71       0.13   17.58            [30]
     Southern-Su ( production )            28.78     65.43       -     50.89     555.30       -        0.28   12.48            [31]
      Eastern-Su ( production )            26.16     63.68      9.12   69.33     457.74     14.99      0.08   28.99            [32]
       Linhuan ( production )              24.77     60.25             50.02                           0.28   27.10            [33]

Linhuan mining areas, it is found that the closed mines                          According to Table 1, the Nemerow index of all
had lower Cu and Cr, and significantly higher Pb and                         elements in the sample were greater than 0, in which
Zn contents. It was estimated that there were Pb and Zn                      the Nemerow index of Cr was 0.52, ranging from 0 to
pollution in the surface soil of the closed mine.                            0.72, which belonged to the clean; Cu, as, Cd, Pb, Mn,
    Liu [9] et al. analyzed the heavy metals in the soil                     Co exceeded the warning line and were in the light
of the East Coal Field and showed that the content of                        pollution level, in which the Nemerow index of Zn was
heavy metals in the soil around the coal mine was                            the highest of 2.88, belonging to moderate pollution.
affected by mining years, coal combustion, wind                              The Nemerow indexes were ranked as Zn (2.88)
direction, topography, slope direction, soil texture and                     >As (1.92)>Cd = Cu (1.62)>Pb (1.51)>Mn (1.49)>Co
human activities. The closed coal mine was an old                            (0.84)>Cr (0.52), as shown in Fig. 2.
mining area with long mining activities and significant                          According to the classification standard of pollution
accumulation of heavy metals. The soil in this mining                        level in Table 1 and formula (3), the Geological
area was dominated by fluvo-aquic soil and sand ginger                       accumulation index of Co and Cr were less than 0,
black soil, with heavy texture, poor permeability, low                       and they were in a Non-pollution state, indicating
degree of heavy metal leaching, and more heavy metals                        that the pollution risk of heavy metal elements in Co
attached to it. Considering that the closed mine is                          and Cr was low; Zn , As, Cd had a certain level of
located in the Huaibei coal field, the terrain was flat,                     accumulation, in which Zn was in Non-pollution, Non-
and the influence of terrain and slope can be basically                      Mild and Mild pollution state, and the proportions
ignored. The mining years, soil texture, wind direction                      of sample points accounted for 78.13%, 18.75%, and
and human activities had a significant impact on the                         3.13% of the total number of samples respectively.
distribution of heavy metal content in the closed mine.                      The pollution contribution of As was 46.88%, and that
                                                                             of Cd was 15.63%. The pollution levels of As and Cd
      Assessment of Soil Heavy Metal Pollution                               belonged to Non-Mild level. For Pb, Cu and Mn, only
                                                                             one abnormal sample point was in Non-Mild pollution
    Based on the background values of surface soil in                        level, and the rest were Non-pollution, as shown
Anhui Province, the Geological accumulation index,                           in Fig. 3. From the average value of the Geological
Nemerow comprehensive index and potential ecological                         accumulation index, the pollution degree of heavy
hazard index of soil samples in the study area were                          metal elements on the soil around the closed mine
calculated.                                                                  was in order: Zn>As>Pb>Mn>Cd>Cr>Co>Cu, which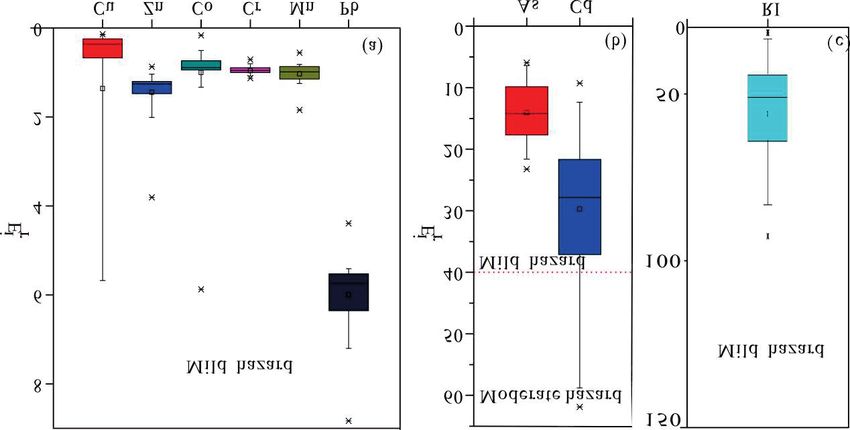
4304                                                                                                  Xu J., et al.

                                                           and Geological accumulation index will change due to
                                                           different evaluation standards, and their results have
                                                           a linear relationship with the content of heavy metals.
                                                           Therefore, the two methods are basically consistent
                                                           with the content analysis results [34]. The potential
                                                           ecological hazard index is weighted due to the toxic
                                                           effects of different heavy metals, and the environmental
                                                           ecological effects are linked with toxicology. The
                                                           evaluation results will be more focused on toxicological
                                                           aspects due to the toxicity coefficient. Based on the
                                                           three evaluation methods, it can be known that the
                                                           main control objects of heavy metals in the soil of the
                                                           Qianling closed mine were Zn, As, and Cd, and other
                                                           heavy metals need to be controlled.

Fig. 2. Histogram of Nemero comprehensive pollution          Source Analysis of Soil Heavy Metal Pollution
assessment.
                                                                            Correlation Analysis

was consistent with the analysis results of heavy metal        Studies have shown that there was a significant
content characteristics, indicating that the pollution     correlation between the contents of heavy metals, which
accumulation of Zn and As in the closed coal mine soil     could reflect that each element has the same source or
had occurred to a certain extent.                          geochemical process [35]. If there was a significant and
    According to Table 1 and formula (4), the potential    extremely significant correlation between the elements,
ecological risk index of Zn, As and Pb in 100% soil        it indicated that the elements generally had a certain
samples was in a mild risk state, and Cd was the most      homologous relationship or belonged to the compound
important potential ecological risk factor, with 18.75%    pollution situation.
and 81.25% of soil samples showing moderate and mild           Table 4 showed Pearson correlation coefficients of
hazards respectively (Fig. 4a, Fig. 4b). In general, the   8 heavy metals in surface soil of closed mine. It could
potential risk of soil heavy metals to the ecological      be seen from Table 4 that Mn-Co (r = 0.654), Zn-Cu
environment in the study area was at a mild level          (r = 0.520), Pb-Zn (r = 0.489) and Pb-Cu (r = 0.358)
(31.60
Quantitative Contributions of the Sources... 4305
Fig. 4. Box diagram of potential ecological risk assessment.
Pb, Zn and Cu may had the same source or similar metals in Zhundong coal mine soil, scholars pointed
geochemical process, while Mn and Co may had the out that As mainly came from industrial emissions, coal
same influence factors. According to the correlation combustion and transportation [9]. The previous studies
preliminary judgment, the sources of heavy metals in on emission characteristics of coal fired boilers showed
the study area were complex, and different sources of that As element accounted for 84.6% of raw coal content
heavy metals need further analysis. in fly dust from coal combustion [36]. The evaluation
of heavy metal pollution in farmland soils in the coal
Quantitative Contributions of the Sources Analysis mine-affected area of northern Bangladesh found that
coal mine dust containing sulfide mineral particles was
In order to further analyze the possible pollution deposited on the surface and releases As and other toxic
sources of heavy metals in the soil of the closed coal elements after oxidation [37]. The atmosphere is an
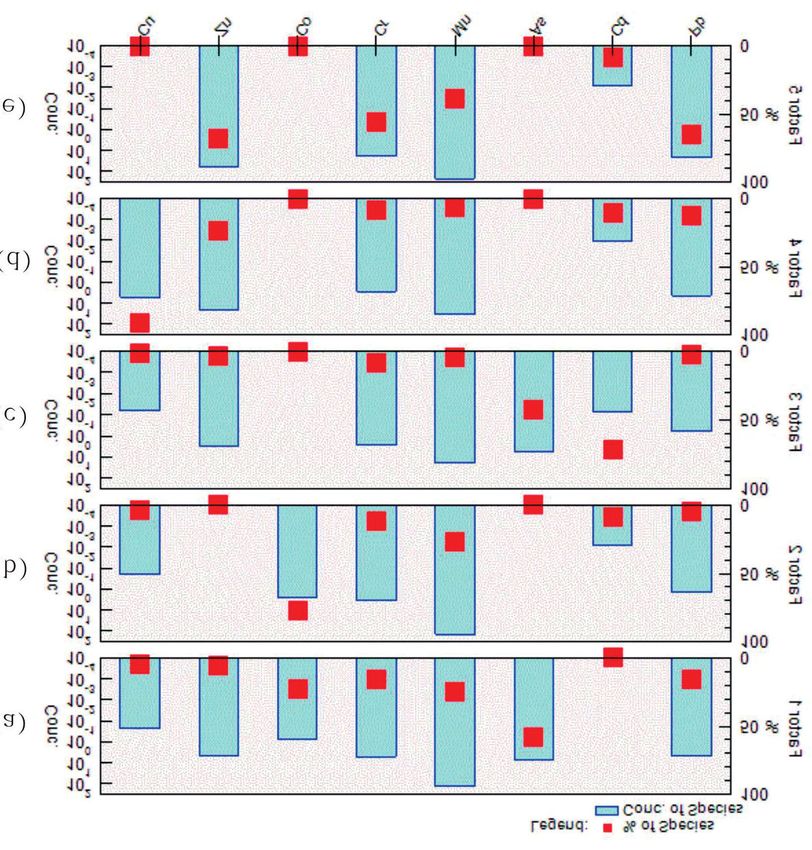
mine, the positive rectangular decomposition (PMF) important carrier of natural and man-made pollutants.
model was used to analyze heavy metal samples, and Atmospheric dust reduction may be an important way
the contribution ratio of eight elements was evaluated. for soil heavy metal enrichment. The Coal mine dust
The pollution sources and contribution ratios of the and fly ash deposited on the soil surface of mining area
eight heavy metals were shown in Fig. 5. for a long time after closing the mine, which caused
The main load element of factor 1 was As, which the accumulation of soil As in mining area. Therefore,
the load rate was 57.8%. Other elements had lower load factor 1 represented the source of atmospheric dustfall
rate (Fig. 5a). When analyzing the sources of heavy caused by mixed factors.
Table 4. The Pearson correlation analysis between elements.
Elements Cu Zn Co Cr Mn As Cd Pb
Cu 1
Zn .520** 1
Co 0.198 0.016 1
Cr 0.09 0.329 0.112 1
Mn 0.332 -0.084 .654** 0.265 1
As -0.286 -0.268 -0.177 -0.051 -0.103 1
Cd -0.01 0.056 0.037 0.209 -0.014 0.271 1
Pb .358* .489** -0.198 -0.231 -0.126 -0.289 -0.213 1
** the correlation was significant at 0.01 level (bilateral)
* the correlation was significant at 0.05 level (bilateral)4306 Xu J., et al.
Fig. 5. Source profiles and source contribution of soil heavy metal from PMF.
Factor 2 is dominated by Co (77.6%) and Mn (26.6%) agricultural activities, and the remaining 60% was
(Fig. 5b). The results of heavy metal pollution in the attributed to traffic and industrial emissions [39].
Sudong mining area found that natural factors such as In the actual agricultural production, irrigation and
soil parent material were the main source of Co-Mn fertilization was an indispensable part of the farmland
enrichment [32]. The basic statistical characteristics and around the mining area. The use of a large number of
correlation analysis of heavy metals in the soil showed chemical fertilizers led to the accumulation of Cd in
that the Co content was lower than the soil background the soil. Pollution assessment and correlation analysis
value in Anhui Province and was not polluted . The Mn showed that Cd and As had a certain accumulation level
content exceeded the standard by only 1.03 times, which in the soil of closed mining area, and the correlation
belonged to mild pollution, and there was a strong between Cd and As was significant. Therefore, factor 3
positive correlation between Co and Mn, indicating that was resolved as an agricultural pollution source.
natural factors were the main sources of Co and Mn in The main load elements of factor 4 were Cu (90.6%)
the study area. Therefore, factor 2 resolved to a natural and Zn (23.2%) ( Fig. 5d). Cu and Zn were the main
source. components of motor vehicle emissions [40-42], and
In factor 3, Cd (72.0%) and As (42.2%) contributed the wear of engine components and fuel or gasoline
the most (Fig. 5c). Research on the sources of Cd leakage may be the cumulative source of Cu [43]. As a
in China’s soil show that Cd mainly comes from fuel additive for automobiles, Zn came from tire wear
agricultural production activities [38]. The previous and road equipment [44], which entered the surface soil
studies have found that 40% of As in the environment through atmospheric dust [45]. The railway and road
may be related to the natural environment and on the west side of the Qianling closed coal mine wasQuantitative Contributions of the Sources... 4307
exceeded the background values of surface soil in
Anhui Province. Compared with the soil in Sudong,
Sunan and Linhuan mining areas, it is found that
the closed mines had significantly higher Pb and Zn
contents. It was estimated that there were Pb and Zn
pollution in the surface soil of the closed mine. The
assessment results of pollution and ecological risk of
soil showed that the closed coal mine was in the mild
to moderate pollution and mild hazard ecological risk,
in which Zn pollution degree was the largest, followed
by As. The Pearson correlation and positive matrix
decomposition model were applied to identify the
sources of soil heavy metals, which were atmospheric
Fig. 6. Pie chart of contribution proportion of pollution sources. dustfall (22.47%), natural factors (22.51%), agricultural
activities (4.40%), transportation (8.90%) and industrial
emissions (42.08%), respectively, of which 77.49% were
the main hubs of coal transportation. From mining to related to human activities.
closure for decades, the frequency of trains and cars was
high and the traffic volume was large. Transportation
was the main reason for the accumulation of Cu and Zn Acknowledgements
in the soil of Qianling closed mine. Therefore, factor 4
resolved to the traffic source. This article is funded by the Key natural science
The main load elements of factor 5 were Zn (67.8%), research projects of Suzhou University (2020yzd03,
Pb (65.3%), and Cr (55.9%) ( Fig. 5e). The vehicle 2020yzd07, 2019yzd01) and National Natural Science
emissions were cumulative sources of Cu and Zn; The Foundation of China (41773100, 41373095).
fuel combustion, gasoline additives, and engine led to
Pb emissions [46]. The high concentrations of Cr were
related to industrial activities, and industrial waste Conflict of Interest
treatment, sewage sludge, spills and residues all led
to Cr enrichment [47]. The evaluation and correlation The authors declare no conflict of interest.
analysis of soil heavy metal pollution showed that the
pollution level of Zn in the mining area was the highest
compared with other elements, and there was a strong References
positive correlation between Zn and Pb, and a significant
correlation between Zn and Cr. Before the mine closure, 1. YUAN L., JIANG Y.D., WANG K., ZHAO Y.X., HAO
the emissions from coal combustion, coal chemical X.J., XU C. Precision exploitation and utilization of closed/
industry, coal electricity metallurgy and other industrial abandoned mine resources in China. Journal of China Coal
activities caused soil Zn, Pb, Cr pollution. Therefore, Society, 43 (01), 14, 2018.
industrial emissions were the possible pollution sources 2. REN H., WU G.Q., ZHANG G.C., NING S.Z., ZHU
S.F., WANG X.J., HE X.L., LIANG Y.P. The Situation
of Zn, Pb and Cr.
Analysis and Strategy Research of Closed / Abandoned
According to the factor fingerprints of each heavy Mine Resources Comprehensive Utilization in China. Coal
metal element, the contribution proportion of each Geology of China, 31 (02), 1, 2019.
pollution source was calculated, as shown in Fig. 6. The 3. XUE D.H. Evaluation and Management of Impact
industrial emissions contributed the most to soil heavy of Closed Mine on Adjacent Production Mines. Coal
metals (42.08%), followed by natural source (22.51%), Technology, 39 (03), 107, 2020.
atmospheric dust source (22.47%), traffic source 4. ZHANG P., ZHANG J.P., WANG J. Research on Open-
(8.90%), and agricultural pollution source (4.04%). pit Coal Mine Geological Environment Problems and
In short, human activities were the dominant factors, Governance Program. Coal Technology, 35 (01), 320, 2016.
5. LI H.Z., ZHA J.F., YUAN Y.F. Research Status and
which 77.49% of the pollution was caused by human
Prospect of Hazards Caused by Close Coal Mine. Safety in
factors, especially coal mining, coal combustion, coal Coal Mines, 46 (05), 201, 2015.
chemical industry and other industrial activities were 6. XU D.J., SHAO D.S. Analysis of hydro logic geology
the main sources of heavy metals pollution in the study effects induced by closure of local small mines within
area. state-owned mine areas. China Coal, 40 (04), 41, 2014.
7. YANG J., WANG N. Assessment of Potential Ecological
Risk of Heavy Metals in Soils from Jia-Pi-Gou Gold Mine
Conclusions Area, China. Journal of Agro-Environment Science, 32
(03), 595, 2013.
8. DAI B., LÜ J.S., ZHAN J.C., ZHAN J.C., ZAHNG Z.L.,
The conclusions drawn from this research suggested
LIU Y., ZHOU Y.J. Assessment of Sources, Spatial
that the average contents of Zn, Mn, As, Cd and Pb Distribution and Ecological Risk of Heavy Metalsin Soils4308 Xu J., et al.
in a Typical Industry-based City of Shandong Province, 25. China National Environmental Monitoring Centre.
Eastern China. Environmental science, 36 (02), 507, 2015. Background values of soil elements in China.China
9. LIU S., WU Q.Y., CAO X.J., WANG J.N., ZHANG L.L., Environmental Science Press, China, 342, 1990.
CAI D.Q., ZHOU L.Y., LIU N. Pollution Assessment and 26. HAKANSON LARS. An ecological risk index for aquatic
Spatial Distribution Characteristics of Heavy Metals in pollution control.a sedimentological approach. Water. Res,
Soils of Coal Mining Area in Longkou City. Environmental 14 , 975, 1980.
science, 37 (01), 270, 2016. 27. IMIN B., ABLIZ A., SHI Q.D., LIU S.H., KAMUS N.,
10. ZHANG K., YANG J.J., BAI L., QIANG C.L., WANG LI H. Pollution and source identification of heavy metals
S.D. The characteristics and source apportionment of in surrounding soils of Eastern Junggar Coalfield based
heavy metal pollution in the soil at a coal chemical industry on PMF model. Transactions of the Chinese Society of
area in northwest China. Journal of Mining Science and Agricultural Engineering, 35 (09), 185, 2014.
Technology, 2 (02), 191, 2017. 28. Ministry of Ecology and Environment, PRC, & State
11. LIU W., YANG J.J., WANG J., WANG G., CAO Y.E. Administration for Market Regulation,Soil environmental
Contamination Assessment and Sources Analysis of Soil quality Risk control standard for soil contamination of
Heavy Metals in Opencast Mine of East Junggar Basin in agricultural land (GB15618-2018), 2018.
Xinjiang. Environmental Science, 37 (05), 1938, 2016. 29. CHANG Y.H., ZHAO Y.Y., CAO C., SHAN C., CAO Q.
12. SUN H., ZHOU C.C., XU Z.Y., WANG X.M. LIU G.J. Characteristics of heavy metals and assessment of health
Spatial distribution and environmental assessment of risk in different media of in the Dexing Copper Mine
heavy metals in soil of Huaibei Mining Area. Journal of Area. Acta geologica Sinica, 89 (05), 889, 2015.
China University of science and technology, 48 (07), 560, 30. YUAN, X.T., ZHANG C.L. Characteristics of Heavy
2018. Metal Content in Farmland Soils in Coal Mining Areas
13. HUANG D.W., GUI H.R. Sources Analysis and Content of Suzhou City, Environmental Chemistry, 30 (08), 1451,
Characteristics of Soil Heavy Metal in Sunan Mining 2011.
Area, China. Earth and environment, 45 (05), 5464, 2017. 31. HUANG D.W., GUI H.R. Distribution features and
14. XIONG S.,GUI H.R.,PENG W.H. Study on heavy metal internal relations of heavy metals in soil-maize system of
pollution characteristics of farmland soil in mining area. mining area, Anhui Province, Eastern China, Hum. Ecol.
Journal of Suzhou University, 31 (12), 102, 2016. Risk. Assess, 25 (3-4), 863, 2019.
15. FANG S.X. Pollution and health risk assessment of heavy 32. FANG H.X., GUI H.R., YU H., LI J., WANG M.C, JIANG
metals in soil around a smelter in ChangqingTown of Baoji Y.Q., WANG C.L. CHEN C. Characteristics and source
City. Environment Monitoring and Assessment, 33 (4), identification of heavy metals in abandoned coal-mining
121, 2015. soil, a case study of zhuxianzhuang coal mine in huaibei
16. AI J.C., WANG N., YANG J. Source apportion-ment of soil coalfield (anhui, china). Human and Ecological Risk
heavy metals in jiapigou goldmine based on the UNMIX Assessment, 16 (3), 1, 2020.
model. Environmental Science, 35 (9), 3530, 2014. 33. XIONG S., GUI H.R., LIN M.L.,PENG W.H. Contents
17. WANG Q., XIE Z.Y., LI F.B. Using ensemble models to and pollution characteristics of heavy metals in soil from
identify and apportion heavy metal pollution sources in coal mining area, a case study in Linhuan mining district,
agricultural soils on a local scale. Environmental Pollution, northern Anhui Province, Fresenius Environmental
206 (11), 227, 2015. Bulletin, 26, 1989, 2017.
18. LUO X.S., XUE Y., WANG Y.L., CANG, L., XU, B., 34. WANG S., HU G.R., YU R.L., YU W.H., ZHOU C.F.
DING, J. Source identification and apportionment of heavy Pollution assessment and source analysis of heavy metals
metals in urban soil profiles. Chemosphere, 127 (5), 152, in surface sediments from Jiulong River Estuary. Research
2015. of Environmental Sciences, 27 (10), 1110, 2014.
19. YAO D.X. Comparison research on No4.6 coal seam 35. HORVÁTHA M., VLADISLAVA B., HELTAI G.,
thickness and mineable test mining of Qian ling coal mine FLÓRIÁN K., FEKETE I. Study of application of BCR
in Anhui. Coal Technology of Northeast China, 2 (4), 3, sequential extraction procedure for fractionation of heavy
1999. metal content of soils, sediments, and gravitation dusts [J].
20. FANG T., XIE G.A., WANG B., ZHANG Q.L., XIE Toxicological & Environmental Chemistry Reviews, 92
S.Y., ZHOU X. Structural characteristics and formation (3), 429, 2010.
mechanism of Huaibei coalfield. Coal Geology and 36. GUO X., ZHEN C.G., CHEN D. Characterization of
Exploration, 45 (03), 1, 2011. Arsenic Emissions from a Coal-Fired Power Plant.
21. GUO X.X., LIU C.Q., ZHU Z.Z., WANG Z.L., LI J. Environmental science. 04, 631, 2006.
Evaluation method of heavy metal pollution in soil. 37. BHUIYAN M.A.H., DAMPARE S.B., ISLAM M.A.,
Chinese Journal of Ecology, 30 (05), 889, 2011. SUZUKI S. Source apportionment and pollution evaluation
22. FANG S.X., GAN Z.T., LI M.J., ZHANG Z.Q., ZHOU Q. of heavy metals in water and sediments of Buriganga
Progress of Assessment Methods of Heavy Metal Pollution River, Bangladesh, using multivariate analysis and
in Soil. Chinese Agricultural Science Bulletin, 26 (17), pollution evaluation indices. Environmental monitoring
310, 2010. and assessment, 187 (1), 4075, 2015.
23. LAMINE B.M., YOUCEF H., ALI L. Concentration, 38. SPIERS G. Trace element content of selected fertilizers
Distribution, and Potential Aquatic Risk Assessment of and dairy manures as determined by ICPeMS. Commun.
Metals in Water from Chott Merouane (Ramsar Site), Soil Sci. Plant Anal. 32, 139, 2001.
Algeria. Archives of Environmental Contamination and 39. MA W.C., TAI L.Y., QIAO Z., ZHONG L., ZHEN W.,
Toxicology, 77 (1), 127, 2019. FU K.X., AND CHEN G.Y. Contamination source
24. LI Z.Y., MA Z.W., YUAN Z.W., HUANG L. A review apportionment and health risk assessment of heavy metals
of soil heavy metal pollution from mines in China, in soil around municipal solid waste incinerator, A case
Pollution and health risk assessment. Science of the Total study in North China. Science of the Total Environment,
Environment, 468-469, 843, 2014. 631/632, 348, 2018.Quantitative Contributions of the Sources... 4309
40. BEGUM B.A., BISWAS S.K., HOPKE P.K. Key issues potentially toxic elements in road deposited sediments
in controlling air pollutants in Dhaka, Bangladesh. in residential and light industrial neighborhoods of
Atmospheric Environment, 45 (40), 7705, 2011. Singapore. Journal of Environmental Management, 101
41. PANT P., HARRISON R.M. Critical review of receptor (2), 151, 2012.
modelling for particulate matter, A case study of India. 45. JAIN S., SHARMA S.K., CHOUDHARY N., MASIWAL
Atmospheric Environment, 49 (3), 1, 2012. R., SHARMA C. Chemical characteristics and source
42. HJORTENKRANS D., BERGBAECK B.O., apportionment of PM2.5 using PCA/APCS, UNMIX, and
HAEGGERUD A. New metal emission patterns in road PMF at an urban site of Delhi, India. Environmental ence
traffic environments. Environmental Monitoring & & Pollution Research, 24 (17), 1, 2017.
Assessment, 117 (1-3), 85, 2006. 46. ZHAO L., XU Y.F., HOU H., SHANGGUAN, Y.X, LI,
43. CHENG Z., CHEN L.J., LI H.H., LIN J.Q., YANG Z.B., F.S. Source identification and health risk assessment
YANG Y.X., XU X.X., XIAN J.R., SHAO J.R., ZHU X.M. of metals in urban soils around the Tanggu chemical
Characteristics and health risk assessment of heavy metals industrial district, Tianjin, China [J]. Science of the Total
exposure via household dust from urban area in chengdu, Environment, 468/469, 654, 2014.
china. Science of the Total Environment, 619-620, 621, 47. CHEN H.Y., TENG Y.G, LU S.J, WANG Y.Y, WU
2017. J., WANG, J.S. Source apportionment and health risk
44. YUEN J.Q., OLIN P.H., LIM H.S., BENNER S.G., assessment of trace metals in surface soils of Beijing
SUTHERLAND R.A., ZIEGLER A.D. Accumulation of metropolitan, China [J]. Chemosphere, 144, 1002, 2016.You can also read