MCAS Spring 2019 Data and Analysis - Weston Public Schools
←
→
Page content transcription
If your browser does not render page correctly, please read the page content below
WESTON PUBLIC SCHOOLS

MCAS Spring 2019 Data and Analysis

                        Respectfully submitted by:
 J. Kimo Carter, Ed.D., Assistant Superintendent for Teaching & Learning
 Susan Erickson, Ed.D., Elementary Science/Social Studies Specialist, K-5
           Katharine Lemons, English Department Head, 6-12
          Tracy Manousaridis, Elementary Math Specialist, K-5
             Jim McLaughlin, Math Department Head, 6-12
           Katharine Odell, Elementary Literacy Specialist, K-5
             Stephen Ribisi, Science Department Head, 6-12

                    To the Weston School Committee
                            October 7, 2019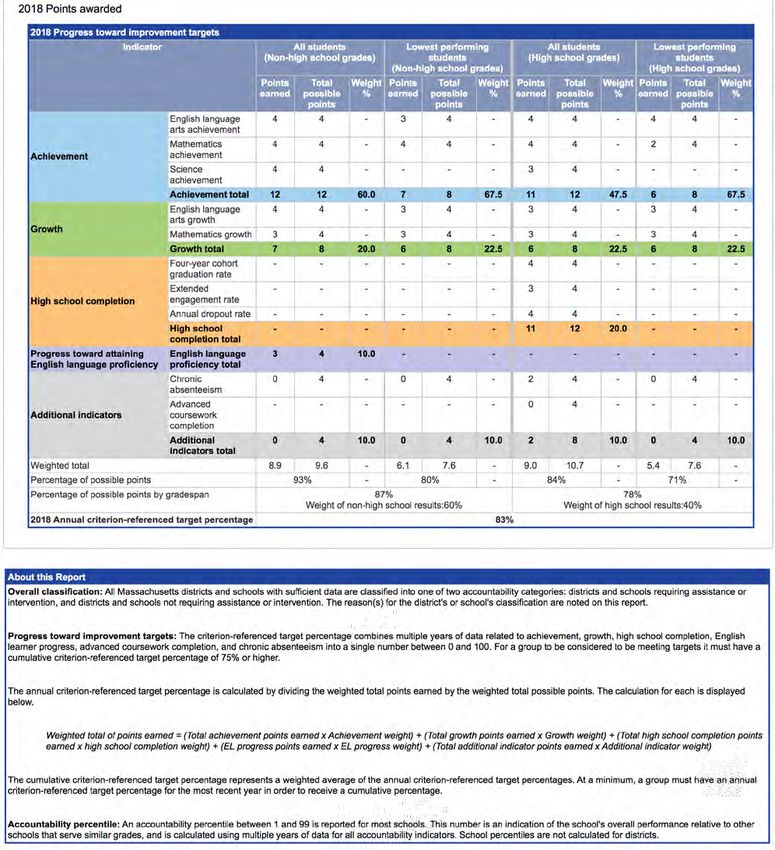
Table of Contents
Introduction                                                page 3

The Next Generation MCAS (MCAS 2.0)                         page 5

MCAS Student Performance Data
      MCAS Results by Achievement Level                     page 8

       MCAS District Achievement Distribution by Year      page 11

       MCAS District Achievement and Growth                page 18

MCAS Achievement Results by:
     Economic Status                                       page 23

       Disability Status                                   page 24

       Race/Ethnicity                                      page 26

MCAS District Rankings                                     page 30

Massachusetts’ School and District Accountability System   page 33

Accountability Reports
      Weston Public Schools                                page 36

       Weston High School                                  page 43

       Weston Middle School                                page 45

       Field School                                        page 47

       Country School                                      page 49

       Woodland School                                     page 51

Conclusion                                                 page 54

                                                2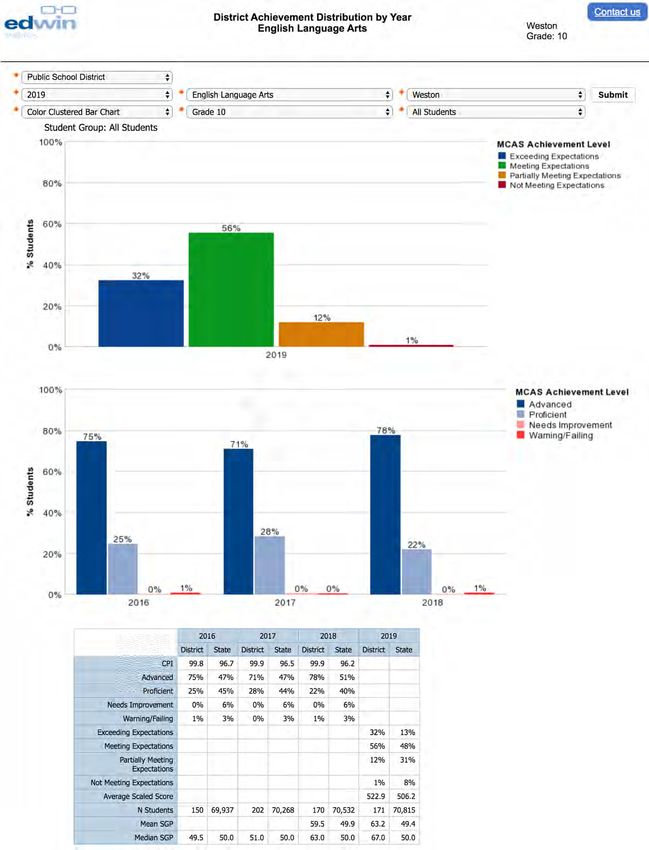
Introduction
This report provides an overview of student, grade-level, school, and district performance on the
2019 MCAS exams in English Language Arts (ELA), Mathematics, and Science and
Technology/Engineering. We analyze MCAS and other district accountability data to identify
areas of strength and opportunity for students, classrooms, grade levels, departments, schools,
and the district at-large. MCAS results represent one set of point-in-time data that, when
combined with other assessments, can inform instruction at a programmatic level as well as for
targeted instruction and intervention.

The 2018-2019 school year was the third year of Next Generation MCAS English Language Arts
and Mathematics testing for students in third through eighth grade. Additionally, 2018-19 was
the first year of Next Generation MCAS English Language Arts and Mathematics testing for
tenth grade students and the first year of Next Generation MCAS Science &
Technology/Engineering testing for fifth and eighth grade students. The only legacy MCAS tests
remaining are the high school science subject tests: Physics, Biology, and Chemistry. All MCAS
exams will be Next-Generation this coming spring, 2020. A detailed description of Next
Generation MCAS testing will follow in this report.

Now that we have results from three years of Next Generation MCAS testing in English and
Mathematics for grades 3-8, we can start tracking growth for individual students and cohorts
from year to year (as we have been doing with the legacy MCAS exams). In this report, not only
will we examine 2019 data in aggregate and by subgroup, we will also track growth from 2017
and 2018 for grade level cohorts and other subgroups of students. Additionally, we will
compare our MCAS results to other local school districts.

Last year, the Massachusetts Department of Elementary and Secondary Education (DESE)
introduced a new accountability system for schools and school districts that factors in
achievement and growth for all students, achievement and growth for our lowest-performing
students, high school completion rates, English learners’ progress toward proficiency, rates of
chronic absenteeism, and completion rates of advanced coursework in high school. When
taking all these factors into consideration, Weston High School, Weston Middle School, and
Field School all rank at the 96th percentile among similar schools in the state (Country and
Woodland schools were not ranked due to not having enough data.) Furthermore, DESE has
rated the Weston Public Schools with an overall criterion-referenced target percentage of 82%.
This complicated formula that measures Weston’s progress toward DESE goals puts the school
district comfortably within the “Meeting or Exceeding Targets” category. Finally, the five
schools have overall criterion-referenced target percentages, as denoted in the following table:

                                                  3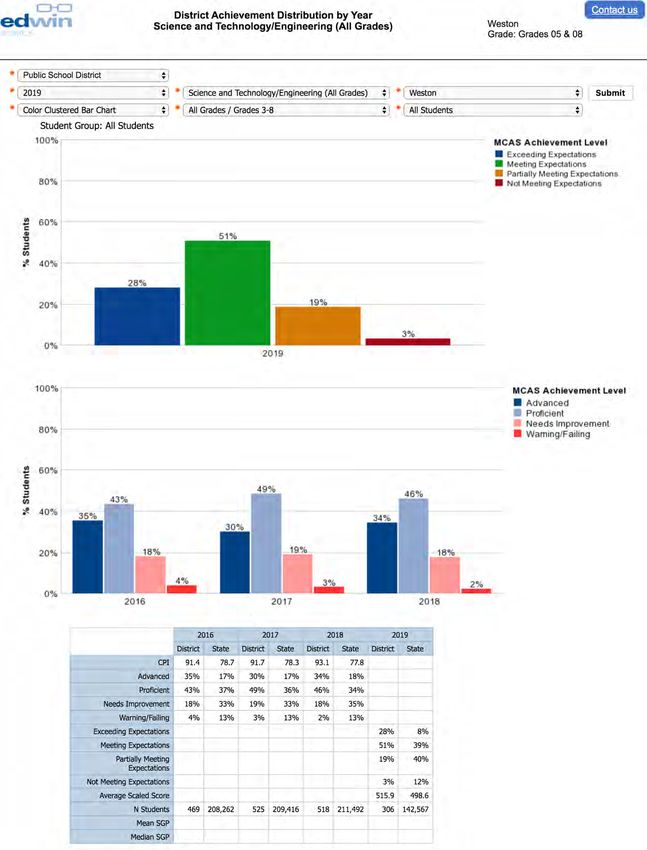
School               Accountability       Progress Toward                  Accountability
                      Percentile           Improvement Targets              Classification
 Country School       --                   98% -- Meeting or exceeding      Not requiring assistance
                                           targets                          or intervention
 Woodland             --                   100% -- Meeting or exceeding     Not requiring assistance
 School                                    targets                          or intervention
 Field School         96                   84% -- Meeting or exceeding      Not requiring assistance
                                           targets                          or intervention
 Weston Middle        96                   88% -- Meeting or exceeding      Not requiring assistance
 School                                    targets                          or intervention
 Weston High          96                   73% -- Substantial progress      Not requiring assistance
 School                                    toward targets                   or intervention
 Weston Public        --                   82% -- Meeting or exceeding      Not requiring assistance
 Schools                                   targets                          or intervention

In this report is a detailed description of the new accountability system for all public schools
and school districts in Massachusetts. Along with it will be an analysis of the accountability data
for each school and for the school district as a whole.

As you go through the MCAS and accountability data in this report, you will see points of
information and analysis accompanying each table, chart, or graph. These insights are provided
by district personnel who have spent much time combing through our MCAS data. They
include: Dr. Kimo Carter, Assistant Superintendent of Teaching and Learning; Jennifer Truslow,
Director of Student Services; Kate Lemons, 6-12 English Department Head; Katharine Odell, K-5
Literacy Curriculum Specialist; Jim McLaughlin, 6-12 Math Department Head; Tracy
Manousaridis, K-5 Math Curriculum Specialist; Stephen Ribisi, 6-12 Science Department Head;
and Dr. Susan Erickson, K-5 Science and Social Studies Curriculum Specialist. All made
significant contributions to this report.

                                                    4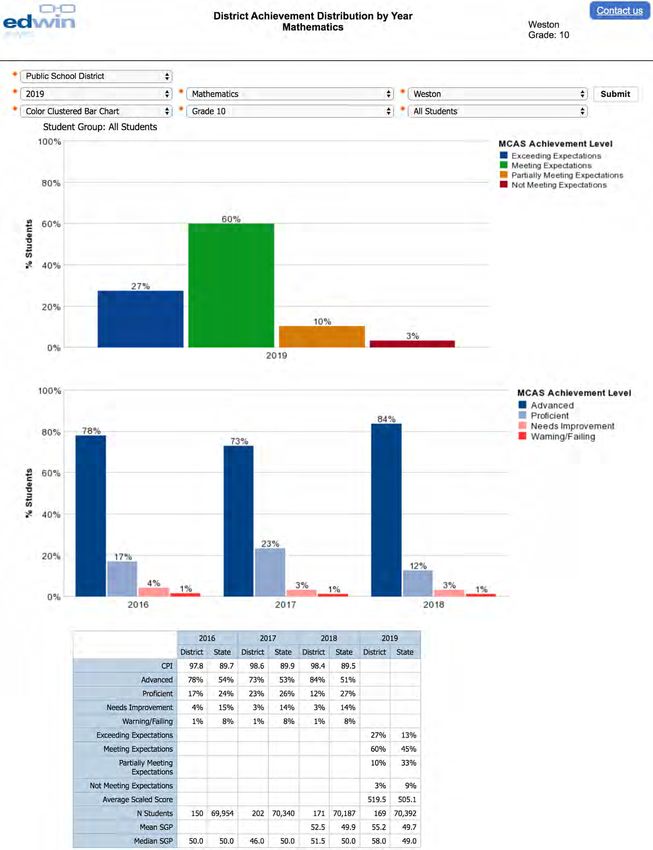
Background: The need to build the Next Generation MCAS
From www.doe.mass.edu/mcas/nextgen/default.htm

The MCAS tests, used in concert with ambitious learning standards, have played an important
role in district and school improvement over the past 20 years. Massachusetts’ K-12 public school
students lead the nation in academic achievement and are competitive internationally. That
success would not have been possible without a high-quality testing system that provides
feedback on student, school, district, and state achievement and progress.

However, the legacy MCAS was not designed to measure readiness for success in college or
career after high school. One statewide concern is that despite passing the legacy MCAS, a large
percentage of high school graduates still must take remedial courses for no credit during their
first year of college. Furthermore, state standards and standards of practice within the English
Language Arts, Mathematics, and Science and Technology/Engineering frameworks have become
more challenging, integrating content and practice much more seamlessly. It is difficult to assess
standards of practice through a traditional standardized assessment.

Now there is a much better understanding about learning progressions in mathematics, text
complexity and the interplay of reading and writing, and the academic expectations of higher-
education institutions and employers. Furthermore, all districts now have the technology to
conduct online testing, which allows test designers more flexibility when structuring items. All
these factors point to an upgrade of assessments for the next generation of students.

What is new about the Next Generation MCAS?
The Next Generation MCAS assessment system, also called MCAS 2.0 is an updated version of the
20-year old legacy MCAS system. Following are features of Next Generation MCAS:

     ●    Focuses on students’ critical thinking abilities, application of knowledge, and ability
          to make connections between reading and writing.
     ●    Gives clearer signals of readiness for the next grade level or college and career.
     ●    Is designed to be administered on a computer, and thus requires technology skills.
     ●    Contains universal accessibility features for all students, including highlighter,
          magnifier tracker, background color option, answer masking, and answer
          eliminator tools.
     ●    Contains designated accessibility features that can be used with any student at the
          discretion of the principal. These include test location, group size, seating
          preference, scheduling, noise buffer, and familiar test administrator.
     ●    First given in spring 2017 in grades 3-8 in English language arts and mathematics
     ●    Will replace all legacy MCAS tests in spring 2020.

                                                    5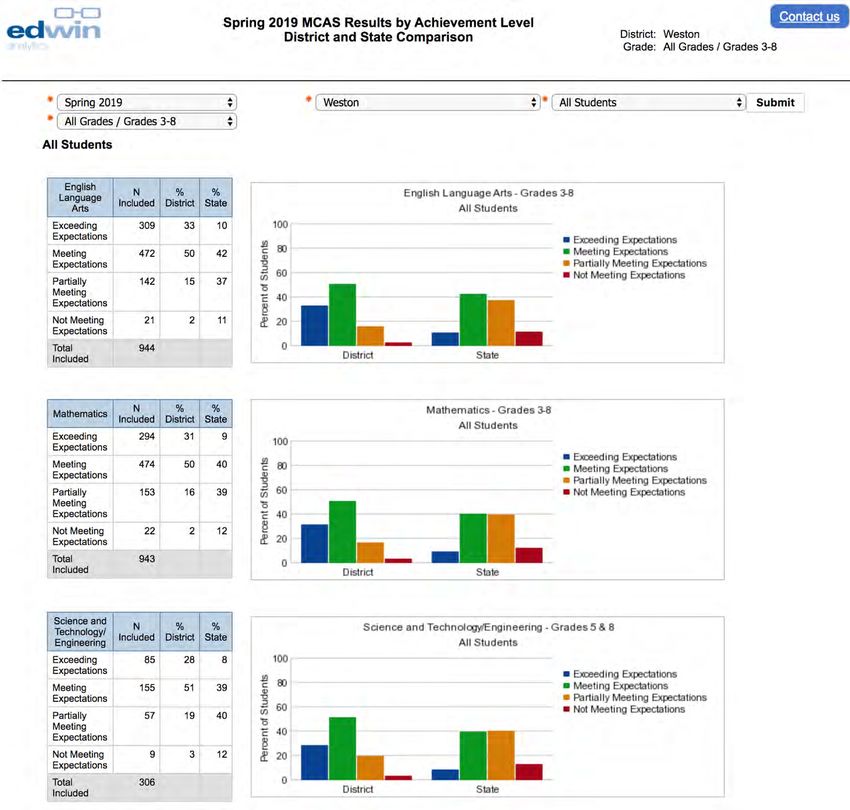
MCAS Achievement Levels: Distinctions Between Legacy and Next
Generation MCAS

Why would there be discrepancies in scores between Legacy and Next
Generation MCAS?

●   The new standards for Meeting Expectations on Next Generation MCAS are more rigorous
    than the standards for reaching the Proficient level on the legacy MCAS.
●   Massachusetts educators set new standards to help signal student readiness for the next
    grade level.
●   Spring 2017 is a baseline year for the Next Generation tests in grades 3-8, and spring 2017
    scores should not be compared to previous years’ scores.
●   Likewise, spring 2019 is the baseline year for new high school Next Generation exams in
    English Language Arts and Mathematics, and the Science & Technology/Engineering exams
    in grades 5 and 8.

                                                6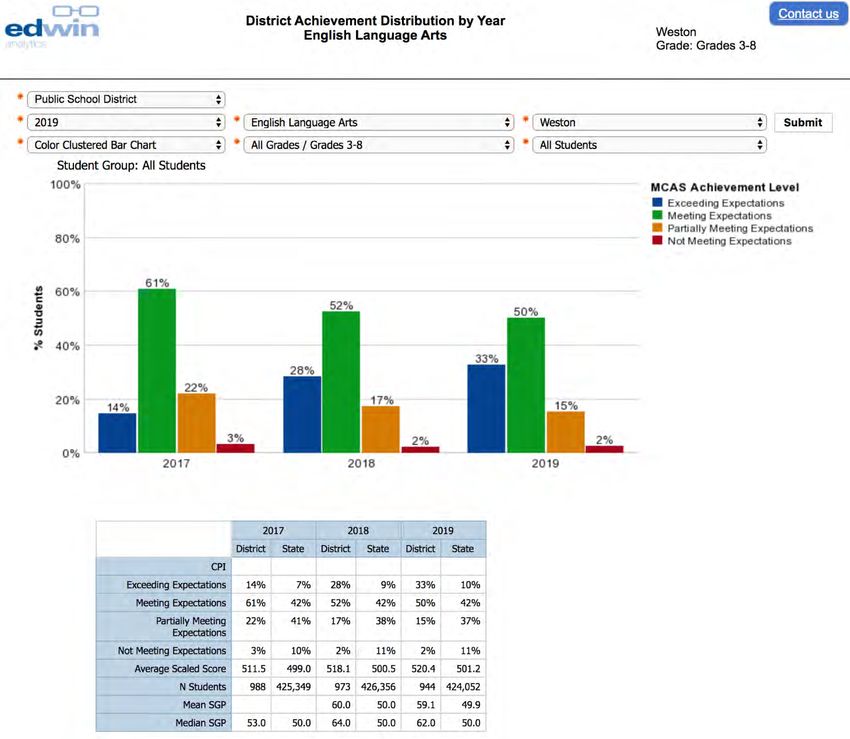
A Note on Passing Scores on the 10th Grade ELA and Mathematics
Next-Generation MCAS
DESE has established interim MCAS passing scores for students in the classes of 2021 and 2022 as
high schools adjust to the higher standards of the next-generation MCAS. The minimum score for
proficiency on the tenth grade English test is 472; the minimum score for proficiency on the tenth
grade Mathematics test is 486. A passing score for Physics, Biology or Chemistry remains at 220.
Students who have obtained proficiency in all three subjects have completed their MCAS
requirements for graduation.
Students in the classes of 2021 and 2022 who score between 455 and 471 in English Language
Arts or between 469 and 485 in Mathematics are eligible to graduate when they fulfill the
requirements of an Educational Proficiency Plan (EPP). Usually an EPP requires a student to take
follow-up courses in the subject area. In most cases, Weston High School’s graduation
requirements (4 years of English and 4 years of math) satisfy students’ EPP requirements.
Students in the classes of 2021 and 2022 who score under 455 in English Language Arts, under
469 in Mathematics, or under 218 in Science will have opportunities to retake the MCAS in their
Junior and Senior years so that they can meet their MCAS requirements for graduation.

                                                7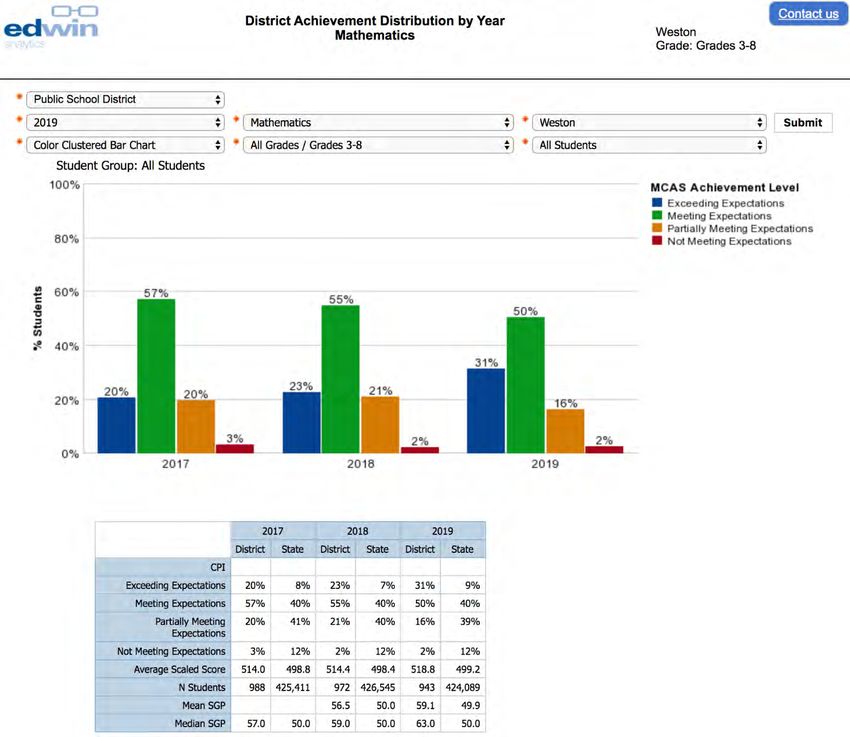
MCAS Results by Achievement Level
Grade 10 English and Mathematics (Next-Generation)
Grade 9-10 Science (Legacy)

                                     8
MCAS Results by Achievement Level
Grades 3-8 English Language Arts and Mathematics (Next-Generation)
Grades 5 and 8 Science and Technology/Engineering (Next-Generation)

                                     9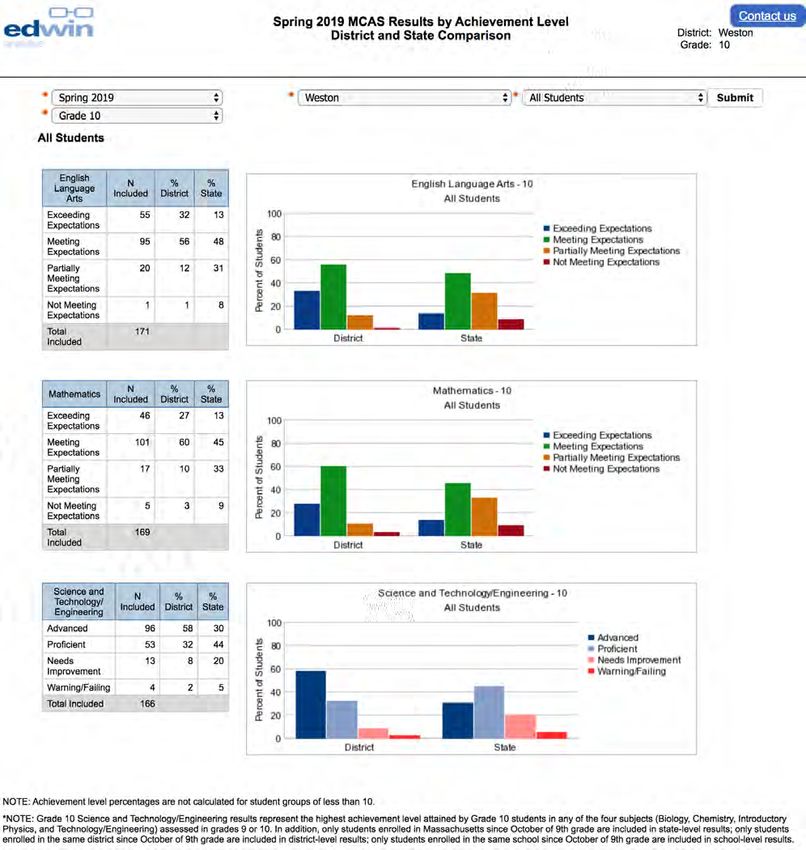
MCAS Results by Achievement Level
Noticings and Wonderings

  •   We notice that in English Language Arts, 32% of tenth grade students exceeded
      expectations, 56% met expectations, 12% partially met expectations, and 1% did not meet
      expectations. These scores are very high when compared to state averages: the
      percentage of Weston students exceeding expectations is over double the state average
      (32% vs. 13%); the percentage of Weston students not meeting or partially meeting
      expectations is one-third the state average (13% vs. 39%).
  •   We see similar patterns for students in grades 3-8 for English Language Arts. 33% of
      students exceeded expectations, 50% met expectations, 15% partially met expectations,
      and 2% did not meet expectations. The percentage of Weston students exceeding
      expectations is over triple the state average (33% vs. 10%); the percentage of Weston
      students not meeting or partially meeting expectations is a little over one-third the state
      average (17% vs. 48%).
  •   While math scores are not as high as English scores in tenth grade, they are still very
      strong. In Mathematics, 27% of tenth grade students exceeded expectations, 60% met
      expectations, 10% partially met expectations, and 1% did not meet expectations. As with
      English, the percentage of Weston students exceeding expectations is over double the
      state average (27% vs. 13%), while the percentage of Weston students not meeting or
      partially meeting expectations is less than one-third the state average (13% vs. 42%).
  •   Math scores are strong for grades 3-8 as well. In Mathematics, 31% of students exceeded
      expectations, 50% met expectations, 16% partially met expectations, and 2% did not meet
      expectations. The percentage of Weston students exceeding expectations is over triple
      the state average (31% vs. 9%) and the percentage of Weston students not meeting or
      partially meeting expectations is a little over one-third the state average (18% vs. 51%).
  •   We notice that in Science and Technology/Engineering, 58% of 9th and 10th grade students
      scored in the advanced category, 32% scored proficient, 8% scored needs improvement,
      and 2% scored warning. While 90% of Weston’s high school students scored proficient or
      advanced, 75% of high school students across the state scored proficient or advanced.
      (The categories are different, as high school science is still a legacy test.)
  •   In the fifth and eighth grade Science and Technology/Engineering tests, 28% of students
      exceeded expectations, 51% met expectations, 19% partially met expectations, and 3% did
      not meet expectations. The percentage of Weston students exceeding expectations is over
      triple the state average (28% vs. 8%) while the percentage of Weston students not
      meeting or partially meeting expectations is well under half the state average (22% vs.
      52%).
  •   We understand that we still have 184 students across all grades who have not yet met
      expectations in English, 207 students who have not yet met expectations in math, and 83
      students who have not yet met expectations in science. We have work to do!

                                                10
MCAS District Achievement Distribution by Year
English Language Arts, Grade 10 (Next-Generation 2019; Legacy 2016-2018)
11MCAS District Achievement Distribution by Year
English Language Arts, Grades 3-8 (Next-Generation, 2017-2019)
12MCAS District Achievement Distribution by Year
Mathematics, Grade 10 (Next-Generation 2019; Legacy 2016-2018)
13MCAS District Achievement Distribution by Year
Mathematics, Grades 3-8 (Next-Generation)
14MCAS District Achievement Distribution by Year
Introductory Physics, Grades 9/10 (Legacy)
15MCAS District Achievement Distribution by Year
Science and Technology/Engineering, Grades 5 and 8 (Next-Generation 2019;
Legacy 2016-2018)
16MCAS District Achievement Distribution by Year
Noticings and Wonderings
• We see from the charts for tenth grade English Language Arts, tenth grade Mathematics,
and fifth and eighth grade Science & Technology/Engineering that 2019 is the baseline
year for the Next-Generation MCAS exams. Score distributions are significantly down from
scores from the Legacy MCAS in previous years because the high school Next-Generation
exams are more difficult and the grades 5 and 8 exams test a completely different set of
content and practice standards. We cannot compare Next-Generation MCAS scores to
Legacy MCAS scores.
• We are in the third year of Next Generation MCAS testing in English Language Arts and
Mathematics for grades 3-8, which means we have three years of data to compare.
• Our scores in grades 3-8 English Language Arts have improved significantly from 2017 to
2019. In 2019 25% of students exceeded expectations, up 11 points from 2017. In 2019,
17% of students did not meet or partially met expectations down 8 points from 2017.
• Similarly, our grades 3-8 Mathematics scores have improved. In 2019, 31% of students
exceeded expectations, up 11 points from 2017. 18% of students did not meet or partially
met expectations, down 5 points from two years before.
• Our biggest improvement from 2018 to 2019 is in the exceeds expectations category for
both English Language Arts and Mathematics.
• 2019 marks the first year where no student scored in the Warning/Failing category in High
School Introductory Physics.
• Although 2019 Physics scores are better than 2016 and 2017, they are about the same as
2018. The percentage of Advanced students went down 7 points; however, the
percentage of Proficient students went up 8 points, the percentage of Needs
Improvement students went down 1 point and the percentage of Warning/Failing
students went down 2 points.
17MCAS District Achievement and Growth
English Language Arts, Grade 10 (Next-Generation)
18MCAS District Achievement and Growth
English Language Arts, Grades 3-8 (Next-Generation)
19MCAS District Achievement and Growth
Mathematics, Grade 10 (Next-Generation)
20MCAS District Achievement and Growth
Mathematics, Grades 3-8 (Next-Generation)
21MCAS District Achievement and Growth
Noticings and Wonderings
• We notice that the mean student growth percentile in 10th grade English Language Arts is
63.2. That means that on the average, students showed more improvement on their
MCAS scores than 63.2% of all students in the state with similar achievement profiles. This
is significantly above the state’s average student growth percentile, which necessarily
must be 50. Student growth percentiles to the right of the 60% dotted line on the graphs
represent significantly strong improvement.
• The mean student growth percentile for grades 3-8 English Language Arts is 59.1, 9.1
points higher than the state’s average student growth percentile of 50.
• The mean student growth percentiles for each individual grade from 3 through 8 range
from grade 5, showing a 50.0 growth (right at state average), to grade 7, showing 66.4
growth, 16.4 points above state average. In seventh grade, 2 out of 3 students improved
their MCAS scores faster than their state cohort.
• We notice that the mean student growth percentile in 10th grade Mathematics is 55.2, 5.2
points higher than the state’s average student growth percentile of 50.
• The mean student growth percentile for grades 3-8 Mathematics is 59.1, the exact same
growth as in English and 9.1 points higher than the state’s average student growth
percentile of 50.
• There is a much wider distribution of mean student growth percentiles for each individual
grade from 3 through 8 in math than in English. The lowest mean SGP is 8th grade, at 41.8
(significantly low growth); the highest mean SGP is 7th grade, at 68.2, followed closely by
4th grade at 67.7. For both of these grades, 2 out of 3 students improved their MCAS
scores faster than their state cohort.
• We continue to wonder to what extent the 8th grade algebra curriculum (one that does
not completely align with eighth grade math frameworks) has caused the low mean SGP
for 8th grade mathematics and the relatively low percentage of students meeting or
exceeding expectations (75%).
• We are curious about what specific instructional practices contributed to the very high
SGP both in 7th grade English Language Arts and 7th grade Mathematics (for the second
year in a row). We wonder how we can replicate these practices.
22MCAS Achievement Results by Economic Status
English Language Arts, Grades 3-8 (Next-Generation)
MCAS Achievement Results by Economic Status
Mathematics, Grade 3-8 (Next-Generation)
23MCAS Achievement Results by Disability Status
English Language Arts, Grade 10 (Next-Generation)
MCAS Achievement Results by Disability Status
English Language Arts, Grades 3-8 (Next-Generation)
24MCAS Achievement Results by Disability Status
Mathematics, Grade 10 (Next-Generation)
MCAS Achievement Results by Disability Status
Mathematics, Grades 3-8 (Next-Generation)
25MCAS Achievement Results by Race/Ethnicity
English Language Arts, Grades 3-8 (Next Generation)
26MCAS Achievement Results by Race/Ethnicity
Mathematics, Grades 3-8 (Next-Generation)
27MCAS Achievement Results by Economic Status, Disability Status,
and Race/Ethnicity
Noticings and Wonderings
• Please note that we did not include all subgroups in this analysis. When the number of
students in a subgroup falls below 30, statistical error increases and there is more chance
that students’ test scores can be identified. Therefore because of the small sample sizes,
there is no analysis of tenth grade students by economic status or race/ethnicity.
Additionally, within the race/ethnicity analysis, data from multi-race students is not
included in this document. Finally, because only grades 5, 8 and 9/10 take the Science and
Technology/Engineering tests, we did not include these tests.
• There are significant achievement gaps between economically disadvantaged students
and non-economically disadvantaged students. For example, in grades 3-8 English
Language Arts, the gap for meeting expectations between these two cohorts is 34
percentage points (51% vs. 85%). The gap in Mathematics is 36 percentage points (47% vs.
83%)
• Additionally, there are significant achievement gaps between students with disabilities
and non-disabled students. For example, in English Language Arts, the gap for meeting
expectations for these two cohorts is 41 percentage points for grade 10 (47% vs. 88%) and
40 percentage points for grades 3-8 (41% vs. 81%). The gap in mathematics is 49
percentage points for grade 10 (48% vs. 97%) and 46 percentage points for grades 3-8
(45% vs. 91%).
• We notice wide achievement gaps between African American students and students of
other races/ethnicities. For example, in grades 3-8 English Language Arts the gaps for
meeting expectations between African American students and Asian, Latino, and White
students are 34, 23, and 26 percentage points, respectively (58% vs. 92% vs. 81% vs. 84%).
The gaps in Mathematics between African American students and Asian, Latino, and
White student are 32, 10, and 30 percentage points, respectively (53% vs. 85% vs. 63% vs.
83%).
• The achievement gaps between Hispanic/Latino students and students of other
races/ethnicities are much narrower than state-wide achievement gaps, particularly in
English Language Arts. The gap for meeting expectations between grades 3-8 Latino and
White students in English is only 3 percentage points. The gap for meeting expectations
between grades 3-8 Latino and White students in math is a more substantial 20 points.
• It is important to note that our two biggest achievement gaps, with Special Education
students and African American students, are gradually closing in grades 3-8 since 2017.
The percentage of Special Education students meeting or exceeding expectations is up 8
percentage points in English Language Arts since 2017 (44% vs. 36%) and up 13 points in
Mathematics since 2017 (45% vs. 32%). Similarly, the percentage of African American
students meeting or exceeding expectations is up 6 percentage points in English Language
Arts since 2017 (58% vs. 52%) and up 12 points in Mathematics since 2017 (53% vs. 41%).
28• Additionally, it is important to note that Weston’s low-income, Special Education, and
African American subgroups perform very well compared to the same subgroups from
other districts. Just as we rank high when we compare the average scaled scores of all
students with other districts, we similarly rank high when we compare the average scaled
scores of our subgroups with other districts.
• We notice that Asian students consistently score highest of all Weston’s measurable
Race/Ethnicity subgroups.
29MCAS District Rankings, English Language Arts
Top Average Scaled Scores in English Language Arts, Grade 10 (Next-
Generation; Minimum sample size: 50)
1. Harvard 529.6
2. Dover-Sherborn 526.1
3. Advanced Math and Science Academy Charter 525.9
4. Belmont 524.8
5. Concord-Carlisle 523.3
6. Weston 522.9
7. Lexington 522.8
8. Hingham 521.9
9. Duxbury 521.4
10. Acton-Boxborough 521.3
11. Lincoln-Sudbury 521.1
12. Sharon 521.1
13. Sturgis Charter 521.0
14. Westford 521.0
15. Norwell 520.9
16. Cohasset 520.8
17. Hamilton-Wenham 520.4
18. Westborough 520.4
19. Brookline 520.1
20. Chelmsford 520.1
Top Average Scaled Scores in English Language Arts, Grades 3-8 (Next-
Generation; Minimum sample size: 50)
1. Weston 520.4
2. Hingham 519.2
3. Lexington 518.0
4. Belmont 517.5
5. Carlisle 517.4
6. Wellesley 517.3
7. Winchester 516.9
8. Hopkinton 516.4
9. Southborough 516.4
10. Westwood 516.0
11. Sherborn (3-5) 515.6
12. Needham 515.4
13. Brookline 515.2
14. Dover-Sherborn (6-8) 514.9
15. Benjamin Banneker Charter 514.8
16. Wayland 514.8
17. Community Day Charter (Kingman Webster) 514.6
18. Sudbury 514.4
19. Lynnfield 514.3
20. Mattapoisett 514.3
30MCAS District Rankings, Mathematics
Top Average Scaled Scores in Mathematics, Grade 10 (Next-Generation;
Minimum sample size: 50)
1. Advanced Math and Science Academy Charter 533.1
2. Lexington 528.5
3. Acton-Boxborough 528.2
4. Belmont 527.3
5. Groton-Dunstable 526.3
6. Harvard 525.7
7. Sharon 524.8
8. Dover-Sherborn 524.7
9. Pioneer Charter School of Science 524.3
10. Wellesley 523.8
11. Concord-Carlisle 523.3
12. Westford 523.2
13. Needham 523.0
14. Winchester 522.7
15. Hopkinton 522.5
16. Westwood 522.2
17. Brookline 521.3
18. Newton 521.3
19. Wayland 521.2
26. Weston 519.5
Top Average Scaled Scores in Mathematics, Grades 3-8 (Next-Generation;
Minimum sample size: 50)
1. Lexington 521.0
2. Southborough 520.4
3. Belmont 519.5
4. Dover (3-5) 518.9
5. Weston 518.8
6. Carlisle 517.2
7. Hopkinton 516.7
8. Winchester 516.7
9. Pioneer Charter School of Science 516.3
10. Sharon 516.1
11. Westford 515.7
12. Dover-Sherborn (6-8) 515.4
13. Wayland 515.2
14. Westborough 515.2
15. Acton-Boxborough 514.1
16. Brookline 514.0
17. Community Day Charter – Gateway 513.6
18. Westwood 513.5
19. Brooke Charter School 513.2
20. Wellesley 513.2
31MCAS District Rankings, Science & Technology/Engineering
Top Average Scaled Scores in Mathematics, Grades 5 and 8 (Next-Generation;
Minimum sample size: 50)
1. Belmont 521.8
2. Harvard 520.3
3. Carlisle 519.6
4. Masconomet 517.3
5. Dover (3-5) 516.4
6. Sherborn (3-5) 516.2
7. Weston 515.9
8. Winchester 515.6
9. Lexington 515.5
10. Dover-Sherborn (6-8) 515.2
11. Southborough 514.9
12. Hingham 514.7
13. Westford 514.1
14. Westwood 514.0
15. North Reading 513.7
16. Wayland 513.5
17. Sharon 513.1
18. Andover 513.0
19. Pioneer Valley Chinese Immersion Charter 512.9
20. Arlington 512.7
Weston’s Rankings by Grade Level and Subject Area
Average Scaled Score; Minimum sample size: 50
Grade Level and Subject Area Weston’s Ranking
Grade 3 English Language Arts 3
Grade 3 Mathematics 9
Grade 4 English Language Arts 1
Grade 4 Mathematics 2
Grade 5 English Language Arts 10
Grade 5 Mathematics 4
Grade 5 Science and Technology/Engineering 17
Grade 6 English Language Arts 5
Grade 6 Mathematics 8
Grade 7 English Language Arts 2
Grade 7 Mathematics 1
Grade 8 English Language Arts 14
Grade 8 Mathematics 16
Grade 8 Science and Technology/Engineering 4
Grade 10 English Language Arts 6
Grade 10 Mathematics 26
32Massachusetts’ District and School Accountability System
Information in this section comes from DESE’s School Leader’s Guide to 2018 Accountability Determinations
In 2018 the Department of Elementary and Secondary Education launched a new system for
classifying schools and districts based on accountability indicators that include MCAS
achievement and growth as well as other measures. The purpose of the accountability system is
to provide clear, actionable information to all stakeholders about district and school
performance. Additionally, the accountability system helps DESE identify districts and schools
requiring assistance or intervention, as well as those that are demonstrating success. Highlights
of the new system include:
• The inclusion of additional accountability indicators, which provide information about
district and school performance and student opportunities beyond standardized test
scores
• A focus on raising the performance of each district’s or school’s lowest performing
students in addition to the performance of the district or school as a whole
• The discontinuation of accountability and assistance levels (Levels 1-5), which have been
replaced with accountability categories that better define the progress that districts and
schools are making.
Accountability Indicators
The new accountability system has more indicators than the one used previously. They are as
follows:
• Achievement in English language arts (ELA), mathematics, and science, as measured by
MCAS scores.
• Growth in English language arts and mathematics, as measured by MCAS average
student growth percentile.
• English Learner (EL) progress toward English proficiency (for schools or districts that have
at least 20 English Learners).
• Chronic absenteeism, defined as the percentage of students missing 10% or more of
their days in membership.
• Four-year cohort high school graduation rate, the percentage of students in a cohort
that graduate in four years or less.
• Extended engagement rate, the total of the five-year cohort graduation rate plus the
percentage of students from the cohort that remain enrolled in high school after five
years.
• Annual dropout rate, the percentage of high school students who drop out in a given
year.
• Advanced coursework completion, the percentage of all students enrolled in 11th and
12th grade that achieve a passing score in at least one advanced course, including
Advanced Placement, International Baccalaureate, dual high school/college enrollment,
and other rigorous math and science courses.
33The two tables below describe how indicators are weighted:
Elementary and middle schools
Weighting (3:1)
Indicator Measures
With EL No EL
Achievement • ELA, math, and science achievement 60% 67.5%
Student growth • ELA and math SGP 20% 22.5%
Progress toward • Progress made by students toward attaining 10% --
English proficiency English language proficiency
Additional indicators • Chronic absenteeism 10% 10%
High schools
Weighting (3:1)
Indicator Measures
With EL No EL
Achievement • ELA, math, and science achievement 40% 47.5%
Student growth • ELA and math SGP 20% 22.5%
High school • Four-year cohort graduation rate 20% 20%
completion • Extended engagement rate
• Annual dropout rate
Progress toward • Progress made by students toward attaining 10% --
English proficiency English language proficiency
Additional indicators • Chronic absenteeism 10% 10%
• Advanced coursework completion
In 2019, Weston had fewer than 20 English Learners in each of its schools; thus, the weighting for
Weston’s schools follows the far right-hand category, “No EL.” However, the school district as a
whole has more than 20 English Learners; thus, progress toward English proficiency is weighted
10% for the Weston Public Schools
Reported Measures
Accountability measures consist of a normative component and a criterion-referenced
component, which are used to classify districts and schools into accountability categories.
The normative component, or accountability percentile, measures the performance of all
students in a school compared to other schools across the state. The normative component
largely determines whether or not schools and districts need assistance or intervention. All
schools serving a combination of grades 3 through 8 across the state – including Weston Middle
School and Field School – are combined together in one group and compared by percentile
ranging from 1 to 99. Likewise, Weston High School is compared to all other high schools across
the state. Accountability percentiles are not calculated for schools ending in grade 3; thus,
34Country School and Woodland School do not have a percentile rank. In 2019, Weston High
School, Weston Middle School, and Field School each have an accountability percentile score of
96%. This is up one percentage point as each school scored 95% in 2018.
Additionally, schools and districts are held accountable for improving student performance as
part of the criterion-referenced component of the accountability system. The criterion-
referenced component largely determines whether or not district and schools have met targets.
Based on 2017 and 2018 data, the Department of Elementary and Secondary Education sets
improvement targets for each indicator, and improvement is measure both for all students and
for a new student group consisting of the lowest performing students. Lowest performing
students are those who have been enrolled in the district at least two consecutive years, and
their performance on the 2018 MCAS placed them in the lowest quartile (25%) of the school. In
grades 3 through 8, where students are tested annually, the school is evaluated based on how the
same students performed on the 2019 MCAS and the additional indicators. For the high school,
the evaluation is based on how improvements of the 2019 lowest performing students as
compared to the 2018 lowest performing students.
Points are assigned based on whether or not targets are met:
0 points Declined
1 point No change
2 points Improved, but below target
3 points Met target
4 points Exceeded target
Points are assigned for each measure, weighted by indicator, and converted to a percentage for
all students and the lowest performing students. These two percentages are then averaged to
determine the criterion-referenced target percentage for each school and the district. Finally,
DESE weights the 2019 composite criterion-referenced target percentage at 60% and the 2018
target percentage at 40% to create a final score.
Schools and districts earning 75% or higher are deemed to be “meeting or exceeding targets;”
those earning 50% to 74% are making “substantial progress toward targets,” those earning 25%
to 49% are making “moderate progress toward targets,” those under 24% are making “limited or
no progress toward targets.” Country School, Woodland School, Field School, and Weston
Middle School are all meeting or exceeding targets. Weston High School is making substantial
progress toward targets. The Weston Public Schools as a whole is meeting or exceeding targets.
Details are in the following tables.
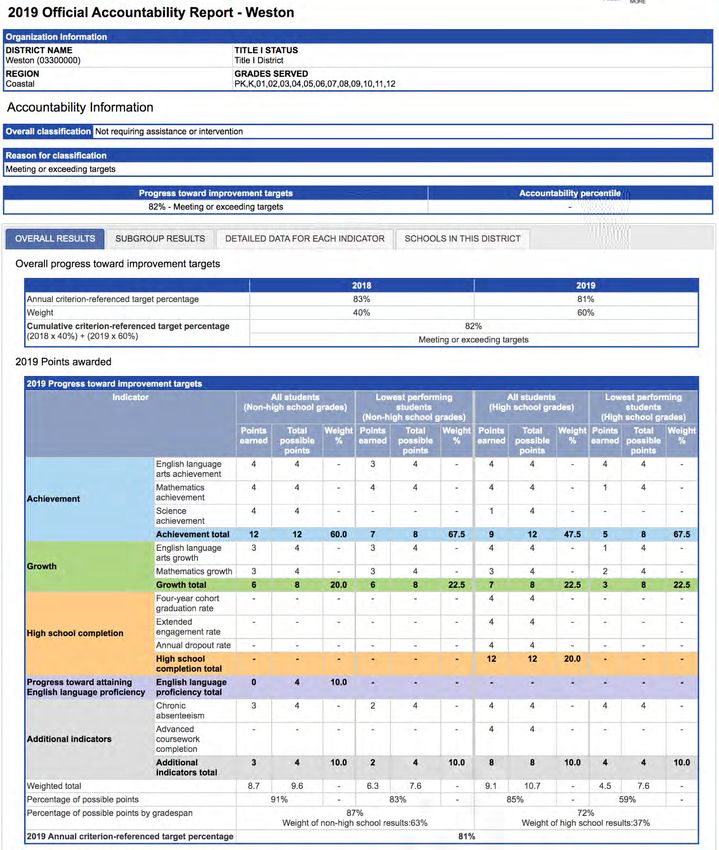
35Weston Public Schools Accountability Report
3637
38
39
40
41
42
Weston High School Accountability Report

                               43
44
Weston Middle School Accountability Report

                               45
46
Field School Accountability Report

                                 47
48
Country School Accountability Report

                                49
50
Woodland Accountability Report

                                 51
52
Accountability Reports
Noticings and Wonderings

  •   For all students in grades 3-8, the district met or exceeded targets in all areas of MCAS
      achievement, MCAS growth, and chronic absenteeism. The district did not meet the target
      for English Learners making adequate progress toward proficiency. In fact, scores declined
      significantly from last year.
  •   For the lowest performing 25% of students in grades 3-8, the district met or exceeded
      targets in all areas of MCAS achievement and growth. The district is approaching targets
      for chronic absenteeism.
  •   For students in grades 9-12, the high school met or exceeded MCAS achievement targets
      in English Language Arts and Mathematics, MCAS growth in English and math, all high
      school completion measures, chronic absenteeism, and advanced coursework completion.
      The only target all students did not meet is performance on the High School MCAS Physics
      exam.
  •   For the bottom 25% of high school students, the only targets that the high school met or
      exceeded were MCAS achievement in English and chronic absenteeism. The high school
      did not meet targets in Mathematics achievement, Mathematics growth, and English
      Language Arts growth.
  •   The reason why the high school received a cumulative criterion-referenced target
      percentage of 73% indicating “substantial progress toward targets” is because not enough
      targets were met with the lowest performing 25% of students.
  •   Weston Middle School met or exceeded criterion-referenced targets in all areas except
      chronic absenteeism for all students. Over all, the Middle School received a cumulative
      criterion-referenced target percentage percentage of 93.
  •   Field School met or exceeded criterion-referenced targets in all areas except chronic
      absenteeism for all students, and English Language Arts performance and growth for the
      lowest performing 25% of students. Overall, Field School received a cumulative criterion-
      referenced target percentage of 84, up three points from last year.
  •   Country and Woodland Schools met or exceeded all targets in all areas. Country’s
      cumulative criterion-referenced target percentage is 98, up three points from last year.
      Woodland’s cumulative criterion-referenced target percentage remains at 100.

                                               53
Conclusion
In Weston, overall MCAS scores are high and improving, student growth is strong, and the
Massachusetts accountability metrics indicate that Weston is a high-performing school district
“meeting or exceeding targets.” The data indicates that the Weston Public Schools provide a top-
quality education for many students. However, Weston’s wide achievement gaps with low-
income students, students with disabilities, African American students, and English Learners
shows that there is much work to do to reach our commitment to excellence in learning for all
students as articulated in Weston’s vision statement.
Raising all students to a high level of educational excellence is a challenging endeavor that
requires the coordination of a number of improvements that impact classrooms, schools, and the
system at large. The strategic objectives are thoughtfully outlined in the District Strategic Plan:
1. Strengthen educational practices in order to promote intellectual stretch, engaged
learning, and excellence for every student, every day.
2. Foster students’ well-being in order to develop their emotional resiliency and
intellectual curiosity.
3. Champion a school community committed to cultural competency, trust, and mutual
respect.
Underneath each strategic initiative are strategic objectives that the district has prioritized, in the
table following:
54We are in the second year of the District’s Strategic Plan and already much work has been done.
For example, we have restructured our professional development system to maximize teacher
learning, introduced coaches to support teachers, and enhanced school safety processes and
protocols. We are in the process of implementing a Responsive Classroom framework that
supports all students in our schools, establishing foundational reading, writing, and phonics
curricula and instruction in our elementary schools, and aligning curriculum and assessment
vertically from grade to grade in each subject area. We are beginning the work to systematize our
interventions for students who struggle, to promote inclusive instructional practices that support
all learners, and enhancing our communication to families and other community members.
Finally, we look forward to the challenges that were revealed in our accountability report: better
supporting our English Learners, focusing on chronic absenteeism, and engaging the lowest
performing 25% of students at Weston High School. We acknowledge that we have much work to
do, we are confident that we are heading in the right direction, and we expect continuous
improvement as measured by the MCAS and the state’s accountability system.
55You can also read