The US Yield Curve 2018 - CoreData Research
←
→
Page content transcription
If your browser does not render page correctly, please read the page content below

2018

   The US Yield Curve
   Trending Toward Inversion?

                          www.coredataresearch.com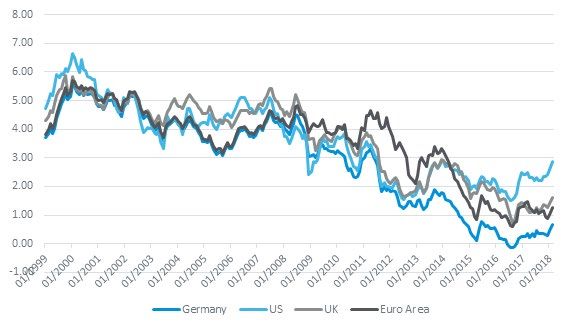
onsolidation

    Contents
 year of
onsolidation

    3
    Key Takeaways
                               4
                               A year of consolidation

    7                          9
    The long and short of it   Curve inversion looms large

    10                         11
    Long-term lessons          Expectations and risk perceptions

    13                         14
    Late cycle flattening      Reliable recession predictor

    15
    About CoreData

                                                                   The US Yield Curve 2018   2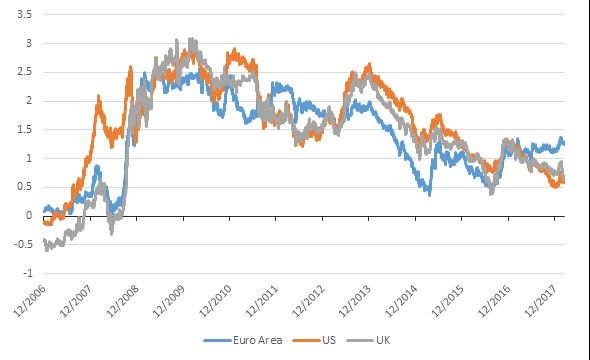
Key
Takeaways
• US long-term interest rates have lost ground against short-term rates since 2014, depicting a flatten-
  ing yield curve. The prospect of an inversion in 2018 is triggering concerns about a potential eco-
  nomic slowdown.

• The US Federal Reserve’s ongoing hiking cycle is pushing up the short end of the yield curve. The
  long end, which is relatively stable after years of accommodative monetary policy, is now under
  careful scrutiny of investors.

• Lower inflation expectations, increasing global risk aversion and prolonged low bond market volatili-
  ty are combining to narrow the Treasury yield spread.

• Investors and fixed income specialists are looking at the yield curve and readying for tightening
  monetary policy, slower economic growth and higher volatility in 2018 as we enter the late stage of
  the economic cycle.

                                                                                   The US Yield Curve 2018   3
A year of
consolidation
The US nominal yield curve – a comparison between interest rates of different maturities – has recently attracted the
attention of market participants. Since 2014, the yield curve has been gradually flattening due to the narrowing spread
between short and long-term yields of US Treasury bonds. The year 2017 marked a consolidation of this trend.
A flattening yield curve is regarded as a warning sign of an economic slowdown — or even recession if the trend evolves
into a curve inversion.
Yield curve inversion, in which short-dated yields exceed long-term yields, is considered a bearish sign for the economy.
And history suggests such fears are not unfounded. The last seven US recessions were preceded by an inversion of the
curve.
An inversion of the yield curve reflects falling future inflation expectations, tighter monetary policy and slow growth
expectations. It also holds implications for financial markets such as banking due to the relationship between the yield
curve and net interest margin (NIM). As banks pay interest on deposits based on short-term interest rates and extend
loans based on long-term rates, an inversion of the curve can put pressure on NIMs and hit the performance of bank
stocks. This, in turn, can lead to deteriorating lending conditions.
As shown in Figure 1, the spread between the 10-year and 2-year US Treasury bond yield has been falling over the last
four years. It was close to 300 bps at the beginning of 2014 and, as of March 15 2018, stood at just 53 bps.
Figure 1: 10-year Treasury minus 2-year Treasury yield spread
Federal Reserve Bank of St. Louis
The narrowing spread between long-term and short-term US Treasury bonds during 2017, as shown below, further
consolidates this trend of convergence.
The US Yield Curve 2018 4Figure 2: Narrowing spreads at different maturities
Q1 2017 Q2 2017 Q3 2017 Q4 2017 Q1 2018*
10-2 Year Treasury Yield Spread 1.15 0.93 0.85 0.65 0.58
30-2 Year Treasury Yield Spread 1.80 1.60 1.45 1.12 0.90
30-5 Year Treasury Yield Spread 1.10 1.09 1.00 0.75 0.51
*partial computation Federal Reserve Bank of St. Louis
Meanwhile, concerns about recession are grounded in the predictive power of the yield curve. Figure 3 shows the his-
torical correlation between inversion and the last five US economic recessions.
Figure 3: Yield curve and US recessions
Federal Reserve Bank of St. Louis, shaded areas indicate US recessions
Beyond the US
The flattening trend of the yield curve is not a feature of other major economies such as the UK and Euro area which are
behind the US in terms of tightening monetary policy.
The yield spread for both the Euro area and the UK does not present the same warning signs as the US, as shown by the
below country comparison of the yield curve. Within the European context, however, upward pressure will be exerted
on the short end of the yield curve if the European Central Bank starts increasing interest rates in 2019. Money markets
are pricing in an interest rate rise in the second quarter of 2019.
The Bank of England is expected to start hiking rates sooner. Some economists predict a rate rise in May 2018, with
Governor Mark Carney reportedly laying the groundwork for such a move despite falling UK inflation. Yield spreads are
consequently expected to narrow in 2018, although they remain in safe territory for now.
The US Yield Curve 2018 5Figure 4: Yield curve by country
Federal Reserve Bank of St. Louis, ECB, Bloomberg
The US Yield Curve 2018 6The long
and short of it
The current economic environment differs from previous years and it is therefore important to identify the different
dynamics impacting the yield curve today.
A simple way to look at the current yield curve trend is to separate it into short and long-term yield components.
The flattening impact of central bank action
The short end of the yield curve has clearly been impacted by the monetary policy action of the Federal Reserve. As
shown in figure 5, short-term yields have climbed dramatically since the end of 2015 and beginning of 2016 when the
Fed started to raise the target for short-term interest rates.
Figure 5: 1-year T-Bill yield and the Fed funds rate
Federal Reserve Bank of St. Louis
The long end of the yield curve, regarded as a reflection of global growth expectations, has remained in a tight range
and ultimately underperformed short-term yields. It declined in the first nine months of 2017 before staging a small
increase in the fourth quarter (Figure 6).
The US Yield Curve 2018 7Figure 6: 10-year Treasury note yield
Federal Reserve Bank of St. Louis
While monetary policy is playing a major role in depressing long-term rates, other factors include anticipated lower rates
of inflation and output growth and a gloomy economic outlook. In addition, highly accommodative monetary policies
pursued by other central banks have led to stronger demand for Treasuries from abroad, serving to further depress
rates.
The combination of rising short-term yields and declining long-term yields has therefore resulted in a flattening of the
yield curve.
The US Yield Curve 2018 8Curve inversion
looms large
With the Fed’s 2018 hiking plan still on track, the possibility of a negative yield spread later in the year cannot be ruled
out. However, this needs to be framed within a broader set of economic considerations.
A first consideration revolves around the correlation between the yield-rate environment and the economic cycle.
Investor expectations of an economic slowdown as we move toward the later stage of the cycle point to lower long-term
rates. When this is coupled with the Fed’s hiking plans, translating into higher short-term rates, the prospect of an inver-
sion of the yield curve in 2018 looms large.
A second consideration is the distortive effects of monetary policy on financial markets and the notion that this is the
main driver of the flattening yield curve and risk of inversion. This element focuses on the global ultra-accommodative
monetary policies put in place after the 2008 financial crisis which led to higher demand for longer-term US bonds from
investors and financial institutions searching for higher yields. The stronger demand ultimately depressed yields on
longer-terms US bonds.
These economic dynamics are currently causing what is known as a “bearish flattening”, with short-term yields rising at a
faster pace than long-term yields and, in the process, paving the way for an inversion.
The US Yield Curve 2018 9Long-term lessons
While the Fed’s current path of rate increases point toward a further flattening and possible inversion of the yield curve,
this scenario may not necessarily play out.
Indeed, the flattening trend seen in the US could be stabilised should other central banks begin to tighten monetary pol-
icy in 2018. In theory such a scenario would facilitate a slowdown of capital flows from other countries into the US and
thereby dampen demand for long-term bonds. But in practice, any expected benefits from such a process would likely
only materialise over a medium-to-long- term timeframe.
In order to avoid an inversion scenario, long-term rates would need to rise in tandem with Fed rate hikes. But such
synchronicity is improbable because US longer-term real interest rates tend to follow a more general downward global
trend.
The Bank for International Settlements observed in 2016 that secular factors have played a “big part” in driving down
the world long-term interest rate. This can be seen in Figure 7, which plots the 10-year yields of major economies over
the last two decades.
Figure 7: 10-year yields of major economies
Federal Reserve Bank of St. Louis
These declining historical rates pose something of a concern to investors as they imply limits to both economic growth
and the ability of central banks to achieve predictable and stable inflation.
The US Yield Curve 2018 10Expectations and
risk perceptions
Broadening the analysis to include investor expectations and risk perceptions can provide a more comprehensive out-
look on the future trend of the yield curve and possible direction of long-term rates. We will now look at some individual
elements.
Low inflation
Investors in the main have low inflation expectations. The market-based expectations of the Federal Reserve Bank of St.
Louis provide a useful measurement of inflation projections. As shown in the figure below, the breakeven inflation rate1
– the difference between the yield of a nominal bond and an inflation-linked bond of the same maturity – remains low,
despite increasing over the last six months. This indicates that investors are expecting a weak inflation rate over the next
five years.
Figure 8: 5-year breakeven inflation rate minus 30 bps2
Federal Reserve Bank of St. Louis
The trend is confirmed by the Federal Reserve Bank of Cleveland’s inflation expectations model which incorporates both
market and survey data. As shown in figure 9, inflation expectations are still below the Fed target.
1 From the Federal Reserve Bank of St. Louis: The breakeven inflation rate represents a measure of expected inflation derived from 5-Year Treasury Constant Maturity
Securities (https://fred.stlouisfed.org/series/DGS5) and 5-Year Treasury Inflation-Indexed Constant Maturity Securities (https://fred.stlouisfed.org/series/DFII5). The
latest value implies what market participants expect inflation to be in the next 5 years, on average.
2 From the Federal Reserve of St. Louis: The FOMC’s inflation target is in terms of the annual change in the price index for personal consumption expenditures (PCE).
The breakeven inflation rate is based instead on the CPI inflation. The latter has historically been higher than PCE inflation rate of about 46 basis points at an annual
rate, on average, since 1960. The adjustment applied in this case is a conservative 30 basis points.
The US Yield Curve 2018 11Figure 9: 10 year expected inflation
Federal Reserve Bank of Cleveland
Despite recent upward-looking revisions by some market participants, inflation expectations remain low overall, suggest-
ing limited room for rising long-term yields.
Low bond market volatility
Expectations of weak inflation are given further weight by the bond market volatility trend, with the CBOE 10-year US
Treasury Note Volatility Index (the counterpart of the equity VIX) falling to a record low of 3.21 in mid-December 2017.
Figure 10: CBOE 10-year US Treasury Note Volatility Index
Federal Reserve Bank of St. Louis
Federal Reserve Bank of Cleveland The US Yield Curve 2018 12Employment boost
Another driver of the yield curve is long-term economic growth expectations. Nonfarm payroll growth (NFP), which
measures the number of jobs added or lost in the economy, provides a gauge of economic health and can also help
predict Fed interest rate decisions.
US NFP increased by 313,000 in February 2018 to exceed market expectations of 200,000. This came after the January
figure was upwardly revised to 239,000.
This recent data suggests the current underlying growth rate is robust and strengthens the likelihood of interest rate
increases — something that would depress the long-term yield outlook.
High risk aversion
The risk perception factor is another key element to factor into the analysis. A significant increase in risk aversion over
the past two decades has led to a corresponding increase in savings levels, resulting in depressed yields.
Ultimately, an economic cocktail of lower inflation expectations, the later stage of the cycle and increasing global risk
aversion are leading to a flattening of the yield curve and paving the way for an inversion.
Late cycle flattening
According to Bank of America Merrill Lynch’s February 2018 fund manager survey, the largest proportion of fund man-
agers since 2008 (70%) believe the global economy is “late cycle”, with global growth expectations down 10% to 37%. A
strong majority of managers (80%) expect interest rates to rise, while an increasing – albeit still low (11%) – percentage
of investors expect the US yield curve to flatten even further in 2018.
Meanwhile, the Invesco Global Fixed Income Study 2018 shows a consensus among fixed income specialists about short-
term yield increases due to central bank action over the next three years, although the long end of the yield curve is a
matter of debate. The study also highlights the flattening trend in the US, with only 24% of US specialists expecting to
see a rising yield curve.
The same study suggests specialists are planning to increase allocations to core fixed income as well as adopt ladder
portfolios and Barbell strategies — multi-maturity and long-short duration investment strategies respectively — that aim
to mitigate interest rate risk.
For now, the US yield curve is flattening while equity volatility remains low, indicating a relatively calm equity market.
A continuation of the Fed’s tightening will drive a further flattening and the gradual shift toward the next phase of the
economic cycle – namely the late stage.
The US Yield Curve 2018 13Reliable recession
predictor
A March 2018 study from the US Federal Reserve Bank of San Francisco shows the yield curve remains a reliable reces-
sion predictor. Weakening confidence about future economic growth, as reflected by the current flattening of the US
yield curve, therefore has a strong basis of validity.
And according to a Federal Reserve model of recession probabilities, since the end of the last recession in 2008-2009
“the predicted probability has risen from close to zero to about 30 percent in 2018Q1”.
While ongoing economic expansion still points toward positive macro momentum for the US, the yield curve suggests
the economy is in transition to the late stage of the cycle.
Given the predictive power of the yield spread, investors should prepare for tightening monetary policy, slower econom-
ic growth and higher volatility. And while an imminent recession is not inevitable, investors should take the necessary
precautions.
The US Yield Curve 2018 14CoreData
About Us
CoreData Research is a global specialist financial services research and strategy consultancy. CoreData Research under-
stands the boundaries of research are limitless and with a thirst for new research capabilities and driven by client demand;
the group has expanded over the past few years into the Americas, Africa, Asia, and Europe.
CoreData Group has operations in Australia, the United Kingdom, the United States of America, Colombia, Sweden, Malta,
Singapore, South Africa and the Philippines. The group’s expansion means CoreData Research has the capabilities and
expertise to conduct syndicated and bespoke research projects on six different continents, while still maintaining the high
level of technical insight and professionalism our repeat clients demand.
With a primary focus on financial services CoreData Research provides clients with both bespoke and syndicated research
services through a variety of data collection strategies and methodologies, along with consulting and research database
hosting and outsourcing services.
CoreData Research provides both business-to-business and business to- consumer research, while the group’s offering
includes market intelligence, guidance on strategic positioning, methods for developing new business, advice on opera-
tional marketing and other consulting services.
The team is a complimentary blend of experienced financial services, research, marketing and media professionals, who
together combine their years of industry experience with primary research to bring perspective to existing market condi-
tions and evolving trends.
CoreData Research has developed a number of syndicated benchmark proprietary indexes across a broad range of busi-
ness areas within the financial services industry.
• Experts in financial services research
• Deep understanding of industry issues and business trends
• In-house proprietary industry benchmark data
• Industry leading research methodologies
• Rolling benchmarks
The team understands the demand and service aspects of the financial services market. It is continuously in the market
through a mixture of constant researching, polling and mystery shopping and provides in-depth research at low cost and
rapid execution. The group builds a picture of a client’s market from hard data which allows them to make efficient deci-
sions which will have the biggest impact for the least spend.
The US Yield Curve 2018 15Headquarters AUSTRALIA UK CoreData Pty Limited CoreData Research Ltd Suite 7, Level 9, 66 Hunter St 6 Foster Lane, London ECV 6HH Sydney, NSW, 2000 United Kingdom T: +61 2 9376 9600 T: +44 (0)207 600 5555 E: coredata@coredata.com.au E: info_uk@coredataresearch.com US PHILIPPINES CoreData Research LLC CoreData Research Services Inc. 15 Court Square, #450 Unit E-1608 Philippine Stock Exchange Centre, Boston, 02108 Exchange Rd, Ortigas, Pasig City, 1605 T: +1 (857) 239 8398 T: +63 2 667 3996 E: info_us@coredataresearch.com E: info_ph@coredataresearch.com
You can also read