Road safety performance overview - February 2019 - Gov.uk
←
→
Page content transcription
If your browser does not render page correctly, please read the page content below

Road safety
performance
    overview

       February 2019

Road safety
performance
overview
Casualty performance......................................................................................................................... 6
Across the network ................................................................................................................................. 8
Casualty groups............................................................................................................................................ 9
A global perspective.............................................................................................................................. 11
Customer experience and behaviour........................................................................ 13
Summary.................................................................................................................................................................... 16
Key definitions................................................................................................................................................. 18

Road safety
performance
overview
At Highways England, safety is                                    nonetheless more can be achieved. We are
                                                                  aiming for the safest roads in the world. Our
our first imperative. We
                     aim to                                       approach is set out in our national incident
reduce the number of road                                         and casualty reduction plan. We adopt a
                                                                  comprehensive approach based on safe systems
users killed or seriously                                         to maximise opportunities to reduce the number
                                                                  of casualties (see box).
injured (KSI) on our roads
by 40% by 2020 (from a                                            This report puts our safety performance into
                                                                  context, including how safety on our roads
2005-2009 baseline). This                                         compares with other roads and in other countries.
report provides an overview of our                                For a more detailed analysis, please refer to our
                                                                  reported road casualties on the strategic road
performance to 2017, drawing on                                   network 20171.
data for casualty numbers, rates and
perceptions of safety.                                            Improving safety on our roads reduces physical,
                                                                  mental and emotional harm to individuals. A safer
The strategic road network (SRN) is a vital                       network also improves journey time reliability,
national asset, supporting economic growth,                       contributing to economic output. Our focus on
regional development, and employment                              reducing the number of road users injured or
opportunities across England. It connects                         killed can be expressed in terms of the value of
families, communities and businesses, enriching                   prevention. This takes into account human costs,
the lives of many citizens. Billions of miles                     medical costs and loss of output. The value of
are travelled on the SRN each year. The vast                      prevention of a fatality is estimated to be
majority of these are safe and reliable journeys.                 £1.9 million while the value of prevention of a
We have high levels of safety on our network;                     serious casualty is approximately £213 thousand2.

1
 Reported road casualties on the strategic network 2016 is available at https://assets.publishing.service.gov.uk/government/
 uploads/system/uploads/attachment_data/file/725587/SRN_Casualty_Report_2016_v3_0._July_2018.pdf
2
 https://assets.publishing.service.gov.uk/government/uploads/system/uploads/attachment_data/file/743270/ras60001.ods
Safe systems
Safe systems take a holistic approach to road safety,
managed so the elements of the road transport system
combine and interact to guide users to act safely and to
prevent crashes. When crashes do occur, a safe system
approach ensures that the impact forces do not exceed the
limits that result in serious injury or death. If one part of the
system fails, the other components act to prevent serious
harm when a crash occurs. The safe system approach
includes the following principles:
1. People make mistakes that can lead to road crashes.
2. The human body has a limited physical ability to tolerate
   crash forces before harm occurs.
3. A shared responsibility exists between those who
   design, build and manage roads, those who use roads
   and vehicles, and those who provide post-crash care,
   to prevent crashes resulting in serious injury or death.
4. All parts of the system must be strengthened to multiply
   their effects; and if one part fails, road users are still
   protected.
6   Highways England Road safety performance overview

    Casualty performance
    Since 2012 the number of KSIs on the SRN has fluctuated following many
    years of falling numbers. This pattern has also been reflected on the rest
    of the road network in England.

    Figure 1 Killed or seriously injured reported road casualties
    on the SRN, 2005 to 2017
         KSIs
         3000

         2500

         2000                                                                                                                             Highways
                                                                                                                                          England
                                                                                                                                          2020
                                                                                                                                          target
         1500

         1000
                2005    2006   2007   2008   2009   2010        2011    2012     2013        2014    2015   2016    2017   2018       2019   2020

                                                                       Year

    A key factor affecting KSI performance in recent                          These include increases in distance traveled and
    years has been changes in recording practices                             volume of traffic, and changes in the mix of road
    by some police forces which has increased                                 users on the network. There is also inherent year
    the number of serious injuries being recorded                             on year variability in reported road casualties, for
    (see box). This makes interpreting recent trends                          example due to an increase in low frequency but
    uncertain.                                                                high casualty incidents or external factors such as
                                                                              the weather.
    The recording of fatalities is unaffected. The
    number of fatalities in 2017 was 236, one third
    lower than the 2005-09 baseline. However, since
    2012 the overall trend in fatalities has been flat
    ranging between 211 and 244 per year.
                                                           EU                    UK
    Apart   from the reporting inconsistency
        50,000                                                                                                                    3,500
    issue  for
        45,000
               the most recent years, there
    are 40,000
        many wider factors affecting                                                                                              3,000

    the 35,000
        number of casualties on the                                                                                               2,500
    SRN.30,000
                                                                                                                                  2,000
       25,000
                                                                                                                                  1,500
       20,000
       15,000                                                                                                                     1,000
       10,000
                                                                                                                                  500

        236
        5,000
            0
                 2007      2008
                                  fatalities
                                    2009
                                             on the
                                           2010
                                                     SRN2012
                                                  2011                                2013          2014     2015      2016
                                                                                                                                  0

                                  in 2017              Year
7

Safety on our network is influenced by many                     Our continued efforts to reduce all casualties on
factors, these include improved vehicle safety                  the network will require a targeted approach with
and improvements to our roads.                                  investments across the safe systems approach
                                                                informed by evidence.

 Table 1
 Reported road casualties and traffic on the SRN by severity for selected years
                                                                                        2017 percentage change from:
                                   2005-2009                                                                2005-2009
                                     baseline    2012         2016        2017          2016        2012      baseline
 Fatalities                              357      217          231         236          2.2%        8.8%       -33.9%
 Seriously injured                     1,964     1,479        1,774       1,617        -8.9%        9.3%        -17.7%
 KSIs                                  2,321     1,696       2,005        1,853        -7.6%        9.3%       -20.2%
 Slightly injured                     19,382    14,977       14,228      12,372       -13.0%       -17.4%      -36.2%
 All casualties                       21,703    16,673       16,233     14,225        -12.4%      -14.7%       -34.5%
 Traffic (billion vehicle miles)         83.4     84.8         92.1        94.4         2.5%       11.3%        13.2%

   Reporting of road casualty data
   The Department for Transport (DfT) has identified           In DfT's annual 2017 reported road casualties
   the new collision recording and sharing system              Great Britain report, analysis shows that the
   (CRASH), which has been introduced gradually                number of KSIs for forces using CRASH increased
   since 2012, as a factor leading to an increase in           by 19% from 2015 to 2017 yet over the same
   recorded serious casualties across Great Britain.           period forces not using CRASH had a 5%
   This system has introduced changes in how the               decrease in KSIs.
   severity of an incident is recorded and provides
   a more consistent basis to classify and report the          ONS are working on separate adjustments for
   level of injury severity. However, the change has           the SRN. The SRN has a higher proportion of
   meant that in some instances injuries previously            its casualties reported by police forces using
   classified as slight are now classified as serious.         CRASH, so the impact for the SRN is likely to be
   By 2017, the system was being used by 19 of the             higher and this is evident from the provisional
   38 police forces which cover the SRN. These                 analysis which has taken place so far.
   represent approximately 52% of the network.                 In addition, there were similar severity reporting
   DfT has commissioned the Office for National                changes for the Metropolitan Police who adopted
   Statistics (ONS), to estimate adjustment factors            the case overview preparation application (COPA)
   for historic KSI data, in order to enable consistent        system, however very few collisions on the SRN are
   numbers over a time period to be produced which             located within the Metropolitan Police jurisdiction.
   are independent of the reporting method being               Until the ONS work is completed, any year on
   used. The work is ongoing, however a report on              year changes in KSIs need to be interpreted with
   the impact of this reporting change and indicative          caution. It is expected that the ONS work will
   adjusted time series at the national level is available     be completed during summer 2019, however if
   at https://www.gov.uk/government/statistics/                further police forces adopt the new injury reporting
   reported-road-casualties-great-britain-annual-              methodology further adjustments will be necessary
   report-2017.                                                in due course.
8 Highways England Road safety performance overview
Across the network
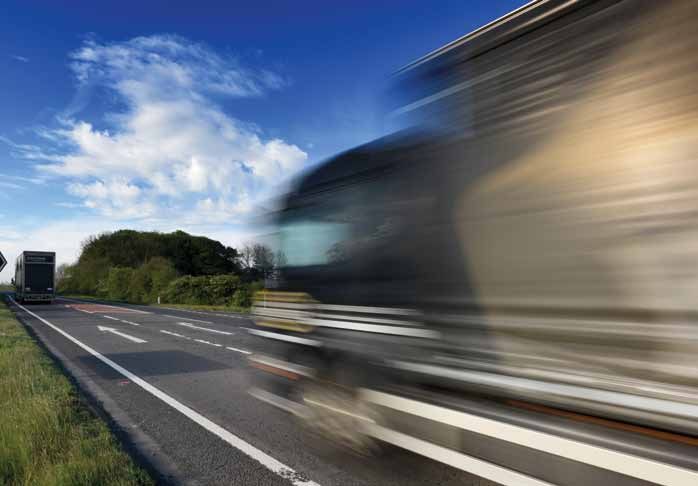
Motorway collisions often attract media attention, however a lower
proportion of fatal and serious injuries on the SRN occur on motorways
despite having the highest proportion of traffic.
In 2017, motorways carried 64% of the SRN’s traffic, but accounted for 41% of KSIs. In terms of KSIs,
single carriageway A Roads on the SRN have more than 6 times the KSI rate (76.7 casualties per billion
vehicle miles) of motorways (12.4). Single carriageway A Roads account for just 6% of traffic on the SRN
but 25% of fatalities.
Table 2
Reported road casualties and rates by road type and severity on the SRN, 2017
Rates
Number of casualties
(casualties per billion vehicle miles)
Serious Traffic (billion Serious
Fatalities injuries KSIs vehicle miles) Fatalities injuries KSIs
Motorways 91 661 752 60.9 1.5 10.9 12.4
All A Roads of which 145 956 1,101 33.6 4.3 28.5 32.8
Dual carriageway
87 599 686 28.2 3.1 21.3 24.4
A roads
Single carriageway
58 357 415 5.4 10.7 66.0 76.7
A roads
Whole SRN 236 1,617 1,853 94.4 2.5 17.1 19.6
Across every Highways England region concerted efforts are required to
further reduce KSIs to meet our 2020 targets. Each region is different
owing to the mix of road types, traffic patterns and demography
as well differences in the introduction of changes in police
recording practices. Regional incident and casualty Yorkshire
reduction plans are in place to support action at a and NE
regional level.
NW 2017
258
2020
Target
2017 2020 -25%
Table 3 185 Target
Killed or seriously injured reported -14%
road casualties on the SRN by region
To meet
2005-2009
2020 Midlands
Region 2017 baseline to
2017
target from
2017 2020
E
2017
366 Target 2017 2020
317 Target
East 317 -19% 236 (-26%) -19%
-26%
M25 167 -31% 146 (-13%)
SW M25
Midlands 366 -26% 296 (-19%) 2017 2020
2017 2020 Target
Target 167
South East 350 -9% 230 (-34%) 210
-36% -13%
South West 210 -6% 134 (-36%)
2017 2020
North West 185 -30% 159 (-14%) 350 Target
-34%
Yorkshire and
North East
258 -20% 193 (-25%) SE
9

Casualty groups
The KSI casualty rates on the SRN can also be examined by road user type,
using traffic survey data to standardise for distance travelled.
Occupants of HGVs and LGVs have the lowest                          roads in Great Britain which is 2,149 KSI
risk rate, 6.5 and 8.0 KSI casualties per billion                   casualties per billion vehicle miles. The activity
vehicle miles respectively, although this does                      levels of cyclists on the SRN is subject to some
not take into account people using other modes                      uncertainty and rates for pedestrians are not
injured in collisions with goods vehicles. KSI                      available. However, the 44 pedestrian fatalities
rates for car occupants are higher at 17.3 KSI                      reported in 2017 do represent a significant
casualties per billion vehicle miles; with the KSI                  proportion of fatalities (19%).
rate for motorcyclists substantially higher at 855
KSI casualties per billion vehicle miles.                           Pedestrian casualties include casualties who were
                                                                    travelling in a vehicle on the network and were
The SRN motorcycle rate is still considerably                       outside their vehicle at the time of the collision, for
lower than the national average for                                 example on the hard shoulder.
motorcyclists (including passengers) on all

    Table 4
    Reported road casualties by severity and KSI rates on the SRN, 2017
                                                                         Number of casualties                          KSI rate
                                                                                Serious                           (per vehicle
                                                               Fatalities                             KSIs   2
                                                                                                                  billion miles)
                                                                                 injuries
    Vulnerable Users                                                  71              382               453

              Pedestrians                                             44               43                87                   –1

              Pedal cyclists                                           2               38                40                   –1

              Motorcyclists                                           25              301               326                855

    Other road users                                                 164            1,214             1,378

              Car occupants                                          141            1,057              1,198               17.3

              LGV (up to 3.5 tonnes gvw) occupants                    13              101               114                 8.0

              HGV (over 3.5 tonnes gvw) occupants                     10               56                66                 6.5

1
 It is not possible to calculate a rate for pedestrians and mesurement of the distance travelled by cyclists on the SRN is subject
to considerable uncertainty
2
    Excludes 22 KSI casualties relating to other or unknown road user types.
2005-2009 KSIs (casualties)             2017 KSIs (casu

10   Highways England Road safety performance overview
                                                                                                           2,500

                                                                  EU                      UK               2,000
          50,000                                                                                                                           3,500
     Child45,000
            casualties (aged 15 or under) represent                                     Although KSIs1,500for those aged below 60 have
                                                                                                                                     3,000
     a much    lower share on the SRN (compared to
          40,000                                                                        decreased by 25% since the baseline,                 KSIs for
     the whole
          35,000 of Great Britain) with the vast majority                               older road users1,000 (aged    60   to  69)  and
                                                                                                                                     2,500 elderly    road
     injured  as vehicle occupants. On the SRN in 2017,
          30,000                                                                        users (aged 70+) have increased2,000          markedly, up
     child25,000
           casualties accounted for 3% of all KSIs with                                 6% for 60-69 year 500 olds and 26% for those aged
                                                                                                                                     1,500
     87% 20,000
           being vehicle occupants. This differs to the                                 70+. In 2017, 19% of all killed or seriously            injured
     overall Great Britain picture, with child casualties
          15,000                                                                        casualties on the0 SRN were aged1,000          60 or older,
                                                                                                               Children (0-15) Young (16-19) Other (20-59) Older (60-69)
     accounting
          10,000  for 9% of all KSIs of which 59% were                                  compared to 13% in 2005-09. This             500
                                                                                                                                         may well
                                                                                                                                                               Age group
     pedestrians,
           5,000     21% vehicle occupants and 17%                                      reflect the ageing population and also the more
     were cyclists.
               0
                    2007   2008     2009     2010   2011                         2012   active
                                                                                            2013older2014
                                                                                                       population.
                                                                                                                2015        2016
                                                                                                                                     0

                                                                            Year

     Figure 2
     Reported road KSI casualties by age group on the SRN,
     baseline (2005 to 2009) and 2017

                            2005-2009 KSIs (casualties)          2017 KSIs (casualties)

          KSIs                                                                                                                            KSIs
           2,500                                                                                                                          2,500

           2,000                                                                                                                          2,000

           1,500                                                                                                                          1,500

           1,000                                                                                                                          1,000

             500                                                                                                                          500

               0                                                                                                                          0
                   Children (0-15) Young (16-19) Other (20-59)   Older (60-69)     Elderly (70+)    All ages                 60+

                                                                     Age group

     Severity of injuries among casualties increases                                        Figure 3
     noticeably with age. In 2017, for the SRN 19% of                                       KSIs as a share of all casualities
     casualties aged 60 or older were classified as                                                       2017 KSIs
                                                                                            by age group on   SRN, 2017
                                                                                                          as percentage of all casualties
     KSIs, compared to 13% for all age of casualties.
     Within the 60 and older population, the risk                                                  Age group
     increases markedly beyond the age of 70.
                                                                                                         All ages

                                                                                                               60+

        Analysing KSIs by age groups                                                               Elderly (70+)

        Analysis of KSI casualties on the SRN by                                                   Older (60-69)
        age groups only allows for a reflection on
                                                                                                   Other (20-59)
        the numbers rather than a rate as there
        is no information available about the                                                      Young (16-19)
        number of vehicle miles travelled by age
        of users. The age profile of SRN users                                                     Children (0-15)

        is likely to differ from the national picture                                                              0%       5%      10%       15%    20%         25%
        due to the mode mix, with lower levels of                                                                       KSIs as a percentage of all casualties
        non-motorised travel.

                     2017 KSIs
                     as percentage of all casualties
11
A global perspective
Our national road safety record stands
the test of international comparison.
In 2016, the fatality rate on England’s motorway network
was 0.80 per billion vehicle kilometres. This is lower than
for every other country for which data is available1,
being less than half the rate for Germany (1.61) and
France (1.75), and below Finland (0.91) and the
Netherlands (1.14).
Source: IRTAD database – 17 December 2018
1
Finland
0.91
Denmark
1.53
England
0.80
Czech Republic
4.53
Netherlands
1.14
Germany
1.61
France Austria
1.75 1.13
Slovenia
3.71
Italy
3.34
Figure 4
Fatality rates on motorways in selected
countries (2016) (rate per billion vehicle
United States kilometres)
3.9212 Highways England Road safety performance overview
0.80 SRN motorway fatality rate per
billion vehicle kilometres
3000
2500
2000 Highways
England
2020
target
1500
1000
2005 2006 2007 2008 2009 2010 2011 2012 2013 2014 2015 2016 2017 2018 2019 2020
Year
Throughout the EU there have been significant in countries with previously poor road safety
reductions in road deaths on all road types since records. Over the same period the UK saw a 39%
the 2005-2009 baseline period. The reduction reduction. Although there is a stalling in progress
across the EU (including UK roads) from 2007 to in recent years, this is a pattern which is observed
2016 was 41% with the most significant reductions across the EU.
Figure 5
Road casualty fatalities in the UK compared to the EU
EU UK
fatalities fatalities
EU UK
50,000 3,500
45,000
3,000
40,000
35,000 2,500
30,000
2,000
25,000
1,500
20,000
15,000 1,000
10,000
500
5,000
0 0
2007 2008 2009 2010 2011 2012 2013 2014 2015 2016
Year
Source: European Commission annual accident report 2018
https://ec.europa.eu/transport/road_safety/sites/roadsafety/files/pdf/statistics/dacota/asr2018.pdf
2005-2009 KSIs (casualties) 2017 KSIs (casualties)
2,500 2,500
2,000 2,00013
Customer experience
and behaviour
The road network is a shared space The chances of being injured on the SRN are low for
all user groups, and most users say they feel safe.
and enabling road users to interact
in a safe and positive way on our The 2017-18 national road users’ satisfaction
network is a key priority survey (NRUSS)1 reported that 90% of
respondents said that they felt very or fairly safe
How drivers feel and behave towards each other on their last journey. This is a similar level to our
and other road users is complex. One unsafe own customer insight survey (CIS) at 87% for
behaviour could trigger another in response, December 2017 to November 2018. Nonetheless
and the cumulative interaction of a number of some users feel less safe, and others may
unsafe behaviours may create a situation that choose not to use the network because of
results in an incident. Through our customer concerns about safety.
service strategy and compliance strategy we
are engaging with road users to encourage and
enable them to behave more safely – making National road users’ satisfaction survey 2017-18
1
them aware of expected behaviours and working https://www.transportfocus.org.uk/research-
publications/publications/national-road-users-
in partnership to ensure any enforcement activity
satisfaction-survey-2017-18/
is timely and proportionate.
Figure 6
Percentage of 1. Speeding 5. Not observing
respondents lane rules
who observed 47% 32%
behaviours on last !
journey on SRN
(customer insight
survey, December 2. Not indicating 6. Drivers using
2017 to November mobile phone
2018)
40% 27%
3. Tailgating/close following 7. Overtaking slowly
34% 21%
4. Erratic/dangerous 8. Driving too slow
lane changing
Base number 21,666. 33% 20%
More than one response
could be selected.14 Highways England Road safety performance overview
A range of factors will influence perceptions For the majority of casualty collisions that
of safety in general and in relation to specific happen on the SRN the police report on the
journeys, including other driver behaviour. 48% of factors that they believe could have contributed
drivers in the CIS (December 2017 to November to the collision (referred to as contributory
2018) said the behaviour of other drivers made factors). In the majority of cases the associated
them feel less safe on their last journey on the contributory factors are those falling within the
SRN. This is not to say they felt unsafe for their driver/rider error or reaction category.
entire journey but that there were instances where
the behaviours of other drivers concerned them.
The most commonly observed driver behaviour
on the last trip was speeding, followed by not
indicating, close following, erratic/dangerous lane
changes and poor lane use. These behaviours
can impact on feelings of safety and their journey
experience.
Table 5 Share of all collisions where a contributory factor (CF) is reported – selected
contributory factors only
Motorways A-roads
Contributory Decription 2005-2009 2017 2017 2005-2009 2017 2017
factor category baseline percentage baseline percentage
points points
change change
from from
(%) (%) baseline (%) (%) (%) baseline (%)
Driver/rider error Failed to look
25.7 34.8 9.1 30.1 38.2 8.2
or reaction properly
Failed to judge
other person’s 24.6 32.9 8.3 25.4 30.0 4.6
path or speed
Loss of control 21.3 16.5 -4.8 19.3 15.1 -4.2
Sudden braking 12.3 12.9 0.6 12.4 10.8 -1.7
Poor turn or
11.2 10.5 -0.8 13.3 13.7 0.4
manoeuvre
Following too
Injudicious action 16.6 15.0 -1.6 12.6 12.5 -0.2
close
Behaviour or Careless, reckless
9.8 10.0 0.2 13.3 14.6 1.3
inexperience or in a hurry
Impairment or
Fatigue 6.2 6.0 -0.2 4.0 5.0 0.9
distraction
Distraction in
3.0 4.5 1.5 3.1 5.0 1.9
vehicle
Illness or disability,
1.7 3.3 1.6 1.6 3.5 1.9
mental or physical
NB. Because up to 6 contributory factors can be reported for an individual collision, the percentages summed across all
contributory factors will exceed 100%.
Contributory factors are not reported for all collisions. In 2017 they were reported for 78% of all reported casualty collisions on
the SRN.15
92%
For the majority of casualty collisions on the SRN,
the associated reported contributory factors are
those falling within the driver/rider error.
feel safe
Increasingly, failed to look properly and failed
to judge person's path or speed are by far the Contributory factors
most commonly reported contributory factors. For
the baseline period (2005-2009), each of these Contributory factors are
contributory factors were reported in around 1 reported for most but not all
in 4 collisions. For 2017, failed to look properly collisions where a police officer
was reported for more than 1 in 3 collisions with attended. Up to 6 contributory
a substantial increase in the reporting of failed to factors can be reported per
judge other person's path or speed also. collision drawing from a list of 78
Contributory factors within the impairment or available factors. It is important
distraction category are relatively rare, however to note that the contributory
they are being reported on an increased basis in factor(s) assigned to a collision
2017 compared to the baseline period. The main represent the initial opinion of
ones reported are fatigue, distraction in vehicle the attending officer relating to
and illness or disability, mental or physical. The possible factors leading to the
latter was reported twice as often in 2017 than in collision and are not intended to
the baseline period. be a definitive representation of
actual cause.16 Highways England Road safety performance overview
Summary
Safety is our key imperative and we are committed to creating a safe and
reliable network for our customers. Significant progress has been made in
reducing the number of casualties on the SRN over the long term.
In recent years improvements in safety have not For the SRN one key issue is that about two fifths
been sustained, particularly for KSIs. This slowing of KSI casualties on the SRN occur on motorways
of progress has been reflected for other non SRN which already have a very high level of safety and
roads in the country and across the EU. are some of the safest in the world.
This means the greater opportunities for
improvement lies on A-roads and relate
significantly to car users and motorcyclists. There
are also key groups which we need to focus on,
including motorcyclists and older drivers.17
Figure 7
Distribution of KSI casualties on the SRN by mode and road type, 2017
A road A road All
Motorway
dual carriageway single carriageway SRN
27 36 24 87
Pedestrians
Pedal 1 26 13 40
cyclists
96 153 77 326
Motorcylists
Car 524 399 275 1,198
occupants
LGVs 54 40 20 114
occupants
HGVs 43 20 3 66
occupants
Not known/
7 12 3 22
other
The majority of our customers generally feel safe to improve compliance. We are demonstrating
on our network, though observing certain driver leadership in this area, exploring the role for
behaviours can impact negatively on feelings, improvements in driver behaviour alongside
including safety. Human factors also continue to developments in infrastructure design, vehicle
feature strongly as contributing to many collisions. safety and speed management as part of the safe
system.
Whilst modifying driver behaviour comes with its
own challenges, new frameworks and approaches
are emerging that create significant opportunity18 Highways England Road safety performance overview
Key definitions
Casualty – A person killed or injured in a reported collision on a public road. Casualties are sub-divided
into fatal, seriously injured and slightly injured.
Fatal injury – Human casualties are recorded as fatal where injuries were sustained which caused death
less than 30 days after a road collision. Confirmed suicides are excluded.
KSI – Killed or seriously injured.
National incident and casualty reduction plan – This sets out our approach to road safety based on
the safe system, with interventions being delivered across safer roads, safer vehicles and safer people.
This plan and associated activities support the government's key priorities for road safety.
Regional incident and casualty reduction plans – These plans are produced for each of our 7 regions.
They summarise safety performance, the evidence and intelligence led actions that have been carried
out, planned interventions to realise safety improvements. They promote a safe systems approach to road
safety and encourage the generation and utilisation of local intelligence.
Serious injury – An injury for which a person is detained in hospital as an in-patient, or any of the
following injuries whether or not they are detained in hospital: fractures, concussion, internal injuries,
crushings, burns (excluding friction burns), severe cuts, severe general shock requiring medical
treatment and injuries causing death 30 or more days after the accident. An injured casualty is recorded
as seriously or slightly injured by the police on the basis of information available within a short time of
the accident. This generally will not reflect the results of a medical examination, but may be influenced
according to whether the casualty is hospitalised or not. Hospitalisation procedures will vary regionally.
Slight injury – An injury of a minor character such as a sprain (including neck).
Strategic road network – The road network in England managed by Highways England. It is made up
of motorways and the most significant A roads and is around 4,400 miles long.If you need help accessing this or any other Highways England information, please call 0300 123 5000 and we will help you. © Crown copyright 2019. You may re-use this information (not including logos) free of charge in any format or medium, under the terms of the Open Government Licence. To view this licence: visit www.nationalarchives.gov.uk/doc/open-government-licence/ write to the Information Policy Team, The National Archives, Kew, London TW9 4DU, or email psi@nationalarchives.gsi.gov.uk. This document is also available on our website at www.gov.uk/highways If you have any enquiries about this publication email info@highwaysengland.co.uk or call 0300 123 5000*. Please quote the Highways England publications code PR164/18. Highways England Creative GFD18_0237 *Calls to 03 numbers cost no more than a national rate call to an 01 or 02 number and must count towards any inclusive minutes in the same way as 01 and 02 calls. These rules apply to calls from any type of line including mobile, BT, other fixed line or payphone. Calls may be recorded or monitored. Printed on paper from well-managed forests and other controlled sources. Registered office Bridge House, 1 Walnut Tree Close, Guildford GU1 4LZ Highways England Company Limited registered in England and Wales number 09346363
You can also read