Global Disease and Air Quality in a Changing Climate
←
→
Page content transcription
If your browser does not render page correctly, please read the page content below
YP Perspective

 Global Disease and Air Quality
     in a Changing Climate
                                                 by Kim Frauhammer

Through the lens of the current global pandemic, a look at some of the existing
challenges, such as environmental degradation, decreasing air quality, and climate
change, that continue to put the human population at risk.

2020 has already been a year to remember, defined by the              Seasonality of the Virus
novel Coronavirus and its far-reaching effects on our health          With how expansive this virus has proven to be, examining
and economy. This global pandemic has restructured our                all methods of transport is vital to understanding the future
lives, while existing global challenges that continue to put the      of global diseases. According to the U.S. Global Change
human population at risk remain. Environmental degradation,           Research Program, a set of “vulnerability factors” determine
decreasing air quality, and climate change continue to expose         whether someone is at risk for adverse health outcomes:
the human population to higher risks of illness and loss of           exposure, sensitivity, and adaptive capacity.1 The climate and
resources. COVID-19 has provided us with a unique window              environment are a part of all three. The virus first emerged
into identifying these underlying risks and highlights the            and spread rampantly during the Northern Hemisphere
benefits between preserving the future of not only our                Winter and there is scientific evidence to point to why.
health, but our environment as well.                                  Humidity is the greatest factor.

                             em • The Magazine for Environmental Managers • A&WMA • August 2020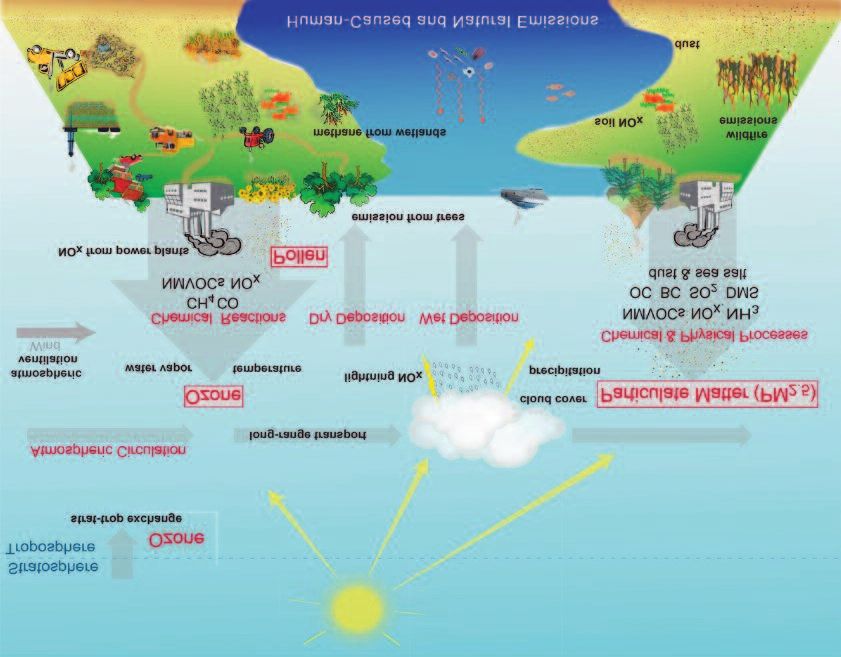
YP Perspective

In the midlatitudes of the Northern Hemisphere (broadly be-        Recent research from Harvard University cites that people
tween 30 and 60 degrees), the atmosphere cools down as the         who live in areas of poor air quality are more likely to die
Earth is tilted farther away from the sun during the winter.       from COVID-19.5 The study examined over 3,000 counties
This colder air typically contains less moisture than its summer   across the United States with long-term exposure to fine par-
counterpart. This is because water does not evaporate as read-     ticulate matter (PM2.5) and the virus-related death counts cor-
ily in colder air as it does in warmer air.2 As temperature in-    responding to those counties. The study found statistically
creases, so does the energy of water molecules, eventually         significant results showing that an increase of 1 µg/m3 of
becoming so energetic they evaporate and change from a liq-        PM2.5 was associated with an 8% increase in the mortality
uid to a gas phase, becoming water vapor in the atmosphere.        rate.
This phase change does not happen as frequently in the win-
ter, leading to drier air.3                                        A similar study done in China showed that there was also a
                                                                   compelling link between higher air pollution levels and mor-
Liquid droplets we emit from sneezing, coughing, or even           tality rate of the SARS (“Severe Acute Respiratory Syn-
breathing can remain in the dry air longer, creating favorable     drome”) virus that swept across Asia in 2002.6 The study
conditions for the spread of viruses like the one that causes      cites that patients from regions with a high air pollution index
COVID-19. The minute water particles we spray into the air         (API) had a mortality rate double that of patients from re-
float in the dry air of winter for us to breathe.4                 gions with low APIs. These studies represent the increased
                                                                   sensitivity of people to suffer severe impacts from a virus due
Disease and Air Quality                                            to poor air quality.
Understanding the seasonality behind the spread of viruses is
only one environmental aspect determining our exposure.            According to the National Climate Assessment, over 100

   Figure 1. Human-caused and natural emissions of air pollution.
   Source: National Climate Assessment.7

                              em • The Magazine for Environmental Managers • A&WMA • August 2020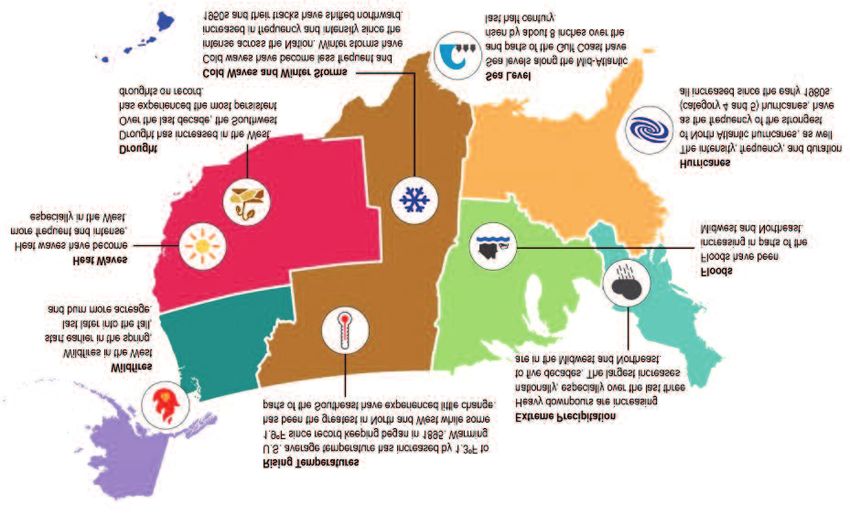
YP Perspective

                                                                                                          Natural processes also
                                                                                                          result in the formation of
                                                                                                          these pollutants. Sea salt,
                                                                                                          elemental carbon, dust,
                                                                                                          and smoke are all exam-
                                                                                                          ples of naturally occur-
                                                                                                          ring components of PM.
                                                                                                          It is estimated that wild-
                                                                                                          fires comprised roughly
                                                                                                          40% of direct PM2.5
                                                                                                          emissions in 2011.7
                                                                                                          However, human-related
                                                                                                          activities, including pre-
                                                                                                          scribed fires and land
                                                                                                          management practices,
                                                                                                          also formed part of this
                                                                                                          40%.

                                                                                                           The U.S. Clean Air Act
                                                                                                           has made significant
                                                                                                           progress toward cleaner
                                                                                                           and more breathable air
                                                                                                           in our country.8 A study
                                                                                                           from 2009 shows life
                                                                                                           expectancy across
                                                                                                           the United States
                                                                                                           increased by five months
                                                                                                           between 2000 and
                                                                                                           2008 due to reductions
                                                                                                           in PM2.5.9 However, all
                                                                                                           these pollutants have
                                                                                                           shown a slight increasing
   Figure 2. NO2 levels during COVID-19 pandemic.                                                          trend since 2016 and
   Source: NASA11                                                                                          there are still many areas
                                                                                                           within the United States
                                                                                                           whose levels of these
million people in the United States today live in areas where      pollutants exceed federal air quality standards, putting
the air pollution exceeds health-based air quality standards.7     citizens that live in these areas at an increased risk for health
Two common air pollutants that adversely affect humans are         complications.10
ground-level ozone (O3) and particulate matter (PM2.5 and
PM10). These impact the respiratory and cardiovascular sys-        As people stayed home in early 2020 due to COVID-19 and
tems, leading to health complications, shortness of breath,        commuting became walking from the bed to the couch in
hospital visits, and even premature death. It is estimated that    slippers instead of driving miles in a smog-emitting car, many
about 200,000 Americans die from those air pollution-re-           cited the dramatic improvements in air quality. On April 9,
lated causes each year, despite all the pollutants being de-       NASA released satellite images revealing significant reduc-
fined as within the U.S. Environmental Protection Agency           tions in air pollution over the major metropolitan areas of the
(EPA) standards.                                                   Northeast United States (see Figure 2).11 In India, the nor-
                                                                   mally haze-clogged skies were replaced with magnificent
The State of Air Pollutants Today                                  views of the Himalaya Mountain Range, a sight not seen in
O3 and PM primarily originate from emissions from human-           years.12 These achievements show that widespread action on
related activities such as highway vehicles, stationary fuel       a global scale to improve air quality is possible, even if the
combustion, and industrial processes (see Figure 1).7 These        current circumstances are not sustainable.
pollutants are also extremely sensitive to meteorological
factors such as temperature, wind speed, and precipitation.        EPA air monitor data from 2015–2019 was compared to

                              em • The Magazine for Environmental Managers • A&WMA • August 2020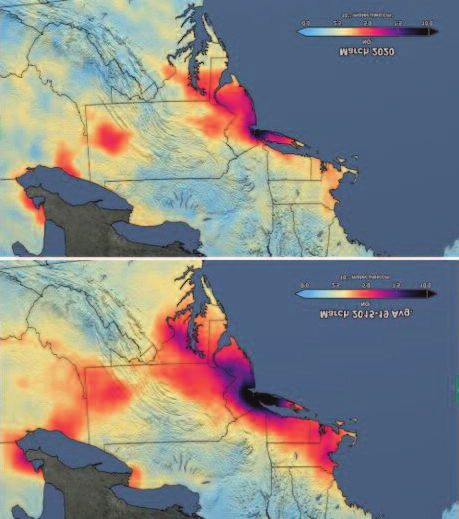
YP Perspective

                                                                                      2020 data from the same period by
                                                                                      county during the time of 2020 stay-
                                                                                      at-home orders in Colorado (see Fig-
                                                                                      ure 3). PM emissions revealed great
                                                                                      contrast, with one county seeing as
                                                                                      much as a 40% decrease, while a
                                                                                      neighboring county saw a 40% in-
                                                                                      crease. O3 was less dramatic. With
                                                                                      fewer cars on the road, data across
                                                                                      the state east of the Rockies largely
                                                                                      varied on a range from negative to
                                                                                      positive 5%, with zero change in
                                                                                      Denver County. This unique situation
                                                                                      of staying at home shows a need for
                                                                                      reductions in other aspects of society
                                                                                      to achieve dramatic long-term de-
                                                                                      creases in pollutants.

                                                                                      A Changing Climate’s Effect
                                                                                      on Air Quality
                                                                                      According to the National Climate
                                                                                      Assessment, many factors contribute
                                                                                      to increased PM and O3 emissions.
                                                                                      As the globally averaged tempera-
                                                                                      ture increases, we will not see a
                                                                                      blanketed effect of this increase
                                                                                      throughout the entire world, rather
                                                                                      a quilt of extremes with various
                                                                                      squares affecting various
                                                                                      regions (see Figure 4).

                                                                                      The West and Southwest United
                                                                                      States are two areas that are pro-
                                                                                      jected to see higher temperatures
                                                                                      and decreased precipitation due to
                                                                                      climate change.13 This leads to a pro-
                                                                                      longed and more severe wildfire sea-
                                                                                      son, as well as more frequent
                                                                                      droughts. PM emissions from wild-
                                                                                      fires and drought-related dust there-
                                                                                      fore increase.14 PM can then travel
                                                                                      hundreds of miles in the wind to
                                                                                      other parts of the United States, de-
                                                                                      creasing air quality. This drier and
                                                                                      hotter climate is also expected to re-
                                                                                      sult in twice the area of forest burned
                                                                                      in the United States due to wildfires,
                                                                                      leading to more smoke-related PM.7
Figure 3. Percent change in Colorado PM2.5 (top) and O3 (bottom)
median concentrations by county during stay-at-home order                             Meteorological conditions continue
compared to 2015-2019.                                                                to influence air quality. O3 is formed
Source: EPA Air Quality System and AirNow data.                                       through photolytic chemical reactions
Credit: Holli Williamson and Clement Cros, Spirit Environmental, LLC                  driven by the sun, which results in in-
                                                                                      creased O3 formation in regions with

                             em • The Magazine for Environmental Managers • A&WMA • August 2020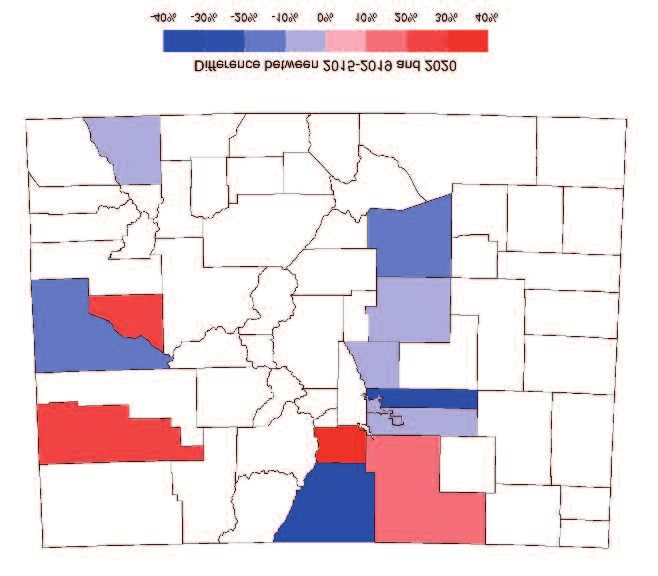
YP Perspective

   Figure 4. Climate change effects across the United States.
   Source: National Climate Assessment13

increased temperature. O3 formation also favors low humid-       Other viruses such as Lyme disease or malaria, which are
ity and stagnant air, allowing the O3 to “cook” in the atmos-    vector-borne illnesses carried by ticks and mosquitoes, could
phere.15 Conversely, O3 and PM can be brought out of the         have the ability to reach regions they never have before.19
air to the ground by rain and snow.                              Revisiting the quilt analogy, the wet and humid region of the
                                                                 tropics is expected to expand, creating a larger favorable
Persistent weather patterns causing stagnant air over one        environment for mosquitoes carrying malaria. Similarly,
area for a prolonged time lead to a piling up of PM or O3        increased precipitation across the northeastern United States
emissions near the ground that leads to negative health im-      has expanded the geographic reach of ticks and Lyme
pacts.16 This is commonly seen in Denver, Colorado (a seri-      disease.19
ous nonattainment area for O3) when a stable air mass
moves over the region, causing sinking air to trap these pol-    What about humidity?
lutants over the city. These stagnant weather patterns are       Research suggests the more favorable spread of viruses in
likely to become more prevalent as our climate changes.          environments with low humidity. Some cite the increasing
                                                                 global temperature as an indication that humidity will also
Future of Disease in a Changing Climate                          increase, suggesting a decrease in the spread of viruses.
How else do issues such as air quality and climate change in-    However, climate models predict that surface temperature
fluence the future spread of diseases like COVID-19? Unfor-      changes resulting from climate change will be amplified
tunately, the answer is not as clear as the recent Los Angeles   over land when compared to the ocean, and subsequently
skyline. Preliminary research from Italian scientists found      lead to relative humidity declining over land while remaining
Coronavirus detected on air pollution particles, suggesting      constant over the ocean.20
viruses could travel further with worsened air quality.17
Climate scientist Katharine Hayhoe from Texas Tech               A Path Forward
University also cites continued human expansion as one           Our Earth is a complex place and we are only beginning
reason zoonotic viruses such as this Coronavirus might           to understand the novel coronavirus and its effect on our
become more prevalent.18 As civilization expands and             health, economy, and environment. While it is uncertain
encroaches on wildlife, displaced animals that carry viruses     whether the grip COVID-19 has on society will continue
will be forced into our space, increasing human exposure.        to affect us for years to come, it has brought to light the

                              em • The Magazine for Environmental Managers • A&WMA • August 2020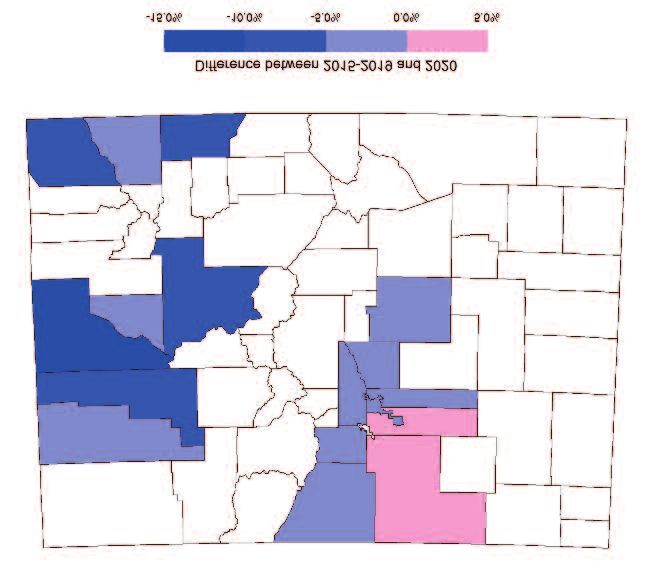
YP Perspective

underlying risks to the human population that we now have                        sustainable meat alternatives.22 The question remains
the adaptive capacity to mitigate. It has also revealed that hu-                 whether we will embrace these short-term actions and
mans can alter behavior when necessary. Telecommuting21 is                       intertwine them into our lives going forward. The benefits of
on the rise, and meat shortages due to the virus have led to                     doing so could be significant: a more resilient population and
more Americans exploring vegetable-based diets and                               cleaner planet for the next generation. em

   Kim Frauhammer is a degreed meteorologist and climate scientist who currently works as an air quality project consultant with Spirit
   Environmental, LLC in Denver, CO. E-mail: kfrauhammer@spiritenv.com

   Disclaimer: The views expressed in this article are those of the author and are not necessarily those of the author’s employer and/or
   A&WMA.

References
1. Balbus, J.; Crimmins, A.R.; Gamble, J.L. Ch. 1: Introduction: Climate Change and Human Health; https://health2016.globalchange.gov/climate-change-and-
    human-health (accessed June 3, 2020).
2. Physical Properties of Air. NASA. See https://sealevel.jpl.nasa.gov/overview/overviewclimate/overviewclimateair/ (accessed June 3, 2020).
3. Frauhammer, K. The millennial scientist; https://themillennialscientist.com/COVID-19/ (accessed June 3, 2020).
4. The real reason germs spread in winter. See https://www.bbc.com/future/article/20151016-the-real-reason-germs-spread-in-the-winter (accessed June 3,
    2020).
5. Wu, X.; Nethery, R.C. Exposure to Air Pollution and COVID-19 Mortality in the United States: A Nationwide Cross-Sectional Study; 2020.
6. Cui, Y.; Zhang, Z.-F. Air Pollution and Case Fatality of SARS in the People’s Republic of China: An Ecologic Study; 2003.
7. Nolte, C.G.; Dolwick, P.D.; Horowitz, L.W. Fourth National Climate Assessment: Chapter 13: Air Quality; https://nca2018.globalchange.gov/chapter/13/#fn:5
    (accessed June 3, 2020).
8. Air Quality Trends Show Clean Air Progress. See https://gispub.epa.gov/air/trendsreport/2019/#air_pollution (accessed June 3, 2020).
9. Pope III, C.A.; Ezzati, M.; Dockery, D.W. Fine-Particulate Air Pollution and Life Expectancy in the United States; New England Journal of Medicine, 2009.
10. Green Book. EPA. See https://www3.epa.gov/airquality/greenbook/ancl.html (accessed June 3, 2020).
11. Jacobs, P. Data Shows 30 Percent Drop In Air Pollution Over Northeast U.S.; NASA; https://www.nasa.gov/feature/goddard/2020/drop-in-air-pollution-over-
    northeast (accessed June 3, 2020).
12. TWC India Edit Team. Himalayan Peek: Thanks to Lockdown, Mighty Himalayas Are Visible from Bihar, Uttar Pradesh. See https://weather.com/en-
    IN/india/news/news/2020-05-06-himalayan-peek-lockdown-himalayas-visible-bihar-uttar-pradesh-punjab (accessed June 3, 2020).
13. Lindsey, R.; Dahlman, L.A. Climate Change: Global Temperature; NOAA Climate.gov; https://www.climate.gov/news-features/understanding-climate/climate-
    change-global-temperature (accessed June 3, 2020).
14. Drought and Climate Change. See https://www.c2es.org/content/drought-and-climate-change/(accessed June 3, 2020).
15. Burrows, L. The complex relationship between heat and ozone; Havard University Study; https://news.harvard.edu/gazette/story/2016/04/the-complex-relation-
    ship-between-heat-and-ozone/ (accessed June 3, 2020).
16. Horton, D.E.; Diffenbaugh, N.S. Response of Air Stagnation Frequency to Anthropogenically Enhanced Radiative Forcing; 2012.
17. Setti, L. SARS-Cov-2 RNA Found on Particulate Matter of Bergamo in Northern Italy: First Preliminary Evidence; 2020.
18. StarTalk: Coronavirus and Climate Change; StarTalk, 2020, 11.
19. Beard, C.B.; Eisen, R.J. Ch. 5: Vectorborne Diseases; https://health2016.globalchange.gov/vectorborne-diseases (accessed June 3, 2020).
20. Byrne, M.P.; O’Gorman, P.A. Trends in Continental Temperature and Humidity Directly Linked to Ocean Warming. In Proceedings of the National Academy of
    Sciences of the United States of America, 2018.
21. Guyot, K.; Sawhill, I.V. Telecommuting will likely continue long after the pandemic; https://www.brookings.edu/blog/up-front/2020/04/06/telecommuting-will-
    likely-continue-long-after-the-pandemic/ (accessed June 3, 2020).
22. King, R. The plant-based diet sees greatest gains yet as meat shortage fears grow; https://fortune.com/2020/05/15/coronavirus-meat-shortage-plant-based-
    food-vegan-vegetarian/ accessed June 3, 2020).

    YP Perspective is a semi-regular column organized by A&WMA’s Young Professional Advisory
    Council (YPAC). YPAC strives to effectively engage professionals within the Association by developing
    services and activities to meet the needs of today’s young professionals (YPs). A YP is defined by the
    Association as being 35 years of age or younger. Each YP is encouraged to get involved with
    the Association, whether within their local Chapter or Section or within the
    Association’s four Councils—Education Council, Technical Council, Sections and
    Chapters Council, and YPAC. YPs interested in getting involved may contact
    YPAC for more information on current volunteer and leadership opportunities.
    Call for Submissions: If you have a topic you would like to see YPs discuss
    in EM, e-mail: Kerry Weichsel.

                                   em • The Magazine for Environmental Managers • A&WMA • August 2020
You can also read