WELCOME TO THE UNITED STATES OF AUDIENCES - Media Across The U.S.A - OUTFRONT Media
←
→
Page content transcription
If your browser does not render page correctly, please read the page content below
WELCOME TO THE
UNITED STATES OF
AUDIENCES
Media Across The U.S.A.

COPYRIGHT © 2018 OUTFRONT MEDIA INC. ALL RIGHTS RESERVED LAST REVISED 11/20/2020
WE GET
YOU AMERICA
At OUTFRONT, we understand that to brands, audiences are
everything. Consumers have changed their daily habits but still
associate being outside the home with joy and according to the
Harris poll, have increased their notice rate of OOH media.

We provide an integrated and targeted platform to connect
brands to their desired audiences, as they live their lives.
We are famous for incomparable impact and creativity of our
medium – we champion the power of the biggest canvases
across North America to drive engagement, fame, and trust.
And we do it where it matters.

— We are everywhere. We empower smart brands to take
advantage of our ubiquity (500K canvases), our national footprint
(25 top markets), and our local community connections (and
relevance).

— We are front and center in the places where people live, work,
and play. From neighborhoods and communities, to urban centers
and transit hubs, to busier than ever highways and roads.

We leverage new technology to make OOH more relevant,
responsive, and rewarding. Plus we make all of your existing digital
investments work harder, including search, social, and mobile.

Intelligent OOH is about the permanent versus the transient.
The IRL to the URL. The confluence of and flexibility between
screens. Truth, trust, and transparency.

OUTFRONT. We help people, places, and
business grow stronger.

                                                                       COPYRIGHT © 2018 OUTFRONT MEDIA INC. ALL RIGHTS RESERVED LAST REVISED 11/20/2020   2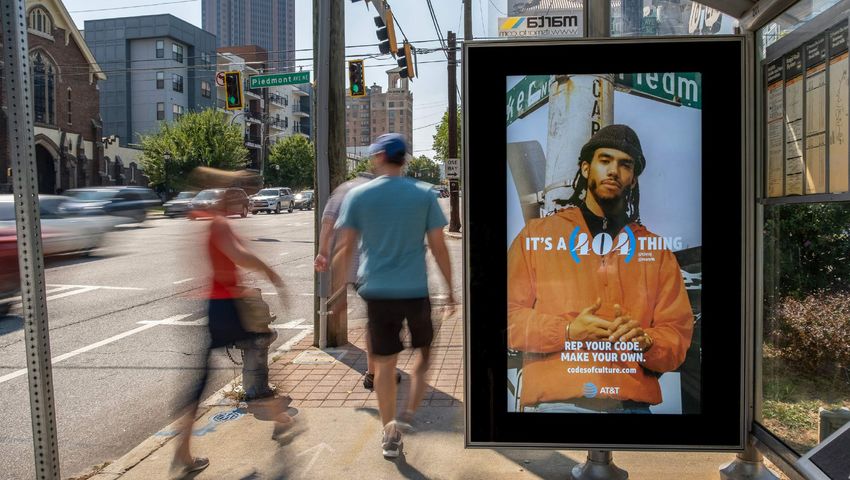
IMPACT WHERE
IT MATTERS
     WE LEVERAGE THE POWER OF
     TECHNOLOGY, LOCATION, AND CREATIVITY
     TO DRIVE IMPACT AND ENGAGEMENT
     BETWEEN BRANDS AND AUDIENCES.

TECHNOLOGY                                                             LOCATION                                                        CREATIVITY
Technology is a priority for OUTFRONT. We have the right               With over 500K canvases & presence in highly trafficked         Creative drives 70% of an ad’s effectiveness. OUTFRONT
hardware, software, and tools to make your campaigns more              transit hubs, OUTFRONT has national breath with deep            delivers the best inventory in the country, serving as the
targeted, efficient, and trackable. We know reaching the               local depth. This scale allows all brands, national or local,   perfect blank canvas for your brand story, illustrated
right people is a top priority. That’s why we use syndicated           to make an impact and maintain a national presence              through big, bold, and beautiful creative. Our location
research and real time mobile data to find people IRL.                 (7 out of 10 Americans weekly), with targeted messaging         based media provides unmatched contextual relevance
We also know that measurement matters. So, we have                     by market or demographic, delivered at a high frequency         to your target audience. Leverage our in-house creative
developed an attribution model that is scalable to meet                (20+ times a day).                                              agency, STUDIOS, for best in class creative services.
different business needs.

SOURCE: JIM SPAETH: CREATIVE ACCOUNTS FOR 70% OF OUT OF HOME AD ROI.                                                                   COPYRIGHT © 2018 OUTFRONT MEDIA INC. ALL RIGHTS RESERVED LAST REVISED 11/20/2020   3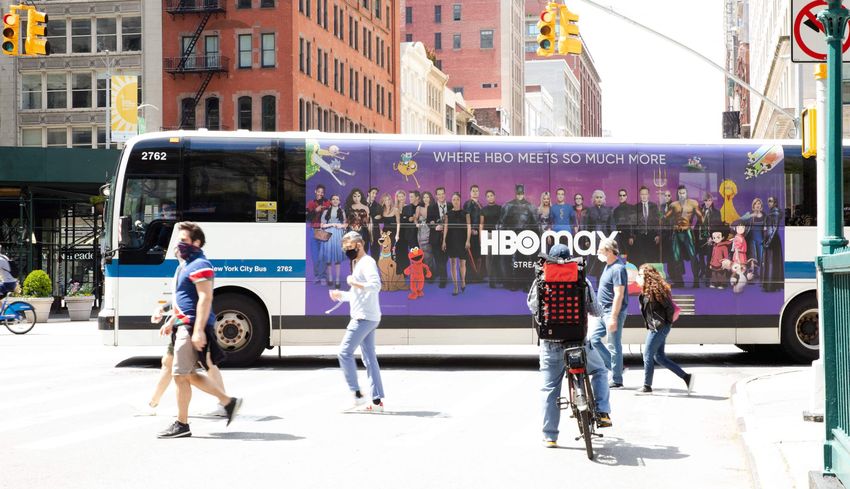
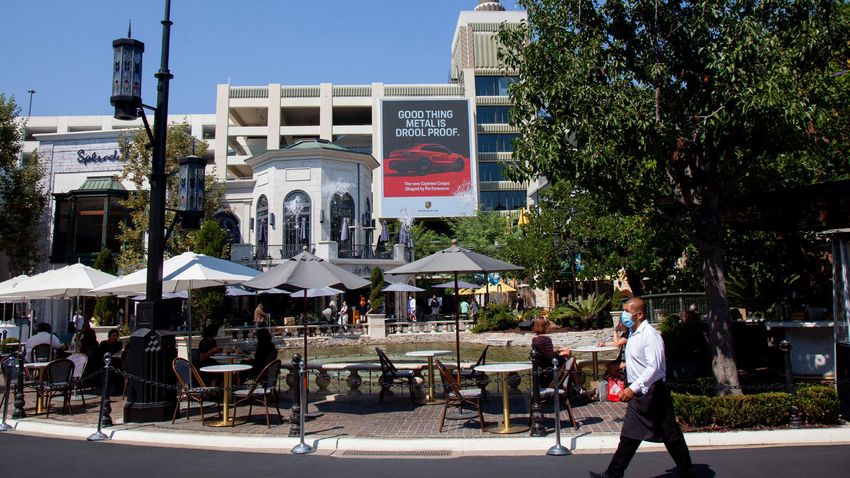
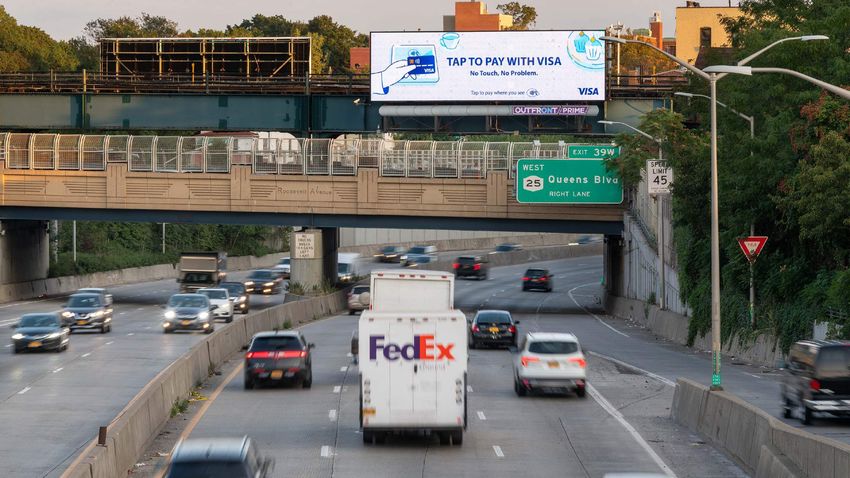
WE GET YOU
AUDIENCES
COVID-19 ACCELERATED MANY CONSUMER
TRENDS AND CHANGED BEHAVIORS,
HIGHLIGHTING AND INCREASING OUTFRONT’S
PROXIMITY MARKETING POWER. OUR
ABILITY TO INTEGRATE INTO COMMUNITIES,
DRIVE CONTEXTUAL AND SITUATIONAL
RELEVANCE, AND AMPLIFY DIGITAL MEDIA’S
EFFECTIVENESS UNIQUELY POSITIONS
OUTFRONT (AND YOUR MESSAGING) TO
IMPACT CONSUMERS.

RENEWED APPRECIATION FOR THE OUTDOORS                           INCREASED LOCALIZED TRAVEL                                 DIGITAL BURNOUT
People are eager to get out of the house, associating the       Personal vehicles have become their own form of PPE.       People are experiencing digital fatigue, with 68% agreeing
outdoors with joy and safety. In fact, 69% reported increased   In fact, many millennials have purchased a car during      that they spend too much time looking at screens. OOH
appreciation for their outdoor surroundings and 65% try         the pandemic. Over half of people report travel patterns   can both serve as relief with its IRL presence and creativity
to get out of the house as often as possible. The demand        that are the same or greater versus pre-COVID, with 40%    and amplify needed digital connection. Leverage the
for outdoors experiences continues to rise, whether that’s      walking more and 29% driving more. OOH’s localized         core strengths of OOH with the connectivity of mobile
walking around town, dining outside, or visiting outdoor pop-   proximity and relevance is key to connect.                 to provide more touchpoints of engagement and inspire
up-shops. This has driven a 45% increase in notice rates of                                                                people to search, shop, or share.
OOH ads compared to pre-pandemic.

SOURCE: THE HARRIS POLL, SEPTEMBER 2020.                                                                                   COPYRIGHT © 2018 OUTFRONT MEDIA INC. ALL RIGHTS RESERVED LAST REVISED 11/20/2020   4
LEVERAGE
OUR EDGE
                                                                                                                     CONSULTATION

                                                                                                                 CREATIVE
   OUTFRONT’S 360˚ PARTNERSHIP
   APPROACH ENSURES YOU GET
   THE EDGE ON YOUR COMPETITION.                                                                             PRODUCTION

                                                                                                         AMPLIFICATION

                                                                                                       ATTRIBUTION

CONSULTATION                      CREATIVE                          PRODUCTION                           AMPLIFICATION                                         ATTRIBUTION
DEFINING YOUR                     THE MOST CREATIVE                 LAUNCHING                            TAKING YOUR MESSAGE                                   TRACKING
CAMPAIGN                          OF ALL MEDIUMS                    YOUR CAMPAIGN                        FROM IRL TO URL                                       SUCCESS
Tap into our insights team,       Leverage our award winning        Let’s launch your brand story!       OOH is the best primer for                            Our suite of attribution
smartSCOUT™, or Geopath,          in-house creative agency,         With a full in-house operations      all things digital, including                         solutions can track the
to find the best canvases to      OUTFRONT STUDIOS, to aid with     team, your campaign will hit the     search, social, and mobile. Our                       successes of your campaign
reach your audience. Prefer to    anything from best practices to   streets in an impactful way.         communications team can assist                        based on particular KPIs like
buy programmatically? 1000+       full campaign development.                                             in press, social campaigns, and                       Foot Traffic, Web Traffic, Phone
canvases available to be bought                                                                          digital engagement tracking.                          Calls, Tune In, and Brand Affinity.
programmatically on top SSP &
DSP platforms.

                                                                                                                     COPYRIGHT © 2018 OUTFRONT MEDIA INC. ALL RIGHTS RESERVED LAST REVISED 11/20/2020   5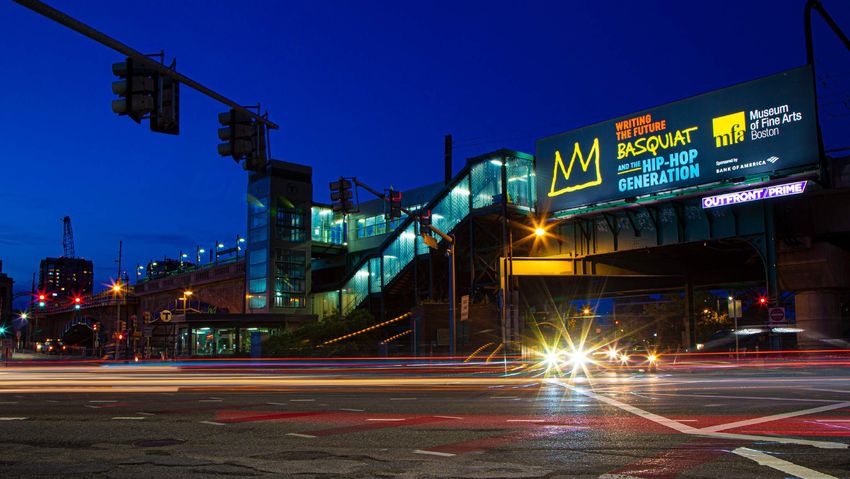
AMPLIFICATION
MATTERS
OUTFRONT is the best primer for digital engagement.
14.28 377
360 369
341 338 349
WITH
OOH
+40%
BANNER AD ON COMPUTER
BANNER AD ON COMPUTER
BANNER AD ON COMPUTER
48% TO CLICK AFTER
BEING EXPOSED
5.97 MORE LIKELY TO OOH
5.57
DIGITAL 130 135 135
4.58
SEARCH
3.73 92 93 96
2.94
OOH
43
RADIO
RADIO
RADIO
1.37 41 38
PRINT
PRINT
PRINT
OOH
OOH
DIGITAL DIGITAL
TV
TV
TV
RADIO VIDEO DISPLAY PRINT TV OOH
SEARCH SOCIAL MOBILE
When OOH is added to the media mix, it increases OOH drives nearly 4x more social/digital activations, Consumers are 48% more likely to engage with a mobile
search’s return on ad spend by 40%. per ad dollar spent, than any other media. In addition, ad after being exposed to the same ad on OOH first.
1 in 4 Americans has posted an OOH ad onto Instagram.
OOH drove 300% increase in search for an innovative A single digital billboard reached over 13 million book OOH & mobile drove over 19,000 people to
insulin company. Read more. lovers on social over a 8 week campaign. Read more. grocery stores in the San Francisco
area. Read more.
6
SOURCE: SEARCH: BENCHMARKETING, 2018, SOCIAL: NIELSEN, 2018,
MOBILE: OCEAN NEURO INSIGHTS. COPYRIGHT © 2018 OUTFRONT MEDIA INC. ALL RIGHTS RESERVED LAST REVISED 11/20/2020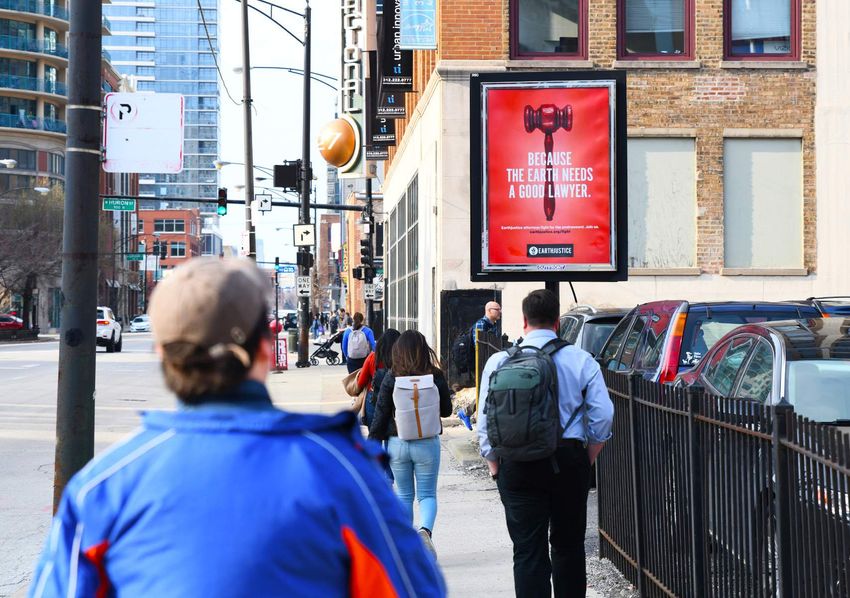
ATTRIBUTION
MATTERS
OUTFRONT’S COMPREHENSIVE
SOLUTIONS STACK PROVIDES CLIENTS
WITH THE FLEXIBILITY TO CHOOSE
ATTRIBUTION PRODUCTS BASED
ON SPECIFIC CAMPAIGN KPIs.

    FOOTFALL
    Footfall uses a consumer’s physical behavior to
    track incremental store and on-site visits to OOH
    campaigns they have viewed.

    ONLINE
    Online conversion tracking identifies when a consumer
    is exposed to OOH advertising and then visits the
    corresponding brand’s website or mobile app.

    TUNE-IN
    Devices exposed to OOH ads are mapped to
    households that viewed a specific program,
    measuring tune-in lift.

    LOCATION SURVEYING
    On site surveying provides brands with the opportunity
    to understand how audiences are responding to OOH
    creative. Awareness, ad recall, interest, and intent to
    buy attributes are measured, providing valuable insight
    around ROI and the true impact of the OOH buy.
                                                              COPYRIGHT © 2018 OUTFRONT MEDIA INC. ALL RIGHTS RESERVED LAST REVISED 11/20/2020   7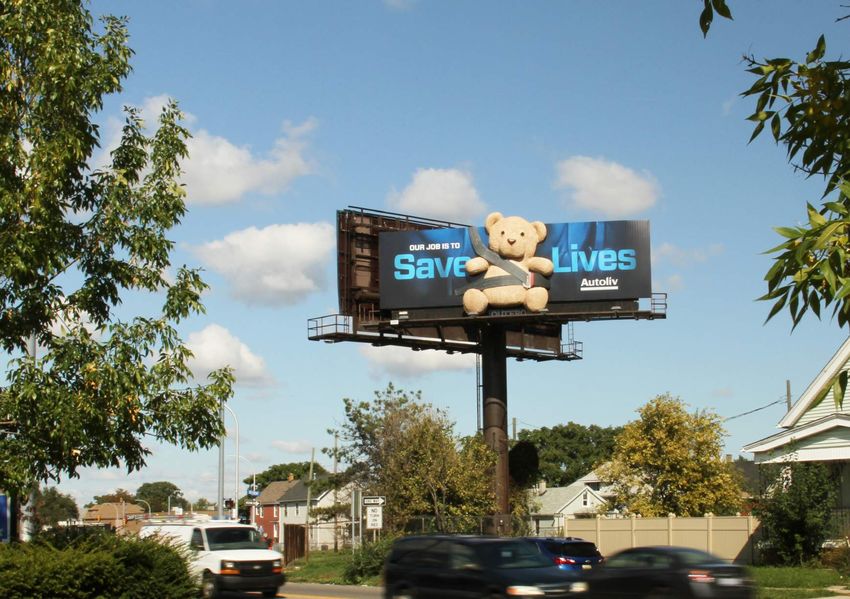
OOH’S 2021 PROJECTED GROWTH IS
HIGHER THAN ANY OTHER MEDIUM
US Media 2021 & 2022 Forecast

                                                               2022 FORECAST
      2021 FORECAST

                                                                    10%
                                                                  DIGITAL
                                                          9%
              7%                                         OOH
            DIGITAL                                                                                                                                3%
                                                  1%                                                                                              OOH
                                                 RADIO

                                   -2%                                                                                  -2%
                                                                               -3%
                                    TV                                                                                 RADIO
                                                                                TV
                                          -9%
                                         PRINT

                                                                                               -14%
                                                                                              PRINT

OOH & DIGITAL ARE THE ONLY TWO MEDIA CHANNELS
PROJECTED FOR GROWTH THROUGH 2022

SOURCE: MAGNA GLOBAL, JUNE 2020.                                                     COPYRIGHT © 2018 OUTFRONT MEDIA INC. ALL RIGHTS RESERVED LAST REVISED 11/20/2020   8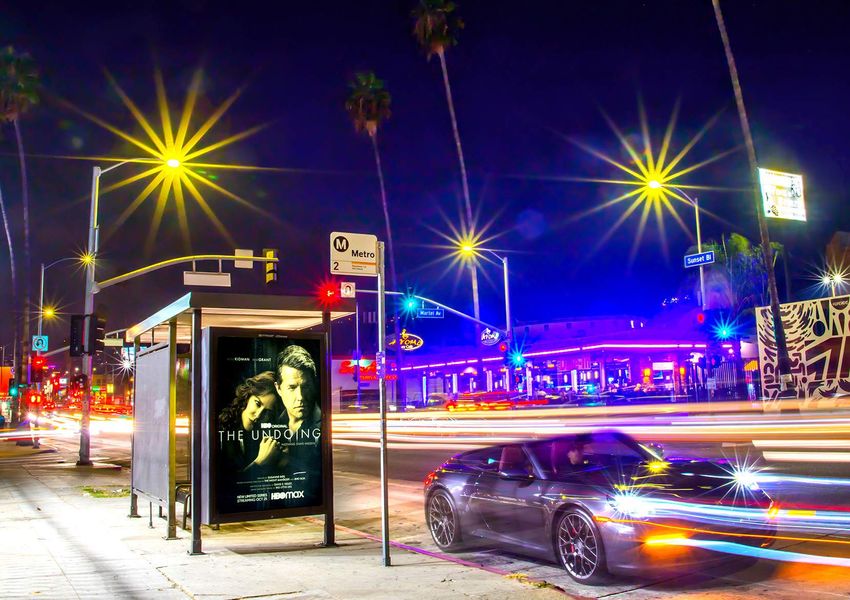
IMPACT WHERE IT MATTERS:
MEDIA ACROSS THE U.S.A.

YOUR STORY & YOUR AUDIENCE. OUR CANVAS.

                                          COPYRIGHT © 2018 OUTFRONT MEDIA INC. ALL RIGHTS RESERVED LAST REVISED 11/20/2020   9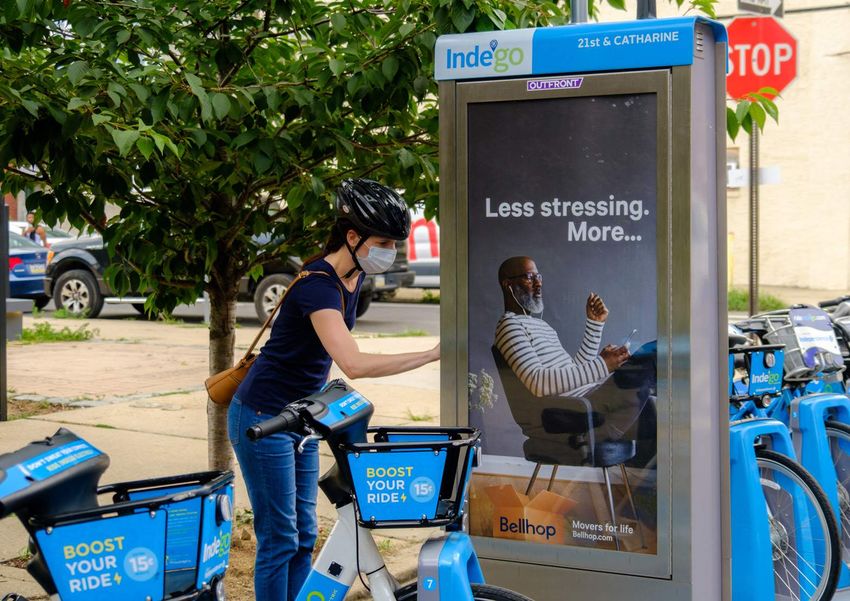
TOP 50 MARKETS
CBSA POPULATION POSTERS & COMMUTER RAIL MOBILE + SOCIAL
TOP 50 MARKETS AGE 18+
BULLETINS WALLSCAPES
JUNIOR POSTERS & SUBWAY
BUSES STREET FURNITURE SPECIALTY
NETWORKS
1 New York-Newark et al, NY-NJ-PA 15,104,964 ●● ● ●● ●●● ●● ●● ●● ●
2 Los Angeles-Long Beach et al, CA 10,414,332 ●● ● ●● ●● ●● ●●● ●● ●
3 Chicago et al, IL-IN-WI 7,322,459 ●● ● ●● ●● ●● ●
4 Dallas-Fort Worth-Arlington, TX 5,772,257 ●● ● ●● ● ●
5 Houston-The Woodlands et al, TX 5,342,259 ●● ● ●● ●
6 Miami-Fort Lauderdale et al, FL 5,015,236 ●● ●● ●●● ●● ●●● ●
7 Washington et al, DC-VA-MD-WV 4,903,390 ● ● ●●● ●● ● ●
8 Philadelphia et al, PA-NJ-DE-MD 4,809,395 ●● ● ● ●●● ●
9 Atlanta-Sandy Springs et al, GA 4,683,460 ●● ●● ●●● ●● ●●● ●
10 Boston-Cambridge-Newton, MA-NH 3,941,568 ●● ● ● ●●● ●● ●● ● ●
11 Phoenix-Mesa-Scottsdale, AZ 3,891,989 ●● ●● ●● ●● ●
12 San Francisco-Oakland et al, CA 3,828,529 ●● ● ● ●●● ●● ●● ● ●
13 Detroit-Warren-Dearborn, MI 3,385,363 ●● ● ● ●● ●
14 Seattle-Tacoma-Bellevue, WA 3,188,746 ● ● ●
15 Minneapolis-St. Paul, MN 2,827,057 ●● ● ● ●● ●
16 San Diego-Carlsbad, CA 2,627,944 ●● ● ● ● ●
17 Tampa St. Petersburg, FL 2,613,920 ●● ● ●
18 Denver-Aurora-Lakewood, CO 2,361,606 ●● ● ● ●
19 Baltimore-Columbia-Towson, MD 2,198,166 ● ●
20 St. Louis, MO-IL 2,189,428 ●● ● ●● ●
21 Orlando-Kissimmee-Sanford, FL 2,107,168 ●● ● ●
22 Portland-Vancouver, OR-WA 2,072,503 ● ● ●
23 San Antonio-New Braunfels-TX 2,005,010 ●● ●
24 Pittsburgh, PA 1,960,152 ● ●
25 Sacramento-Roseville, CA 1,875,440 ●● ●● ●
● INDICATES OUTFRONT MEDIA AVAILABLE ● INDICATES DIGITAL MEDIA AVAILABLE ● INDICATES WRAPPED MEDIA AVAILABLE
COPYRIGHT © 2018 OUTFRONT MEDIA INC. ALL RIGHTS RESERVED LAST REVISED 11/20/2020 10
NOTE: TOP 50 MARKETS BASED ON OUTFRONT INVENTORY AND POPULATION COUNT
SOURCE: CENSUS DATA (2021 UPDATE).TOP 50 MARKETS
CBSA POPULATION POSTERS & COMMUTER RAIL MOBILE + SOCIAL
TOP 50 MARKETS AGE 18+
BULLETINS WALLSCAPES
JUNIOR POSTERS & SUBWAY
BUSES STREET FURNITURE SPECIALTY
NETWORKS
26 Las Vegas-Henderson-Paradise, NV 1,794,296 ●● ●● ●
27 Cincinnati, OH-KY-IN 1,720,368 ● ●
28 Kansas City, MO-KS 1,661,410 ●● ● ● ●
29 Columbus, OH 1,652,274 ●● ● ● ●
30 Cleveland-Elyria, OH 1,618,391 ●● ●
31 Indianapolis-Carmel-Anderson, IN 1,595,630 ●● ●
32 San Jose-Sunnyvale et al, CA 1,570,361 ●● ● ●● ● ●● ●
33 Nashville-Davidson et al, TN 1,528,443 ●● ●
34 Virginia Beach et al, VA-NC 1,390,411 ● ●
35 Providence-Warwick, RI-MA 1,310,517 ●● ●● ●
36 Jacksonville, FL 1,245,849 ●● ●
37 Raleigh, NC 1,217,548 ● ●
38 Memphis, TN-MS-AR 1,020,551 ●● ●
39 Richmond, VA 1,020,487 ● ●
40 New Orleans-Metairie, LA 993,685 ●● ● ● ●
41 Louisville et al, KY-IN 990,018 ●● ● ● ●● ●
42 Hartford-West Hartford et al, CT 965,513 ●● ●● ● ● ●
43 Salt Lake City, UT 914,168 ●
44 Buffalo-Cheektowaga et al, NY 901,103 ● ●
45 Rochester, NY 850,635 ● ●
46 Grand Rapids-Wyoming, MI 831,154 ●● ●● ●
47 Worcester, MA-CT 756,980 ● ●
48 Bridgeport-Stamford-Norwalk, CT 737,995 ● ● ●
49 Fresno, CA 728,438 ●● ●● ●
50 Albany -Schenectady-Troy, NY 718,105 ● ●
● INDICATES OUTFRONT MEDIA AVAILABLE ● INDICATES DIGITAL MEDIA AVAILABLE ● INDICATES WRAPPED MEDIA AVAILABLE
NOTE: TOP 50 MARKETS BASED ON OUTFRONT INVENTORY AND POPULATION COUNT
COPYRIGHT © 2018 OUTFRONT MEDIA INC. ALL RIGHTS RESERVED LAST REVISED 11/20/2020 11
SOURCE: CENSUS DATA (2021 UPDATE).MEDIA FORMATS BILLBOARDS 13 SPECIALTY 29 BULLETINS 14 LIFESTYLE CENTERS 30 WALLSCAPES 15 AIRPORTS 31 POSTERS 16 KIOSKS 32 STREET FURNITURE 17 ICONIC LOCATIONS 33 SHELTERS 18 SECOND SCREEN MEDIA 34 METRO LIGHTS 19 MOBILE NETWORK 35 BIKE SHARE 20 SOCIAL MEDIA INTEGRATION 36 URBAN PANELS 21 TRANSIT 22 BUS EXTERIOR 23 BUS INTERIOR 24 RAIL EXTERIOR 25 RAIL & SUBWAY INTERIOR 26 RAIL & SUBWAY 27 LIVEBOARDS* 28 *NOTE: ALSO IN LIFESTYLE CENTERS COPYRIGHT © 2018 OUTFRONT MEDIA INC. ALL RIGHTS RESERVED LAST REVISED 11/20/2020 12
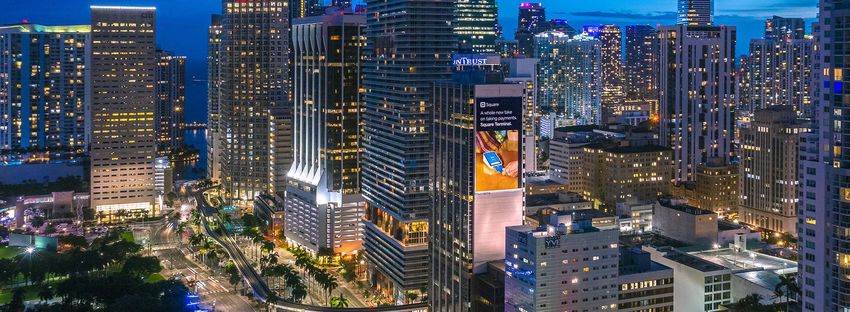
BILLBOARDS

                                                              BACK TO MEDIA FORMATS
        COPYRIGHT © 2018 OUTFRONT MEDIA INC. ALL RIGHTS RESERVED LAST REVISED 11/20/2020   13
BILLBOARDS
Billboards, which are located on key highways, intersections
and integral choke points throughout the U.S., provide your
message long-term presence and tremendous visibility
by vehicular traffic. Available in digital and static formats.
Watch billboards in action.
LOCATED IN THE
TOP 50 MARKETS
BACK TO MEDIA FORMATS
COPYRIGHT © 2018 OUTFRONT MEDIA INC. ALL RIGHTS RESERVED LAST REVISED 11/20/2020 14WALLSCAPES
Affixed to buildings in heavily trafficked CITIES
areas and visible from a great distance,
wallscapes provide maximum impact — Boston, MA — Houston, TX — New York, NY
for creative messages. Wallscapes — Chicago, IL — Kansas City, MO-KS — Philadelphia, PA
are perfect for penetrating urban
— Columbus, OH — Las Vegas, NV — San Diego, CA
centers and vary in size, providing
endless creative options. — Dallas, TX — Los Angeles, CA — San Francisco, CA
— Denver, CO — Miami, FL — St. Louis
Watch wallscapes in action.
— Detroit, MI — Minneapolis, MN — Washington, D
— Fairfield, NJ — New Orleans, LA
BACK TO MEDIA FORMATS
COPYRIGHT © 2018 OUTFRONT MEDIA INC. ALL RIGHTS RESERVED LAST REVISED 11/20/2020 15POSTERS
Located on major arterials and surface CITIES
streets, Posters allow advertisers to
completely saturate their chosen markets — Atlanta, GA — Detroit, MI — Los Angeles, CA — Orange County, CA — San Diego, CA
in a cost efficient way. Jr. Posters, — Boston, MA — Flint, MI — Louisville, KY — Orlando, FL — San Francisco, CA
positioned along secondary roadways,
— Chicago, IL — Fresno, CA — Minneapolis, MN — Phoenix, AZ — Seattle, WA
and in urban areas extend brand awareness
on the local level. These smaller canvas — Columbus, GA — Grand Rapids, MI — New Orleans, LA — Philadelphia, PA — St. Louis, MO
allows these signs to infiltrate in local — Columbus, OH — Hartford, CT — New Jersey, NJ — Portland, OR — Tampa, FL
neighborhoods, where Billboards are
— Denver, CO — Kansas City, MO — New York, NY — Sacramento, CA
zoned out. Available in digital and
static formats.
Check out this poster in action.
BACK TO MEDIA FORMATS
COPYRIGHT © 2018 OUTFRONT MEDIA INC. ALL RIGHTS RESERVED LAST REVISED 11/20/2020 16STREET FURNITURE
BACK TO MEDIA FORMATS
COPYRIGHT © 2018 OUTFRONT MEDIA INC. ALL RIGHTS RESERVED LAST REVISED 11/20/2020 17SHELTERS
Bus shelters are located at key consumer convergence points
throughout selected markets, following bus routes in urban areas, and
all the way into residential neighborhoods. 24/7 illumination provides
round-the-clock visibility to both pedestrian & vehicular traffic.
Watch shelters in action.
CITIES
— Atlanta, GA
— Los Angeles, CA
— Louisville, KY
— Miami, FL
— Orange County, CA
— Phoenix, AZ
— San Francisco, CA
— West Palm Beach, FL
BACK TO MEDIA FORMATS
COPYRIGHT © 2018 OUTFRONT MEDIA INC. ALL RIGHTS RESERVED LAST REVISED 11/20/2020 18METRO LIGHTS
Metro light panels complement and fill in street furniture coverage
in highly sought-after downtown locations. Our metro light panel
coverage penetrates the downtown and center city regions -
reaching educated, affluent professionals.
Watch metro lights in action.
CITIES
— Chicago, IL
— New York, NY
— Philadelphia, PA
BACK TO MEDIA FORMATS
COPYRIGHT © 2018 OUTFRONT MEDIA INC. ALL RIGHTS RESERVED LAST REVISED 11/20/2020 19BIKE SHARE
Increasingly, bike shares are becoming part of the urban commute
in top cities. According to the recent Harris Poll study, 27% of
people are biking more than ever. These units attract a younger,
environmentally friendly consumer. Connect your brand message to
the elusive Millennial demographic in the most desirable
urban neighborhoods.
Watch bikes shares in action.
CITIES
— Boston, MA
— Los Angeles, CA
— Philadelphia, PA
— San Diego, CA
— Washington, DC
SOURCE: THE HARRIS POLL, SEPTEMBER 2020.
BACK TO MEDIA FORMATS
COPYRIGHT © 2018 OUTFRONT MEDIA INC. ALL RIGHTS RESERVED LAST REVISED 11/20/2020 20URBAN PANELS
Situated above subway entrances, urban CITIES
panels are the most dominant and vibrant
street-level displays, allowing for an — Boston, MA
unrivaled connection with your target — New York, NY
audience. Available in video, digital, and
static formats.
Watch urban panels in action.
BACK TO MEDIA FORMATS
COPYRIGHT © 2018 OUTFRONT MEDIA INC. ALL RIGHTS RESERVED LAST REVISED 11/20/2020 21TRANSIT
BACK TO MEDIA FORMATS
COPYRIGHT © 2018 OUTFRONT MEDIA INC. ALL RIGHTS RESERVED LAST REVISED 11/20/2020 22BUS EXTERIOR
Buses serve as ‘rolling billboards’ traveling CITIES
in and around densely populated city
streets, leaving a lasting impact on — Atlanta, GA — Miami, FL
pedestrians, motorists and passengers. — Boston, MA — New York, NY
Eye level bus exterior ads provide
— Detroit, MI — Orange County, CA
maximum exposure for your brand.
Multiple bus enhancement options are — Flint, MI — San Francisco, CA
available, including extensions, headliners — Los Angeles, CA — Washington, DC
and full wraps.
— Las Vegas, NV
Watch buses in action. BACK TO MEDIA FORMATS
COPYRIGHT © 2018 OUTFRONT MEDIA INC. ALL RIGHTS RESERVED LAST REVISED 11/20/2020 23BUS INTERIOR
Maximize on long dwell time and engage CITIES
a captive audience with bus interior media.
Want more presence? A branded bus offers — Atlanta, GA — New York, NY
advertisers the unique opportunity to — Boston, MA — Orange County, CA
completely own the inside of the bus.
— Detroit, MI — San Francisco, CA
— Flint, MI — Washington, DC
Watch buses in action.
— Los Angeles, CA
— Miami, FL
BACK TO MEDIA FORMATS
COPYRIGHT © 2018 OUTFRONT MEDIA INC. ALL RIGHTS RESERVED LAST REVISED 11/20/2020 24RAIL EXTERIOR
Make a huge impact with rail exterior CITIES
media. Influence riders, onlookers,
vehicular traffic alike, as they are — Atlanta, GA — Los Angeles, CA — Phoenix, AZ
waiting trains to arrive or alongside — Boston, MA — Miami, FL — San Francisco, CA
major highways.
— Orange County, CA — New York, NY — Washington, DC
Watch subway & rail in action.
BACK TO MEDIA FORMATS
COPYRIGHT © 2018 OUTFRONT MEDIA INC. ALL RIGHTS RESERVED LAST REVISED 11/20/2020 25RAIL &
SUBWAY INTERIOR
Reach a captive audience on their CITIES
average 35 minute daily commute* each
way. Want a bigger presence? A brand car — Atlanta, GA — New York, NY
offers advertisers the unique opportunity — Boston, MA — Orange County, CA
to completely own the inside of the
— New Haven, CT — Phoenix, AZ
subway or rail car.
— Los Angeles, CA — San Francisco, CA
— Miami, FL — Washington, DC
Watch subway & rail in action.
SOURCE: MTA, 2019.
BACK TO MEDIA FORMATS
COPYRIGHT © 2018 OUTFRONT MEDIA INC. ALL RIGHTS RESERVED LAST REVISED 11/20/2020 26RAIL & SUBWAY
Deliver your message to the hard-to CITIES
reach commuter audience with high
impact subway ads! Tell your story through — Atlanta, GA — Orange County, CA
car cards, station platform posters, digital — Boston, MA — Phoenix, AZ
units, floor graphics, and turnstiles. Many
— Hartford, CT — San Francisco, CA
startups and millennial facing brands are
already using subway media to build — Los Angeles, CA — San Jose, CA
their brands. — Miami, FL — Washington, DC
— New York, NY
Watch subway & rail in action.
BACK TO MEDIA FORMATS
COPYRIGHT © 2018 OUTFRONT MEDIA INC. ALL RIGHTS RESERVED LAST REVISED 11/20/2020 27LIVEBOARDS
Liveboards, often arranged as a triptych, offer CITIES
advertisers endless creative opportunities to
engage audiences, from full motion video to sync. — Atlanta, GA — New York, NY
Strategically positioned in the highest traffic — Boston, MA — Rochester, MN
stations in major market transit hubs and lifestyle
— Los Angeles, CA — San Francisco, CA
centers, this scale allows advertisers to make a high
impact in a specific neighborhood or cross market. — Miami, FL — Washington, DC
— Minneapolis, MN
Our new MOMENTS content platform engages
commuters and shoppers, driving more eyeballs to
our canvases and your messaging.
BACK TO MEDIA FORMATS
COPYRIGHT © 2018 OUTFRONT MEDIA INC. ALL RIGHTS RESERVED LAST REVISED 11/20/2020 28
Watch liveboards in action.SPECIALTY
BACK TO MEDIA FORMATS
COPYRIGHT © 2018 OUTFRONT MEDIA INC. ALL RIGHTS RESERVED LAST REVISED 11/20/2020 29LIFESTYLE
CENTERS
Impact the highly affluent community, while they
are in a shopping frame of mind, through one of
our lifestyle centers.
Learn more about lifestyle centers.
CITIES
— Dallas, TX
— Los Angeles, CA
— Minneapolis-St. Paul, MN
— New Orleans, LA
— New York, NY
— Orange County, CA
— Rochester, MN
BACK TO MEDIA FORMATS
COPYRIGHT © 2018 OUTFRONT MEDIA INC. ALL RIGHTS RESERVED LAST REVISED 11/20/2020 30AIRPORTS
Engage the affluent business traveler through airport
media, on or in close proximity to the airport property.
Maximize on long dwell time with consumers eager
for something to engage with!
CITIES
— Atlanta, GA
— Chicago, IL
— East Hampton, NY
— Boston, MA
— Newark, NJ
— New York, NY
— Houston, TX
— San Diego, CA
— San Francisco, CA
— Washington, DC
BACK TO MEDIA FORMATS
COPYRIGHT © 2018 OUTFRONT MEDIA INC. ALL RIGHTS RESERVED LAST REVISED 11/20/2020 31KIOSKS
Located on primary streets in high- CITIES
profile, highly desired urban areas,
Kiosks provide coverage in areas zoned — Dallas, TX — Louisville, KY
out to other media. This gives advertisers — Las Vegas, NV — Hoboken, NJ
the opportunity to stand out and
— Houston, TX — San Francisco, CA
target audiences in areas with minimal
advertising, at a high frequency. — Los Angeles, CA
Watch kiosks in action.
BACK TO MEDIA FORMATS
COPYRIGHT © 2018 OUTFRONT MEDIA INC. ALL RIGHTS RESERVED LAST REVISED 11/20/2020 32ICONIC
LOCATIONS
These premium displays cover the CITIES
most desirable locations and audience
delivery so that brands can dominate — Los Angeles, CA
and make a statement. — New York, NY
— San Francisco, CA
Watch iconic locations in action.
BACK TO MEDIA FORMATS
COPYRIGHT © 2018 OUTFRONT MEDIA INC. ALL RIGHTS RESERVED LAST REVISED 11/20/2020 33SECOND
SCREEN MEDIA
BACK TO MEDIA FORMATS
COPYRIGHT © 2018 OUTFRONT MEDIA INC. ALL RIGHTS RESERVED LAST REVISED 11/20/2020 34MOBILE NETWORK
Combine the power of OOH with mobile PRODUCTS LOCATED IN THE
to create new engagement opportunities
— Proximity Targeting TOP 50 MARKETS
with your target audience. Targets the
right users by geofencing your OOH and — Retargeting
strategic locations, target by behavior,
— Behavioral or
then create message frequency with this
Brand Targeting
audience through retargeting.
— Transit System
Watch the mobile network in action. Audience Targeting
BACK TO MEDIA FORMATS
COPYRIGHT © 2018 OUTFRONT MEDIA INC. ALL RIGHTS RESERVED LAST REVISED 11/20/2020 35SOCIAL MEDIA
INTEGRATION
DRIVING CLIENT RESULTS ENGAGEMENT OPPORTUNITIES LOCATED IN THE
Social monitoring tracks lifts in location Organic TOP 50 MARKETS
based social conversation and search — Snapcodes + Filters
with geofencing, plus social conversation
around specific campaigns using — QR Codes
keywords, hashtags, phrases, etc. Social — Shazam Codes
listening metrics include: Reach, Spread, — Spotify Codes
Mentions, Sentiment, and Trends.
Paid
— AR
Watch social media integration in action.
— Influencers
BACK TO MEDIA FORMATS
COPYRIGHT © 2018 OUTFRONT MEDIA INC. ALL RIGHTS RESERVED LAST REVISED 11/20/2020 36WEGETYOU.COM 405 LEXINGTON AVENUE, NEW YORK, NY 10174 INSTAGRAM | YOUTUBE | LINKEDIN | TWITTER | FACEBOOK
You can also read